Download to read offline
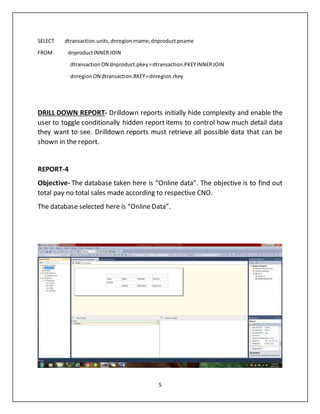
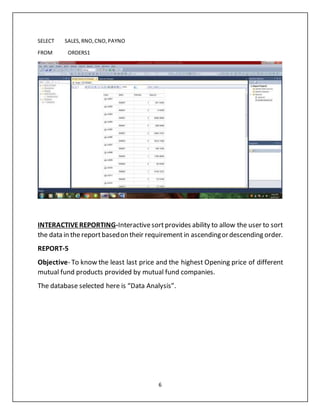

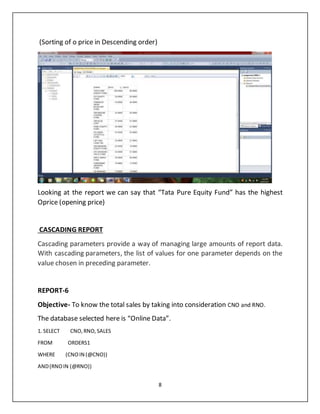
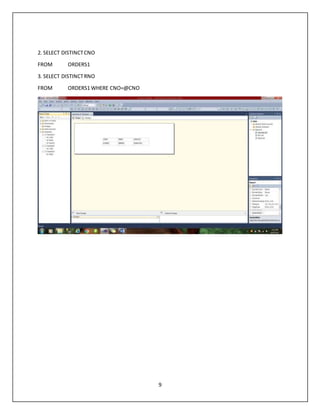


The document outlines various reports submitted for analysis, focusing on loan values from banks, bank shares of loans, and sales data, using databases like 'bank data' and 'online data'. Key findings include that personal loans have the highest values, CUB Bank has a significant share, and Tata Pure Equity Fund has the highest opening price among mutual funds. It also discusses drilldown, interactive, and parameterized reports in data analysis.


![]po[ Developers: Reporting, Indicators & Dashboards](https://cdn.slidesharecdn.com/ss_thumbnails/po-dev-reporting-options-130406-130430111251-phpapp02-thumbnail.jpg?width=640&height=640&fit=bounds)
![]project-open[ Reporting & Indicators Options](https://cdn.slidesharecdn.com/ss_thumbnails/po-dev-reporting-options-101006-101013103725-phpapp02-thumbnail.jpg?width=640&height=640&fit=bounds)
![]project-open[ Reporting & Indicators Options](https://cdn.slidesharecdn.com/ss_thumbnails/po-dev-reporting-options-101006-101013110238-phpapp01-thumbnail.jpg?width=640&height=640&fit=bounds)


