Download as PPSX, PPTX

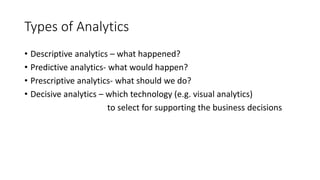
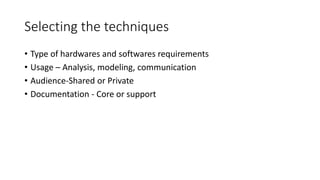
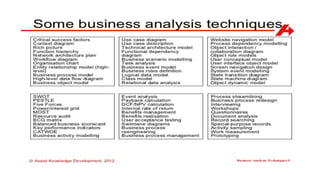
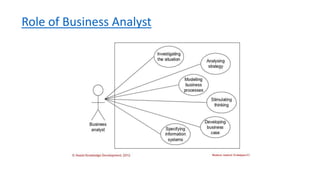


The document provides an overview of business analytics, highlighting its importance for data-driven decision making in organizations. It discusses the need for analytics to eliminate guesswork, gain insights into customer behavior, and generate key metrics, while also outlining challenges such as data volume and integration. Various types of analytics are detailed, including descriptive, predictive, prescriptive, and decisive analytics, along with techniques for selecting appropriate tools and strategies for developing business cases.


![[MPKD1] Introduction to business analytics and simulation](https://cdn.slidesharecdn.com/ss_thumbnails/introductiontobusinessanalyticsandsimulation-150908060653-lva1-app6891-thumbnail.jpg?width=640&height=640&fit=bounds)