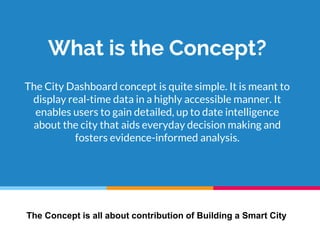
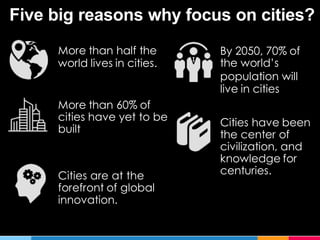
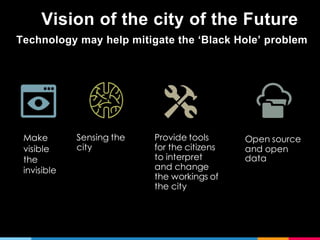
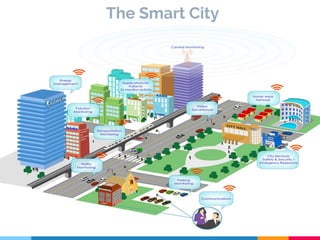
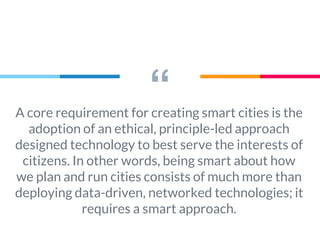
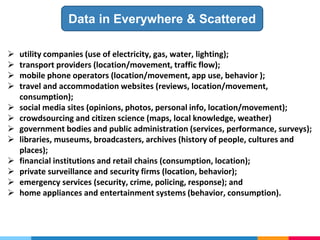
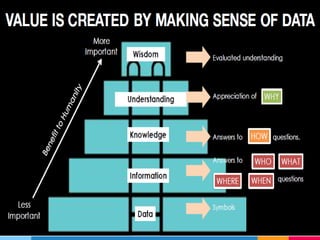
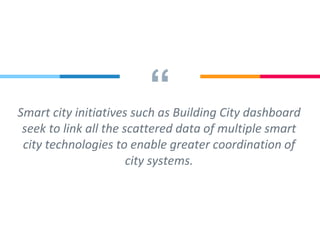
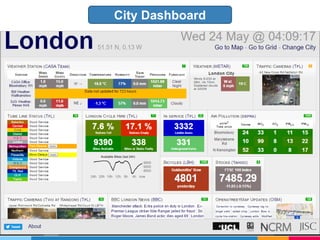
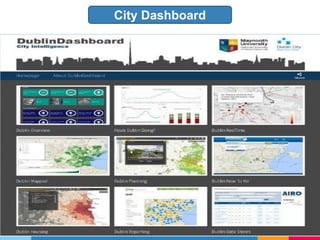
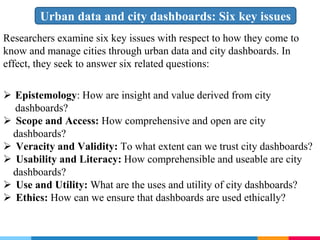
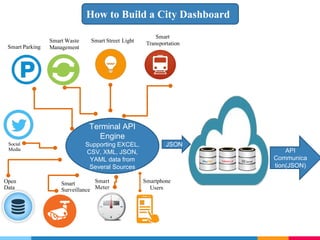
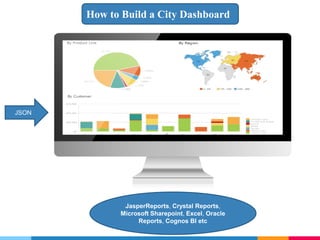
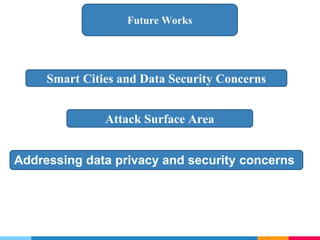
Building a City
Dashboard
What is the Concept?
The City Dashboard concept is quite simple. It is meant to
display real-time data in a highly accessible manner. It
enables users to gain detailed, up to date intelligence
about the city that aids everyday decision making and
fosters evidence-informed analysis.
The Concept is all about contribution of Building a Smart City
Five big reasons why focus on cities?
More than half the
world lives in cities.
By 2050, 70% of
the world’s
population will
live in cities
More than 60% of
cities have yet to be
built
Cities have been
the center of
civilization, and
knowledge for
centuries.Cities are at the
forefront of global
innovation.
Vision of the city of the Future
Technology may help mitigate the ‘Black Hole’ problem
Make
visible
the
invisible
Sensing the
city
Provide tools
for the citizens
to interpret
and change
the workings of
the city
Open source
and open
data
The Smart City
“A core requirement for creating smart cities is the
adoption of an ethical, principle-led approach
designed technology to best serve the interests of
citizens. In other words, being smart about how
we plan and run cities consists of much more than
deploying data-driven, networked technologies; it
requires a smart approach.
Smart Technologies
My project on IP
camera based face
Recognition System
can be leveraged for
optimal usage of
Digital Surveillance.
By using the generic
modules of the
project can also be
properly utilized in
other cross
disciplinary
applications such as
ANPR in Smart
Transport domain,
Human and Vehicle
counting etc...
My project on Smart Metering with IoT is closely mapped against the
major domain Smart Energy whereas there is crucial needs for
smart metering and smart energy apps.
 utility companies (use of electricity, gas, water, lighting);
 transport providers (location/movement, traffic flow);
 mobile phone operators (location/movement, app use, behavior );
 travel and accommodation websites (reviews, location/movement,
consumption);
 social media sites (opinions, photos, personal info, location/movement);
 crowdsourcing and citizen science (maps, local knowledge, weather)
 government bodies and public administration (services, performance, surveys);
 libraries, museums, broadcasters, archives (history of people, cultures and
places);
 financial institutions and retail chains (consumption, location);
 private surveillance and security firms (location, behavior);
 emergency services (security, crime, policing, response); and
 home appliances and entertainment systems (behavior, consumption).
Data in Everywhere & Scattered
“Smart city initiatives such as Building City dashboard
seek to link all the scattered data of multiple smart
city technologies to enable greater coordination of
city systems.
City Dashboard
City Dashboard
 Examine how City is performing on a number of metrics
and compared to other cities and regions;
 See how local authorities spend their budget;
 View what is happening with transport and the
environment in real-time;
 Interact with maps of the Census, crime, live register,
companies, housing, and planning;
 Find city services near to them;
 Report issues in their area; and
 Download data to conduct their own analysis or build
apps;
The Dashboard consists of several modules, each of
which contains a number of apps. Users can:
Urban data and city dashboards: Six key issues
Researchers examine six key issues with respect to how they come to
know and manage cities through urban data and city dashboards. In
effect, they seek to answer six related questions:
 Epistemology: How are insight and value derived from city
dashboards?
 Scope and Access: How comprehensive and open are city
dashboards?
 Veracity and Validity: To what extent can we trust city dashboards?
 Usability and Literacy: How comprehensible and useable are city
dashboards?
 Use and Utility: What are the uses and utility of city dashboards?
 Ethics: How can we ensure that dashboards are used ethically?
 First, there has to be a shift in the underlying epistemology of city dashboards to recognize
that they conceive the urban in a particular way and seek to understand and explain the city
using an approach which produces delineated and situated knowledge rather than
communicating objective, scientific truths.
 Second, limitations with respect to the scope of data and accessing datasets need to be
documented and also tackled by working with agencies and companies to open key datasets.
 Third, significant work needs to be undertaken to establish the veracity and validity of
datasets and analytics and dashboards need to be populated with appropriate metadata.
 Fourth, the usability of city dashboards in general and each specific tool needs to be
established through user testing, as well as methods to improve user experience, and
training and education tools to aid and improve data/analytics literacy need to be developed
and included in dashboards.
 Fifth, the instrumental rationality of city dashboards needs to be reconceived, with
dashboards always used in conjunction with other forms of knowledge and other modes of
governance when evaluating, managing and formulating the delivery city services and
policy.
 And lastly, the ethics and potential harmful uses of using city dashboards need to be further
examined and strategies developed to minimize any harms.
What is required, we believe, for city dashboards to
reach their full potential
Smart Waste
Management
Smart
Transportation
Smart Parking
Smart Street Light
Social
Media
Open
Data
Smart
Meter
Smart
Surveillance
Smartphone
Users
Terminal API
Engine
Supporting EXCEL,
CSV, XML, JSON,
YAML data from
Several Sources
JSON
API
Communica
tion(JSON)
How to Build a City Dashboard
JasperReports, Crystal Reports,
Microsoft Sharepoint, Excel, Oracle
Reports, Cognos BI etc
JSON
How to Build a City Dashboard
Future Works
Smart Cities and Data Security Concerns
Attack Surface Area
Addressing data privacy and security concerns
Thanks!
Any questions?
You can find me at:
russelchowdhury28@gmail.com
Reference
 Kitchin, R. (2016) Getting smarter about smart cities: Improving
data privacy and data security. Data Protection Unit,
Department of the Taoiseach, Dublin, Ireland.
 Kitchin, Rob. 2016. “Urban Data and City Dashboards: Six Key
Issues”. SocArXiv. September 1.
osf.io/preprints/socarxiv/k2epn.
 https://www.slideshare.net/mazlan1/introduction-to-iot-
smart-city

Building a City Dashboard

  • 1.
  • 2.
    What is theConcept? The City Dashboard concept is quite simple. It is meant to display real-time data in a highly accessible manner. It enables users to gain detailed, up to date intelligence about the city that aids everyday decision making and fosters evidence-informed analysis. The Concept is all about contribution of Building a Smart City
  • 3.
    Five big reasonswhy focus on cities? More than half the world lives in cities. By 2050, 70% of the world’s population will live in cities More than 60% of cities have yet to be built Cities have been the center of civilization, and knowledge for centuries.Cities are at the forefront of global innovation.
  • 5.
    Vision of thecity of the Future Technology may help mitigate the ‘Black Hole’ problem Make visible the invisible Sensing the city Provide tools for the citizens to interpret and change the workings of the city Open source and open data
  • 6.
  • 7.
    “A core requirementfor creating smart cities is the adoption of an ethical, principle-led approach designed technology to best serve the interests of citizens. In other words, being smart about how we plan and run cities consists of much more than deploying data-driven, networked technologies; it requires a smart approach.
  • 8.
    Smart Technologies My projecton IP camera based face Recognition System can be leveraged for optimal usage of Digital Surveillance. By using the generic modules of the project can also be properly utilized in other cross disciplinary applications such as ANPR in Smart Transport domain, Human and Vehicle counting etc... My project on Smart Metering with IoT is closely mapped against the major domain Smart Energy whereas there is crucial needs for smart metering and smart energy apps.
  • 9.
     utility companies(use of electricity, gas, water, lighting);  transport providers (location/movement, traffic flow);  mobile phone operators (location/movement, app use, behavior );  travel and accommodation websites (reviews, location/movement, consumption);  social media sites (opinions, photos, personal info, location/movement);  crowdsourcing and citizen science (maps, local knowledge, weather)  government bodies and public administration (services, performance, surveys);  libraries, museums, broadcasters, archives (history of people, cultures and places);  financial institutions and retail chains (consumption, location);  private surveillance and security firms (location, behavior);  emergency services (security, crime, policing, response); and  home appliances and entertainment systems (behavior, consumption). Data in Everywhere & Scattered
  • 11.
    “Smart city initiativessuch as Building City dashboard seek to link all the scattered data of multiple smart city technologies to enable greater coordination of city systems.
  • 12.
  • 13.
  • 14.
     Examine howCity is performing on a number of metrics and compared to other cities and regions;  See how local authorities spend their budget;  View what is happening with transport and the environment in real-time;  Interact with maps of the Census, crime, live register, companies, housing, and planning;  Find city services near to them;  Report issues in their area; and  Download data to conduct their own analysis or build apps; The Dashboard consists of several modules, each of which contains a number of apps. Users can:
  • 18.
    Urban data andcity dashboards: Six key issues Researchers examine six key issues with respect to how they come to know and manage cities through urban data and city dashboards. In effect, they seek to answer six related questions:  Epistemology: How are insight and value derived from city dashboards?  Scope and Access: How comprehensive and open are city dashboards?  Veracity and Validity: To what extent can we trust city dashboards?  Usability and Literacy: How comprehensible and useable are city dashboards?  Use and Utility: What are the uses and utility of city dashboards?  Ethics: How can we ensure that dashboards are used ethically?
  • 19.
     First, therehas to be a shift in the underlying epistemology of city dashboards to recognize that they conceive the urban in a particular way and seek to understand and explain the city using an approach which produces delineated and situated knowledge rather than communicating objective, scientific truths.  Second, limitations with respect to the scope of data and accessing datasets need to be documented and also tackled by working with agencies and companies to open key datasets.  Third, significant work needs to be undertaken to establish the veracity and validity of datasets and analytics and dashboards need to be populated with appropriate metadata.  Fourth, the usability of city dashboards in general and each specific tool needs to be established through user testing, as well as methods to improve user experience, and training and education tools to aid and improve data/analytics literacy need to be developed and included in dashboards.  Fifth, the instrumental rationality of city dashboards needs to be reconceived, with dashboards always used in conjunction with other forms of knowledge and other modes of governance when evaluating, managing and formulating the delivery city services and policy.  And lastly, the ethics and potential harmful uses of using city dashboards need to be further examined and strategies developed to minimize any harms. What is required, we believe, for city dashboards to reach their full potential
  • 20.
    Smart Waste Management Smart Transportation Smart Parking SmartStreet Light Social Media Open Data Smart Meter Smart Surveillance Smartphone Users Terminal API Engine Supporting EXCEL, CSV, XML, JSON, YAML data from Several Sources JSON API Communica tion(JSON) How to Build a City Dashboard
  • 21.
    JasperReports, Crystal Reports, MicrosoftSharepoint, Excel, Oracle Reports, Cognos BI etc JSON How to Build a City Dashboard
  • 22.
    Future Works Smart Citiesand Data Security Concerns Attack Surface Area Addressing data privacy and security concerns
  • 23.
    Thanks! Any questions? You canfind me at: russelchowdhury28@gmail.com
  • 24.
    Reference  Kitchin, R.(2016) Getting smarter about smart cities: Improving data privacy and data security. Data Protection Unit, Department of the Taoiseach, Dublin, Ireland.  Kitchin, Rob. 2016. “Urban Data and City Dashboards: Six Key Issues”. SocArXiv. September 1. osf.io/preprints/socarxiv/k2epn.  https://www.slideshare.net/mazlan1/introduction-to-iot- smart-city