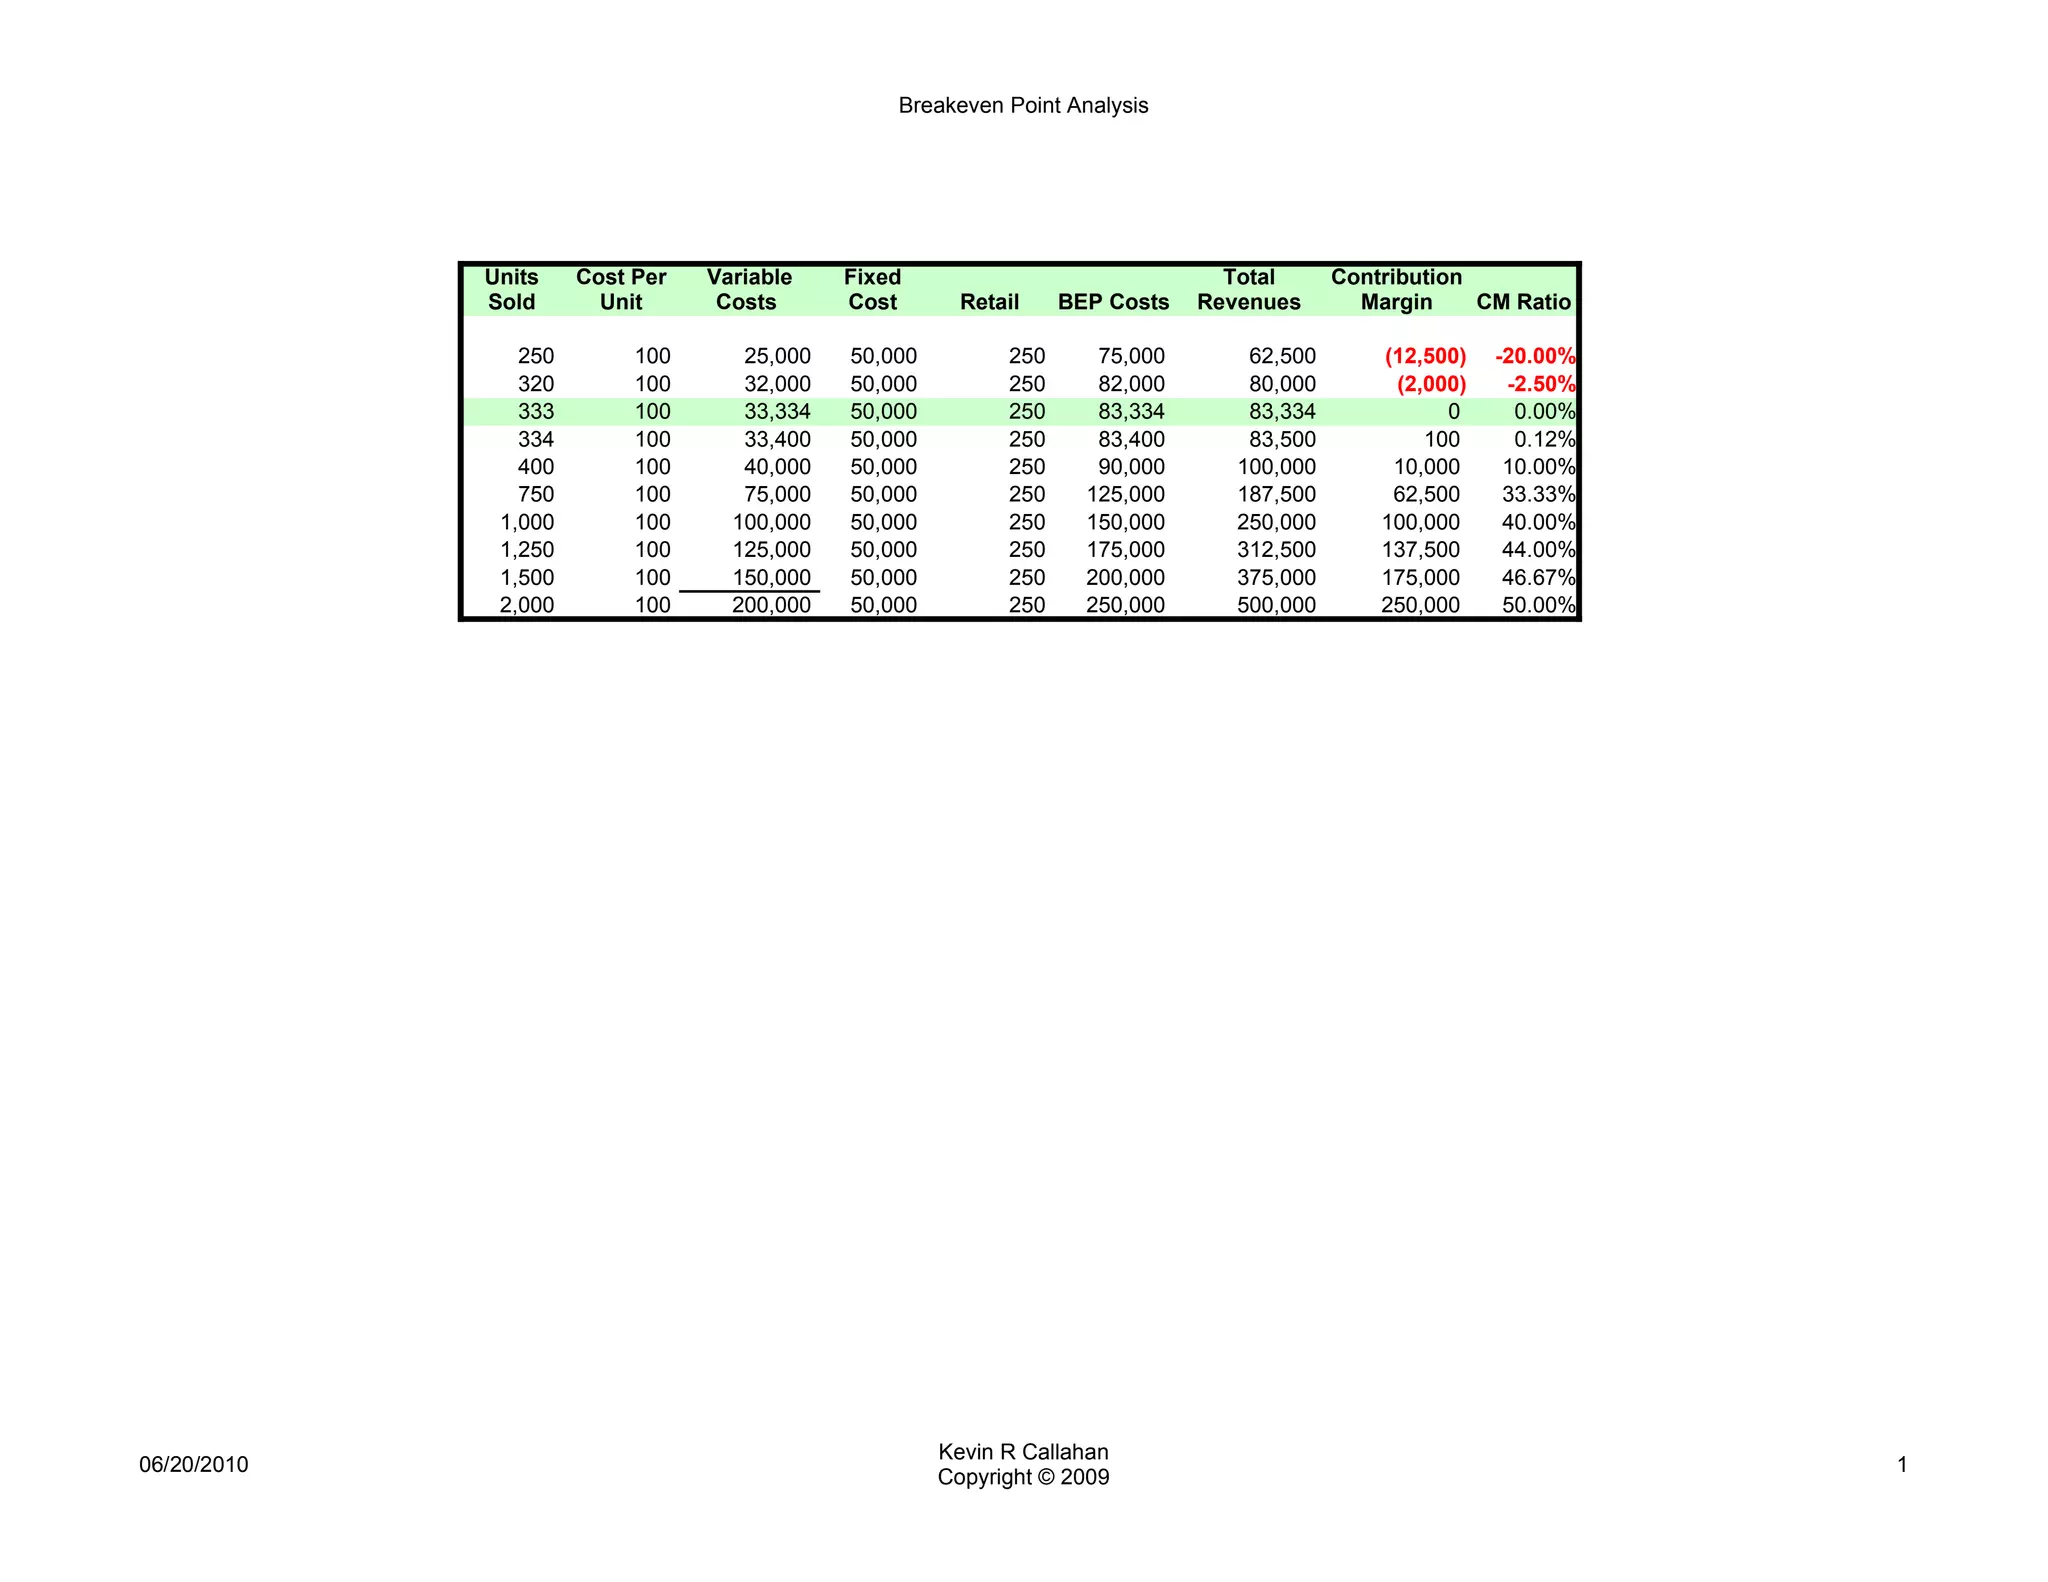
Breakeven Point Analysis


             Units    Cost Per   Variable    Fixed                              Total      Contribution
             Sold       Unit      Costs      Cost       Retail    BEP Costs   Revenues       Margin     CM Ratio

                250        100      25,000   50,000         250      75,000       62,500       (12,500)   -20.00%
                320        100      32,000   50,000         250      82,000       80,000        (2,000)    -2.50%
                333        100      33,334   50,000         250      83,334       83,334             0      0.00%
                334        100      33,400   50,000         250      83,400       83,500           100      0.12%
                400        100      40,000   50,000         250      90,000      100,000        10,000     10.00%
                750        100      75,000   50,000         250     125,000      187,500        62,500     33.33%
              1,000        100     100,000   50,000         250     150,000      250,000       100,000     40.00%
              1,250        100     125,000   50,000         250     175,000      312,500       137,500     44.00%
              1,500        100     150,000   50,000         250     200,000      375,000       175,000     46.67%
              2,000        100     200,000   50,000         250     250,000      500,000       250,000     50.00%


                                                      Kevin R Callahan
06/20/2010                                                                                                          1
                                                      Copyright © 2009

Break Even Analysis

  • 1.
    Breakeven Point Analysis Units Cost Per Variable Fixed Total Contribution Sold Unit Costs Cost Retail BEP Costs Revenues Margin CM Ratio 250 100 25,000 50,000 250 75,000 62,500 (12,500) -20.00% 320 100 32,000 50,000 250 82,000 80,000 (2,000) -2.50% 333 100 33,334 50,000 250 83,334 83,334 0 0.00% 334 100 33,400 50,000 250 83,400 83,500 100 0.12% 400 100 40,000 50,000 250 90,000 100,000 10,000 10.00% 750 100 75,000 50,000 250 125,000 187,500 62,500 33.33% 1,000 100 100,000 50,000 250 150,000 250,000 100,000 40.00% 1,250 100 125,000 50,000 250 175,000 312,500 137,500 44.00% 1,500 100 150,000 50,000 250 200,000 375,000 175,000 46.67% 2,000 100 200,000 50,000 250 250,000 500,000 250,000 50.00% Kevin R Callahan 06/20/2010 1 Copyright © 2009