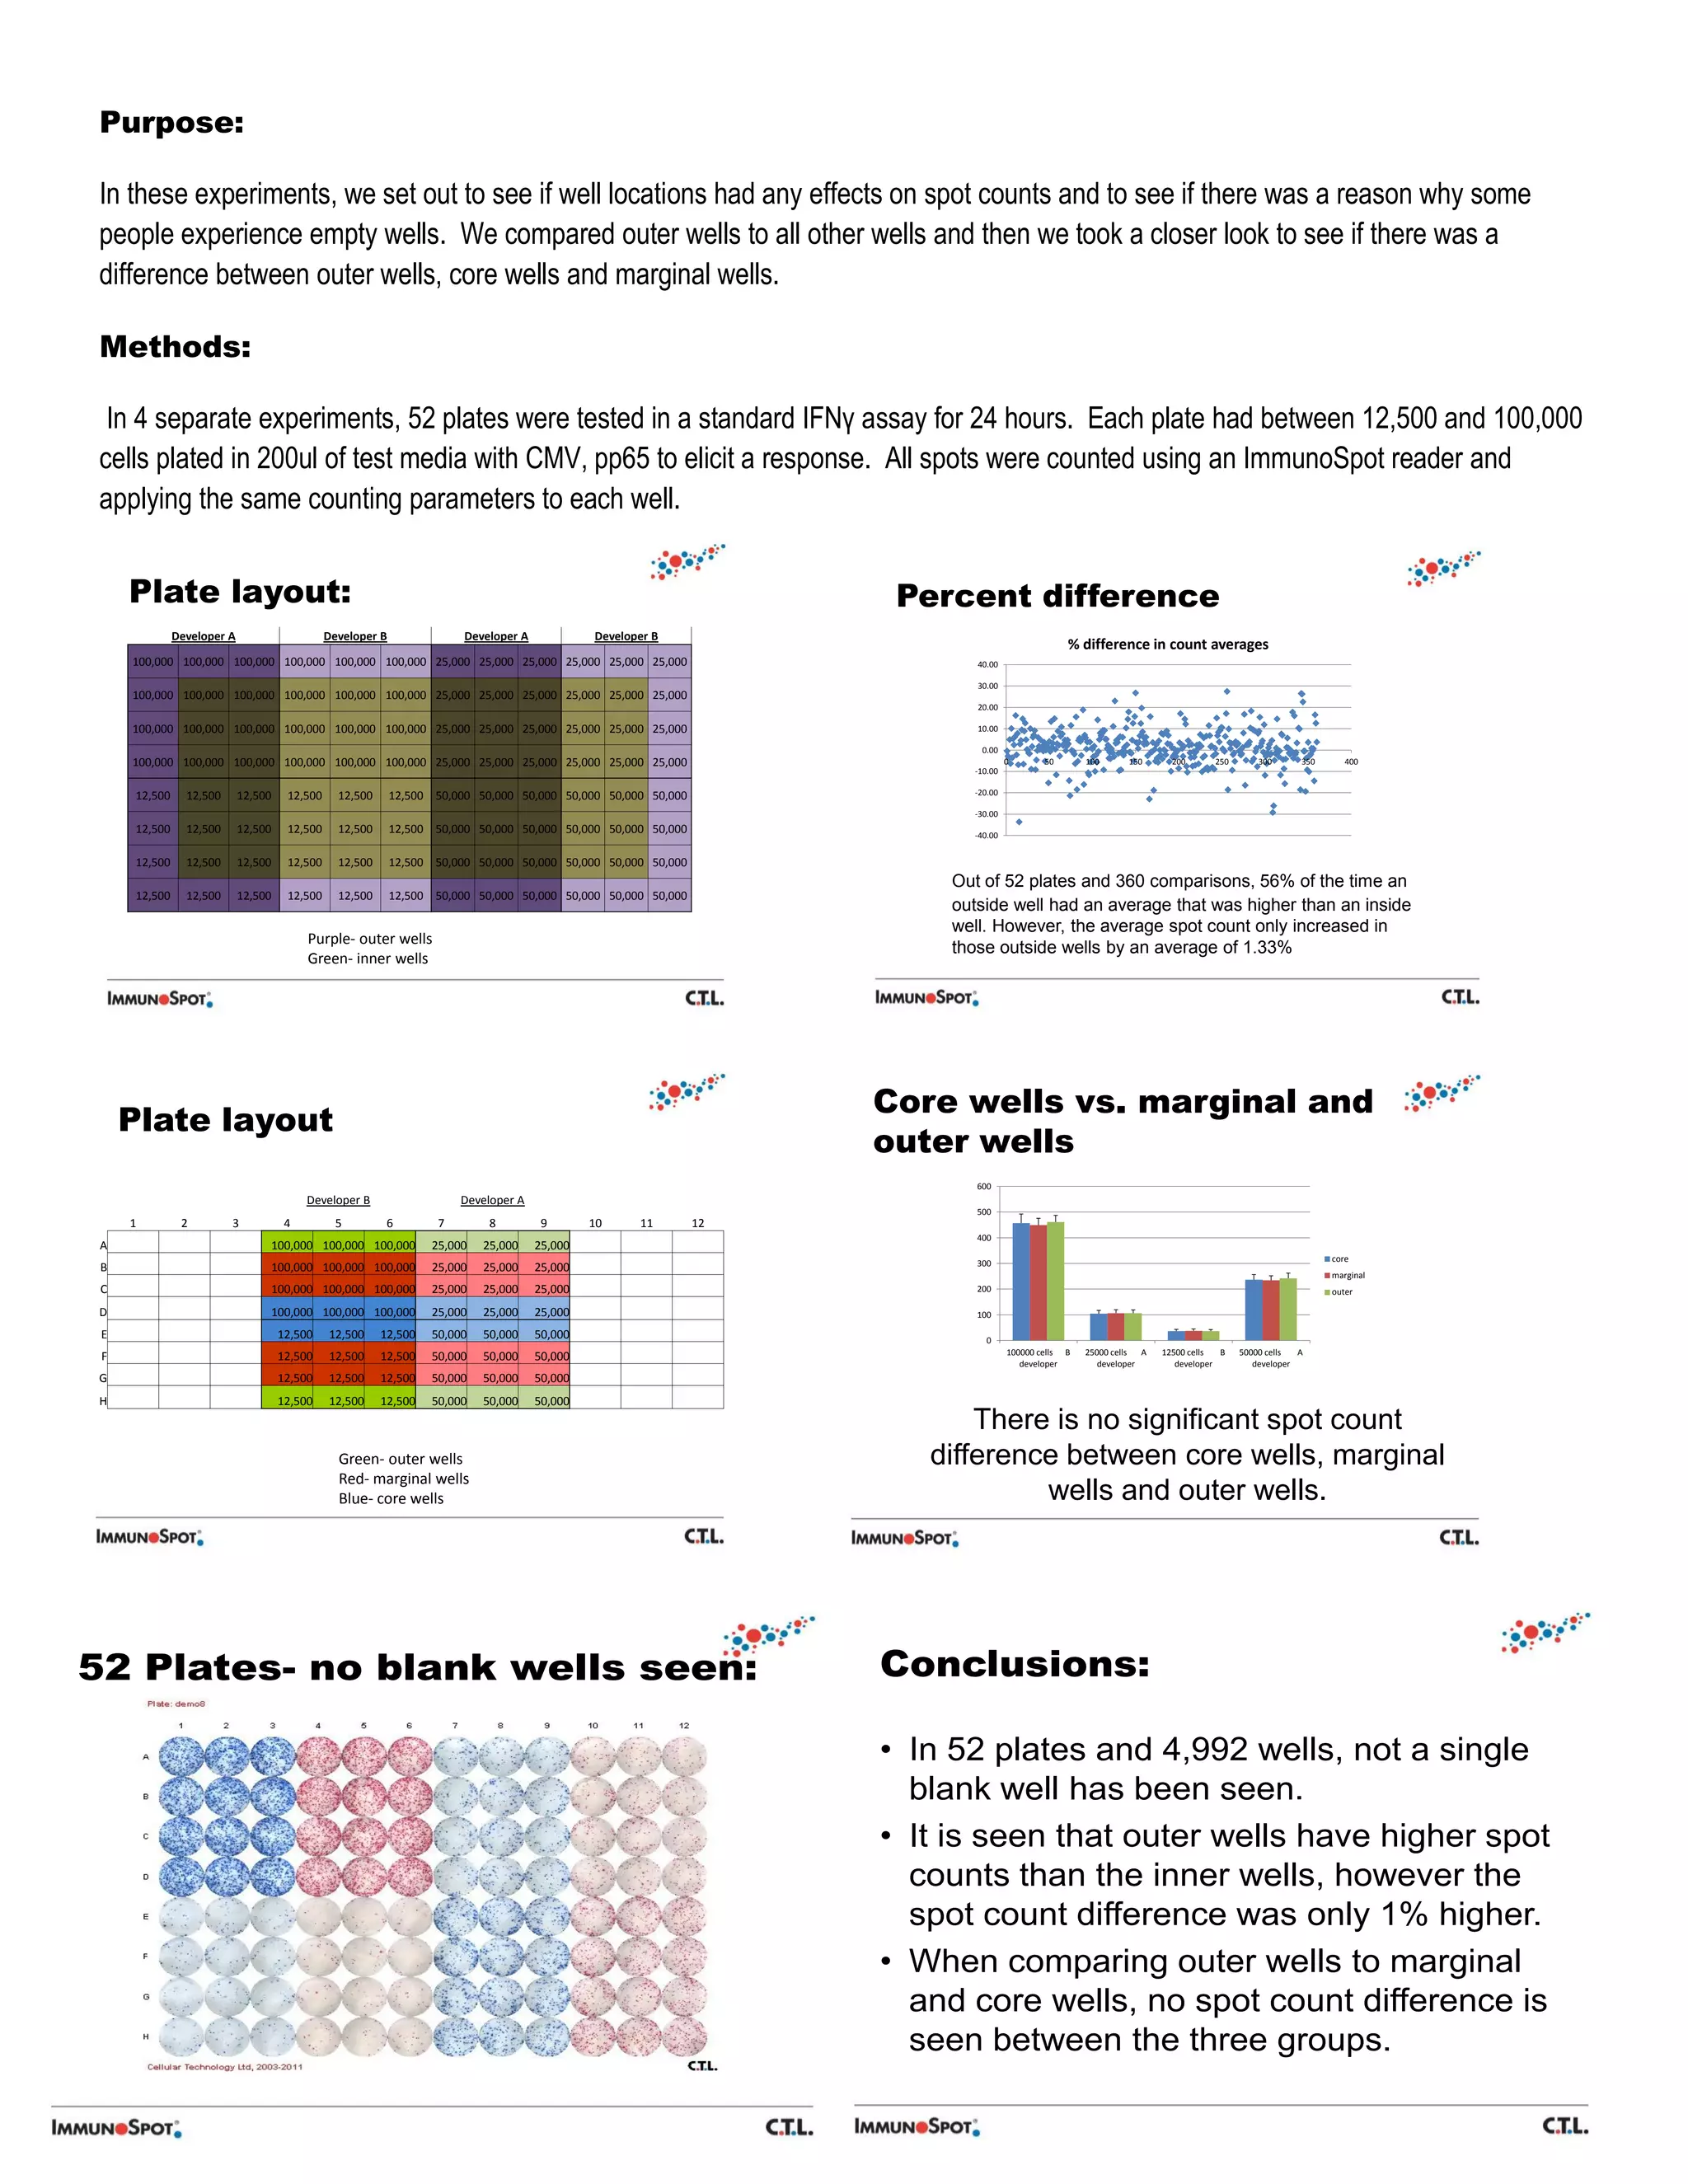
Purpose:

In these experiments, we set out to see if well locations had any effects on spot counts and to see if there was a reason why some
people experience empty wells. We compared outer wells to all other wells and then we took a closer look to see if there was a
difference between outer wells, core wells and marginal wells.

Methods:

 In 4 separate experiments, 52 plates were tested in a standard IFNγ assay for 24 hours. Each plate had between 12,500 and 100,000
cells plated in 200ul of test media with CMV, pp65 to elicit a response. All spots were counted using an ImmunoSpot reader and
applying the same counting parameters to each well.


     Plate layout:                                                                                                    Percent difference
              Developer A                      Developer B               Developer A            Developer B
                                                                                                                                                 % difference in count averages
     100,000 100,000 100,000 100,000 100,000 100,000 25,000 25,000 25,000 25,000 25,000 25,000                              40.00

                                                                                                                            30.00
     100,000 100,000 100,000 100,000 100,000 100,000 25,000 25,000 25,000 25,000 25,000 25,000
                                                                                                                            20.00

     100,000 100,000 100,000 100,000 100,000 100,000 25,000 25,000 25,000 25,000 25,000 25,000                              10.00

                                                                                                                             0.00
     100,000 100,000 100,000 100,000 100,000 100,000 25,000 25,000 25,000 25,000 25,000 25,000                                      0       50       100      150       200      250       300      350      400
                                                                                                                           -10.00

     12,500     12,500      12,500    12,500     12,500      12,500 50,000 50,000 50,000 50,000 50,000 50,000              -20.00

                                                                                                                           -30.00
     12,500     12,500      12,500    12,500     12,500      12,500 50,000 50,000 50,000 50,000 50,000 50,000              -40.00


     12,500     12,500      12,500    12,500     12,500      12,500 50,000 50,000 50,000 50,000 50,000 50,000
                                                                                                                         Out of 52 plates and 360 comparisons, 56% of the time an
     12,500     12,500      12,500    12,500     12,500      12,500 50,000 50,000 50,000 50,000 50,000 50,000
                                                                                                                         outside well had an average that was higher than an inside
                                                                                                                         well. However, the average spot count only increased in
                                          Purple- outer wells
                                                                                                                         those outside wells by an average of 1.33%
                                          Green- inner wells


                                                                                                                     Core wells vs. marginal and
     Plate layout
                                                                                                                     outer wells
                                                                                                                            600
                                          Developer B                   Developer A
                                                                                                                            500
     1         2         3            4          5         6        7        8          9       10     11       12
                                                                                                                            400
 A                               100,000 100,000 100,000           25,000   25,000     25,000
                                                                                                                            300                                                                           core
 B                               100,000 100,000 100,000           25,000   25,000     25,000
                                                                                                                                                                                                          marginal
 C                               100,000 100,000 100,000           25,000   25,000     25,000                               200                                                                           outer

D                                100,000 100,000 100,000           25,000   25,000     25,000                               100

 E                                   12,500    12,500     12,500   50,000   50,000     50,000                                 0
                                                                                                                                    100000 cells B   25000 cells  A   12500 cells  B   50000 cells  A
 F                                   12,500    12,500     12,500   50,000   50,000     50,000
                                                                                                                                       developer        developer        developer        developer
G                                    12,500    12,500     12,500   50,000   50,000     50,000
H                                    12,500    12,500     12,500   50,000   50,000     50,000
                                                                                                                            There is no significant spot count
                                                 Green- outer wells                                                     difference between core wells, marginal
                                                 Red- marginal wells
                                                 Blue- core wells                                                                wells and outer wells.


52 Plates- no blank wells seen:                                                                                      Conclusions:

                                                                                                                     • In 52 plates and 4,992 wells, not a single
                                                                                                                       blank well has been seen.
                                                                                                                     • It is seen that outer wells have higher spot
                                                                                                                       counts than the inner wells, however the
                                                                                                                       spot count difference was only 1% higher.
                                                                                                                     • When comparing outer wells to marginal
                                                                                                                       and core wells, no spot count difference is
                                                                                                                       seen between the three groups.

Spot Count Differences

  • 1.
    Purpose: In these experiments,we set out to see if well locations had any effects on spot counts and to see if there was a reason why some people experience empty wells. We compared outer wells to all other wells and then we took a closer look to see if there was a difference between outer wells, core wells and marginal wells. Methods: In 4 separate experiments, 52 plates were tested in a standard IFNγ assay for 24 hours. Each plate had between 12,500 and 100,000 cells plated in 200ul of test media with CMV, pp65 to elicit a response. All spots were counted using an ImmunoSpot reader and applying the same counting parameters to each well. Plate layout: Percent difference Developer A Developer B Developer A Developer B % difference in count averages 100,000 100,000 100,000 100,000 100,000 100,000 25,000 25,000 25,000 25,000 25,000 25,000 40.00 30.00 100,000 100,000 100,000 100,000 100,000 100,000 25,000 25,000 25,000 25,000 25,000 25,000 20.00 100,000 100,000 100,000 100,000 100,000 100,000 25,000 25,000 25,000 25,000 25,000 25,000 10.00 0.00 100,000 100,000 100,000 100,000 100,000 100,000 25,000 25,000 25,000 25,000 25,000 25,000 0 50 100 150 200 250 300 350 400 -10.00 12,500 12,500 12,500 12,500 12,500 12,500 50,000 50,000 50,000 50,000 50,000 50,000 -20.00 -30.00 12,500 12,500 12,500 12,500 12,500 12,500 50,000 50,000 50,000 50,000 50,000 50,000 -40.00 12,500 12,500 12,500 12,500 12,500 12,500 50,000 50,000 50,000 50,000 50,000 50,000 Out of 52 plates and 360 comparisons, 56% of the time an 12,500 12,500 12,500 12,500 12,500 12,500 50,000 50,000 50,000 50,000 50,000 50,000 outside well had an average that was higher than an inside well. However, the average spot count only increased in Purple- outer wells those outside wells by an average of 1.33% Green- inner wells Core wells vs. marginal and Plate layout outer wells 600 Developer B Developer A 500 1 2 3 4 5 6 7 8 9 10 11 12 400 A 100,000 100,000 100,000 25,000 25,000 25,000 300 core B 100,000 100,000 100,000 25,000 25,000 25,000 marginal C 100,000 100,000 100,000 25,000 25,000 25,000 200 outer D 100,000 100,000 100,000 25,000 25,000 25,000 100 E 12,500 12,500 12,500 50,000 50,000 50,000 0 100000 cells B 25000 cells A 12500 cells B 50000 cells A F 12,500 12,500 12,500 50,000 50,000 50,000 developer developer developer developer G 12,500 12,500 12,500 50,000 50,000 50,000 H 12,500 12,500 12,500 50,000 50,000 50,000 There is no significant spot count Green- outer wells difference between core wells, marginal Red- marginal wells Blue- core wells wells and outer wells. 52 Plates- no blank wells seen: Conclusions: • In 52 plates and 4,992 wells, not a single blank well has been seen. • It is seen that outer wells have higher spot counts than the inner wells, however the spot count difference was only 1% higher. • When comparing outer wells to marginal and core wells, no spot count difference is seen between the three groups.