Download to read offline
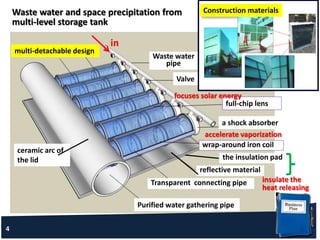
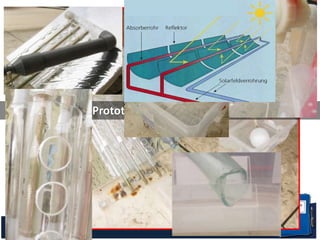
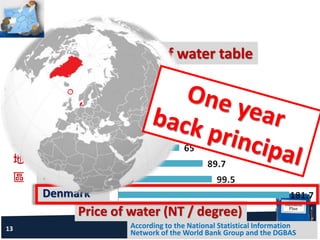


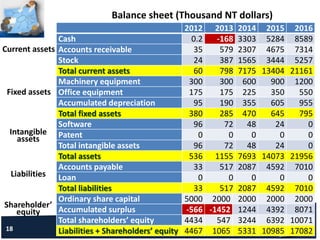

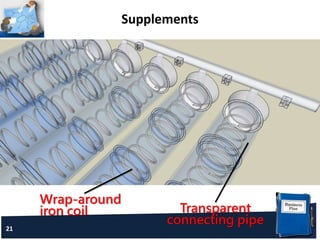
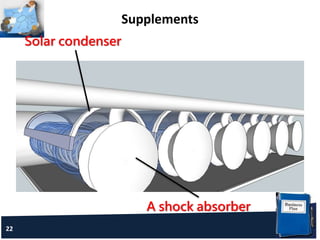


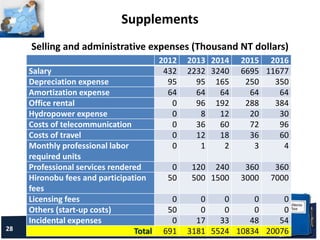
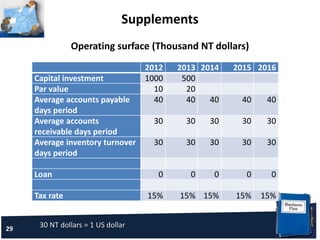

This document summarizes a presentation given by Shih-Kai Chou on an apparatus for continuous purification of household wastewater using solar power. The presentation discusses the business opportunity in wastewater treatment using solar energy. It describes the product, which uses various components like a shock absorber and reflective materials to distill wastewater into purified water using only solar power. Financial projections through 2016 show increasing sales and profits.


