1. THE EFFECT OF PSYCHOLOGICAL STRESS ON DIABETES MELLITUS
By
Samantha Boucher
A Senior Project submitted
In partial fulfillment of the requirements for the degree of
Bachelor of Science in Nutrition
Food Science and Nutrition Department
California Polytechnic State University
San Luis Obispo, CA
June 2015
2. Abstract
Psychological stress may affect blood glucose levels and control in type I
and type II diabetes. Acute stress causes temporary hyperglycemia in both type I
and type II diabetics because of the stress hormones released during the fight or
flight response. Whether or not chronic stress has the same effect on blood
glucose in unclear. From the current research in this topic area, researchers have
found that those who suffer from chronic stress or have had multiple severe life
events have a higher chance of developing both type I and type II diabetes. When
the researchers tested the effect of stress management, they found that in type II
diabetes stress management lowered hemoglobin A1c levels and led to increased
blood glucose control. But in type I diabetes, stress management did not have an
effect on overall blood glucose control. Currently, in order make a conclusion
about the effect of chronic stress on blood glucose and diabetes control, more
studies and clinical trials needs to be conducted that research chronic stress.
Currently the majority of studies only analyze acute stress, which may or may not
be comparable to the effect of chronic stress. With that being said, stress
management is still an extremely vital component of disease prevention and
management and overall well-being because chronic stress increases one’s
likelihood of developing diabetes and other chronic health conditions and may be
a contributing cause of chronic hyperglycemia.
3. 1
Introduction
Although most do not see stress as a silent killer, it is an issue that if not handled
correctly can lead to multiple health and psychological complications. In 2013, a stress survey
concluded that Americans report their stress levels have increased by 36% in the past year and
42% in the past five years. It would not necessarily be a problem for Americans if they knew
how to manage stress, but the same survey concludes that only 35% of these surveyors actually
practice effective stress management skills, while 65% either do not practice stress management
at all or they are not doing it in an effective manner (American Psychological Association
[APA], n.d. a). Chronic stress affects multiple systems in the body including the respiratory,
cardiovascular, musculoskeletal, nervous, gastrointestinal, the endocrine and the reproductive
system (APA, 2013.). Eventually, stress on all of the different systems for long periods of time
can lead to several diseases or decreased functioning of these systems.
Although the effect of stress on the different body systems plays an important role in
determining one’s mental and physical health, the main body system this paper will focus on is
the endocrine system. More specifically it will focus on the effect of stress and stress hormones
on diabetes mellitus. Diabetes is currently ranked as the seventh leading cause of deaths in the
United States and even though it is not ranked in the top three, the list of comorbidities and
complications that accompany diabetes increases its importance and seriousness. These include
hypertension, cardiovascular disease, stroke, kidney disease, amputations and blindness. Along
with the comorbidities, diabetes takes a great toll on the economy (American Diabetes
Association [ADA], 2014 b). In 2012, the cost of diagnosed diabetes in the United States was
245 billion dollars; direct medical costs were 176 billion dollars; and 69 billion dollars were
spent because of decrease productivity (ADA, 2014 b). The purpose of this paper is to explore
the effects of psychological stress on the different aspects of diabetes; glucose control, and
4. 2
insulin sensitivity. If a direct link between diabetes and stress can be made, then the prevalence,
incidence and high health care costs can be decreased by introducing stress management into
treatment and prevention efforts.
Stress and Stress Hormones
Defining Stress
Stress in general is a hard term to define because it can be acute stress, episodic acute stress,
or chronic stress. Within acute stress, it can be thrilling and exciting or it can be mentally
draining (APA, n.d. b). For example, getting ready for a first date may be considered an exciting
stressor while feeling stress from a time sensitive due date at work or school is an exhausting
mental stressor. Episodic stress is usually seen in people that always seem rushed or late, or they
contain a lot of nervous energy. Episodic stress can be dangerous if the person is unable to
control it (APA, n.d. b).
The main focus of this paper will be on chronic stress because it takes a much larger toll on
the body and mind. Chronic stress is defined as constant negative acute stress or any long term
threat to the body’s normal state of homeostasis caused by either internal and external forces or
stressors (Kyrou & Tsigos, 2009). Chronic stress can come from a stressful job or career, a
traumatic experience, poverty, or dysfunctional relationships (APA, n.d. b).
The human body and mind have a normal adaptive stress response during which
physiological and behavioral responses are rapidly set into action to attempt to re-establish a
normal state of homeostasis (Kyrou & Tsigos, 2009). During the adaptive stress response the
brain is primarily functioning to handle or fix the stressor or alleged threat. The brain releases
hormones that increase cardiac output and respiration, and re-direct the flow of blood to the
5. 3
muscles and heart in order to maximize the chance of survival for the individual (Kyrou &
Tsigos, 2009). This process is also commonly termed as the “fight or flight response”.
The adaptive stress response is a normal body function but when continuously stimulated
during chronic stress, it can become maladaptive and can have some potentially harmful
consequences (Kyrou & Tsigos, 2009). When there is continuous stimulation of the adaptive
stress response it can harm necessary physiological functions like metabolism, growth,
reproduction and immunocompetence. It can also hinder personality development and behavior,
and may also lead to a various amount of endocrine, metabolic, autoimmune and psychiatric
disorders (Kyrou & Tsigos, 2009; Charmandari, Tsigos & Chrousos, 2005).
Stress Hormones
There are several of hormones from both the central and peripheral nervous system that
contribute to the adaptive stress response. These hormones include corticotropin-releasing
hormone (CRH) and cortisol; β-endorphin; growth hormone; and the catecholamines,
norepinephrine and epinephrine (Charmandari, Tsigos & Chrousos, 2005).
Corticotropin-releasing hormone (CRH): CRH is one of the main triggers of the stress
hormone system also known as the hypothalamic-pituitary-adrenal axis (HPA axis), which is
responsible for the fight or flight response. CRH is a stress hormone that is secreted by the
hypothalamus which among other important functions triggers the release of adrenocortitropic
hormone which then travels through the blood stream and triggers the release of cortisol from the
adrenal glands (Charmandari, Tsigos & Chrousos, 2005). Cortisol when released by the adaptive
stress response leads to an increase in serum glucose, fatty acids and amino acids and to an
increase in blood pressure which helps with nutrient and respiratory gas delivery during stressful
events (Marieb & Hoehn, 2013).
6. 4
β-endorphin: β-endorphin is a neuropeptide that mainly acts to increase analgesia which
is reducing one’s sensitivity to pain under stress, and it also increases blood glucose in a similar
manner to cortisol (Marieb & Hoehn, 2013; Surwit & Schneider, 1993). β-endorphin is
stimulated by CRH’s activation of the stress response (Charmandari, Tsigos & Chrousos, 2005).
Growth hormone: The main actions of growth hormone include promoting growth and
transferring fat from fat depots for transport to the cells, which then increases their likelihood of
being used for fuel. It also spares glucose by decreasing the rate of glucose uptake and
metabolism. Growth hormone also stimulates the liver to release glucose into the blood through
glycogenolysis. This mechanism is called the anti-insulin effect because it does that exact
opposite of insulin; it raises blood glucose (Marieb & Hoehn, 2013).
Catecholamines: norepinephrine and epinephrine: Both of these hormones are stimulated
by the sympathetic nervous system and they increase heart rate, increase blood pressure through
vasoconstriction, and increase metabolic rate (Marieb & Hoehn, 2013). The combination of these
hormones reinforce and prolong the fight or flight response but since they are released by the
sympathetic nervous system instead of the adrenal cortex, their effect is very brief unlike the
long last effects of the those from the adrenal cortex (Marieb & Hoehn, 2013).
Effect of Stress Hormones on the Body
Effects of stress hormones on glucose metabolism: In general stress hormones are also
called counter-regulatory hormones because they usually have a hyperglycemic effect in humans
(Surwit & Schneider, 1993). Epinephrine increases glycogenolysis, gluconeogenesis, and
glucagon secretion and it decreases insulin secretion. Epinephrine also increases lipolysis which
increases the amount of free fatty acids in the blood stream. Cortisol increases gluconeogenesis
and lipolysis and it decreases glucose uptake by any other tissues except for the brain. That
7. 5
process is known as the glucose sparing effect (Nelms, Sucher, Lacey, Roth, 2011). Beta-
endorphin and norepinephrine decrease the production of insulin (Surwit & Schneider, 1993).
Growth hormone decreases glucose uptake by muscles; has a very similar glucose sparing effect
to that of cortisol (Nelms, Sucher, Lacey, Roth, 2011). Overall the end result of all these
hormones being released during stress is hyperglycemia. These metabolic changes and processes
caused by the adaptive stress response are easily handled short-term by an individual, but when
they are exposed to chronic stress and the effects of the hormones are prolonged, these changes
could potentially lead to complications.
Hyperactivity of the stress response and obesity: When an individual is unable to cope
with long periods of psychological stress and there is hyper-secretion of stress hormones, a
sequence of events takes place. First, there is an increase in visceral fat deposits, then insulin
resistance and hyperinsulinemia, then impaired glucose intolerance and altered lipid profiles,
which can eventually lead to many chronic diseases like heart disease if not treated. Although
most of the clinical experiments were conducted on primates, other studies performed in humans
have found a correlation between adverse life events, psychological disturbances, psychological
problems and the prevalence of obesity and metabolic syndrome (Vicennati, Pasqui, Cavazza,
Pagotto & Pasquali, 2009).
Diabetes Mellitus
Type I and type II diabetes
Diabetes mellitus is the result of either a decreased secretion or decreased effectiveness
of insulin. Insulin is a small protein produced by the pancreatic beta cells that acts by increasing
the transport of glucose and other simple sugars across the membrane of most body cells
including fat and muscle cells. Insulin also works by and inhibiting any metabolic activity that
8. 6
increases blood glucose levels like the conversion of fats or amino acids into glucose or the
liver’s break down of glycogen to glucose (Marieb & Hoehn, 2013). Insulin is an important
hormone in regulating the uptake of glucose for energy use and storage.
Hyposecretion of insulin is the result of an autoimmune response in type I diabetes
mellitus. This happens because the pancreatic beta cells are no longer able to produce sufficient
insulin for the body because the body’s immune system produced antibodies against the
pancreatic beta cells which attack and eventually destroy them (Marieb & Hoehn, 2013). On the
other hand, type II diabetes in the result of hypoactivity or decreased effectiveness of insulin,
which is a phenomenon called insulin resistance. With type II diabetes, the pancreatic beta cells
are still able to produce sufficient insulin for the body but the insulin receptors on the various
cells are unable to respond to it (Marieb & Hoehn, 2013).
Even though the causes of type I and type II diabetes are different the results are the
same; hyperglycemia because glucose is unable to be transported from the blood to the various
body cells. When a diabetic has hyperglycemia, a stress response is triggered which will put the
body into a hypoglycemic state to ensure that the cells are still able to receive glucose since they
are not able to get it from the food they are eating. In this hypoglycemic state, glycogenolysis,
lipolysis and gluconeogenesis occur. All of these processes produce more glucose and send it to
the blood to reach different body tissue cells, which in turn results in even higher blood glucose
levels than before. These processes also lead to increased levels of ketone bodies (the product of
incomplete fatty acid metabolism) which can be very dangerous if untreated because it can lead
to a ketone build up in the blood causing the pH of the blood to drop resulting in ketoacidosis
which is life-threatening (Marieb & Hoehn, 2013).
Prevalence and Incidence Rates:
9. 7
In the United States alone, 29.1 million people have diabetes (ADA, 2014 b). This
measurement was last taken in 2012 and the number since then has continued to rise. In 2010
there were 25.8 million cases meaning that in a span of two years, three million more people
developed diabetes. Most of these 29.1 million cases are type II diabetes; only 1.25 million of the
29.1 million have type I which includes both adults and children (ADA, 2014 b). The amount of
pre-diabetics has also steadily increased. In 2010 there were 79 million people with pre-diabetes
and then in 2012 that number increased to 86 million cases (ADA, 2014 b). Also, within our
youth, type II diabetes is becoming more common compared to before where type I diabetes was
predominately seen in people under 20. Between 2008 and 2009 the yearly incidence of diabetes
was estimated at 18,436 with type I and 5,089 with type II (ADA, 2014 b).
Symptoms/ Clinical Manifestations:
In type I diabetes, symptoms are not normally seen until about 60 to 80% of the beta cells
in the pancreas have been destroyed. These symptoms are consequences of insulin deficiency;
hyperglycemia because decreased glucose uptake into cells and increased gluconeogenesis;
ketosis or metabolic acidosis (depending on how long diabetes has been untreated) because of
the increased levels of blood fatty acids from lipolysis; dehydration because of hyperglycemia,
there is an increase of glucose in the urine which leads to osmotic diuresis and frequent
urination; polyphagia or increased appetite because of the decrease of cellular uptake by the
cells; and weight loss because of increased protein degradation and muscle wasting (Nelms,
Sucher, Lacey, Roth, 2011).
Type II diabetes will usually not present symptoms for six to 10 years but complications
associated with diabetes and hyperglycemia are present. Issues with the heart, eyes, kidneys, and
10. 8
nerves can appear because of the vessel damage caused by hyperglycemia (Nelms, Sucher,
Lacey, Roth, 2011).
Diagnoses:
In order to be diagnosed with diabetes mellitus a person must have one of three of the
following: symptoms of diabetes plus casual plasma glucose concentration greater than or equal
to 200mg/dL or fasting plasma glucose of greater than 126mg/dL or two hour post meal glucose
of greater than or equal to 200mg/dL during an oral glucose tolerance test (Nelms, Sucher,
Lacey, Roth, 2011).
The different tests and laboratory measurements used to diagnosis diabetes mellitus and
assess risk include the oral glucose tolerance test (OGTT), hemoglobin A1C and casual plasma
glucose test (ADA, 2014 a). The oral glucose tolerance test is a test that checks plasma glucose
levels before and two hours after the patient drinks eight ounces of syrupy glucose solution
containing about 75 grams of sugar and it allows the physician to get an idea of how the patient’s
body is processing glucose (ADA, 2014 a). Hemoglobin A1C is a measurement that tells the
physician how much glucose is bound to the protein, hemoglobin (glycosylated hemoglobin),
that reflects the average blood glucose levels from the past two or three months (Nelms, Sucher,
Lacey, Roth, 2011). A casual plasma glucose test is simply a blood glucose check that can occur
at any time of the day (ADA, 2014 a).
Complications and co-morbidities of diabetes mellitus
Complications from diabetes mellitus result from long term hyperglycemia; it results in
microvascular and macrovascular complications that take a toll on quality of life and increase
mortality and morbidity substantially. Cardiovascular disease is a macrovascular complication of
diabetes. High blood glucose levels increase the damage that can be done to the blood vessels. It
11. 9
affects the flexibility of the blood vessels and the structure of the membranes making it harder
for blood to pass through, putting more pressure on the vessels (Nelms, Sucher, Lacey, Roth,
2011).
Microvascular complications include retinopathy, nephropathy and neuropathy.
Retinopathy seems to be the direct result of blood vessel damage from hyperglycemia. Since the
eye is highly vascularized and requires a lot of oxygen, if the blood vessels are unable to provide
that sufficiently then it could potentially lead to blindness, cataracts and glaucoma (Nelms,
Sucher, Lacey, Roth, 2011). Nephropathy occurs because of the negative effects hyperglycemia
has on the blood vessels as well. The glomerulus, which is the functional unit of the kidney, has
a collection of capillaries that if to get damaged would lead to increased permeability and
decreased filtering ability. That leads to larger molecules like proteins being leaked out into the
urine. Nephropathy can eventually lead to kidney failure and chronic kidney disease (Nelms,
Sucher, Lacey, Roth, 2011). Neuropathy is also caused by the long term presence of
hyperglycemia. There is an accumulation of abnormal substances that can lead to the disruption
of the normal nervous system pathways. Those abnormal substances include sorbitol and
glycosylated proteins that lead to the cellular damage, interrupting those pathways. Neuropathy
causes decreased sensation or pain in the hands or feet, decreased digestion of food, carpal tunnel
syndrome and many other nerve problems (Nelms, Sucher, Lacey, Roth, 2011).
The most common co-morbidities of diabetes include hypertension, obesity and
dyslipidemia that link directly to the complications of diabetes; neuropathy and nephropathy.
There are also higher rates of depression, heart failure, anxiety and arthritis in diabetics which
can decrease their quality of life as well as increase the difficulty of diabetes management
(Nelms, Sucher, Lacey, Roth, 2011).
12. 10
Treatment
Type I diabetics rely on daily injections of insulin in order to mimic insulin secretion in a
non-diabetic. The main treatment goal for type I diabetes is to avoid hyperglycemia. If blood
glucose can be steadied long-term, then the development of complications will be stunted. Also
the use of nutrition therapy and regular physical activity in congruence with insulin injections
will allow for better control of blood glucose levels. (Nelms, Sucher, Lacey, Roth, 2011).
Type II diabetes treatment includes physical activity, nutrition therapy and medication,
when necessary, in order to control blood glucose. Ideally type II diabetes could be manageable
with just nutrition therapy and physical activity but when it is not, there are glucose lowering
medications available for progressing type II diabetics (Nelms, Sucher, Lacey, Roth, 2011).
There are seven classes of medications used; alpha-glucosidase inhibitors (AGIs), amylin
analogs, biguanides, incretin mimetics, meglitinides, sulfonylurea agents, and thizolidinediones.
AGIs delay glucose absorption in the intestine; amylin analogs delay gastric emptying, decrease
post-meal glucagon release, and decrease appetite; biguanides decrease glucose production in the
liver and increase insulin uptake in the muscles; incretin mimetics mimic glucose-dependent
insulin production, decrease elevated glucagon secretion, and delay gastric emptying;
meglitinides stimulate insulin secretion when glucose is present; sulfonylurea agents increase the
secretion of insulin; and thiazolidinediones decrease insulin resistance (Nelms, Sucher, Lacey,
Roth, 2011). For some type II diabetics, insulin therapy is also necessary and they may need
about two to four injections per day in order to assist glucose transport into cells (ADA, 2015).
The Effect of Psychological Stress and Stress Hormones on Diabetes
Role of environmental stress, acute stress and life events on type I diabetes
13. 11
Three separate studies tested the hypothesis that psychological stress, acute stress and
stressful life events may have an impact on glucose concentration and glucose control in type I
diabetics and possibly the onset of type I diabetes. A study conducted by Gonder-Frederick,
Carter, Cox & Clarke (1990) looked at the difference between blood glucose responses in type I
diabetics when exposed to an active stressor versus a passive stressor. Fourteen adults were
chosen for this study, four male and ten female. All the subjects were diagnosed with type I
diabetes between one and 39 years ago, were not on any chronic medications other than insulin,
were not pregnant and did not have any cardiovascular or neurological problems. The subjects
were told that they would be engaging in the different activities (watching a movie and doing
math) but were not told the hypothesis of the study. The active stressor that was chosen was
mental arithmetic and the passive stressor was viewing a gory film (Gonder-Frederick, Carter,
Cox & Clarke, 1990).
During both the stressors, insulin and blood glucose were assessed through an
insulin/glucose infusion system. Subjects were given insulin after lunch to ensure that they were
all euglycemic. The stressor period was 20 minutes long and the recovery period was 40 minutes
long in order to stabilize hormone and glucose levels. After the 40 minute stress subjects were
given insulin to make them eugylcemic again before the second stressor. After each stressor the
subjects were also given a mood checklist that asked them what levels (high or low) of
frustration, happiness, anxiousness, angriness, gladness and frightfulness they were feeling. They
conducted this same experiment twice; the second time being 12 weeks after the first (Gonder-
Frederick, Carter, Cox & Clarke, 1990).
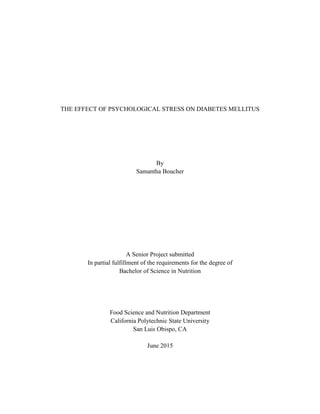
The researchers analyzed the moods that each of the stressors were effecting within the
subjects. The math stressor showed that frustration and anxiety were the main mood changes
14. 12
expressed by the subjects. The researchers did not mention what effects the horror film had on
the subject’s emotions. As seen in Figure 1. the researchers discovered that only the math
stressor had an increasing effect on blood glucose (Day 1: x2
=8.75, p=0.012 & Day 2: x2
=3.818,
p=.148). Day one has an acceptable p value, but day two’s p-value was high and would not be
counted as statistically significant. The researchers felt that this was because the subjects had
adapted to the stressors and were able to better handle them during the second experiment
(Gonder-Frederick, Carter, Cox & Clarke, 1990).
The strengths of the study conducted by Gonder-Frederick, Carter, Cox & Clarke (1990)
include the use of the insulin/glucose infusion system because its measurements are very
accurate; the similarity all of the subjects which reduces the likelihood of confounding factors;
and the experiment type because human experimental studies are more likely to show cause and
FIGURE 1: Mean blood glucose changes in mg/dL for
each condition for Days 1 and 2. The numbers in
parentheses are standard deviations. Adapted from
Gonder-Frederick, Carter, Cox & Clarke (1990).
15. 13
effect relationships between the two variables being studied. Lastly, the main weakness of their
study was a small sample size (n=14).
A study conducted by Robinson & Fuller (1985), looked at the effect of stressful life
events on the onset of type I diabetes rather than the stress’s effect on blood glucose done by
Gonder-Frederick, Carter, Cox & Clarke (1990). They recruited their subjects from two diabetic
clinics. The subjects included diabetics, the siblings of diabetics, and controls from the same
geographic location. The reason they did this was to be able to have type I diabetics, sibling
controls and what they called “neighborhood” controls. They had a total of 39 subjects ranging
from the ages of 17 to 34, both male and female. In order to assess life events, they used the
Brown and Harris Life Events and Difficulties Schedules (LEDS), which has high validity and
reliability. This method rates the severity of life events, whether they were short term or long
term, etc. Information of the life events were obtained from the three year period prior to
FIGURE 2. Proportion of diabetics, siblings, and neighborhood controls
experiencing severe life events prior to diagnosis. From Robinson & Fuller
(1985).
16. 14
diagnosis, and the same period of time was assessed for the sibling controls and the
neighborhood controls (Robinson & Fuller, 1985).
The authors (Robinson & Fuller, 1985) of the study concluded that there was a
statistically significant difference (p=0.045 for sibling controls and p=0.004 for neighborhood
controls) in the number of diabetics experiencing one or more severe life events in the three year
period prior to diagnosis versus both the sibling and neighborhood controls, as depicted in Figure
2. (Robinson & Fuller, 1985).
Robinson & Fuller (1985) is a retrospective case-control that has its strengths and
weakness. Its strengths include larger sample size (n=39), when compared to the first study
(n=14); a validated measurement tool to assess life events; and since the control groups were
from the same families and neighborhood, there is high internal validity. The biggest weakness
present within the study is actually the study type. Since it is a retrospective case-control study,
the results may be skewed because subjects tend to over analyze the time before their diagnosis.
The diabetics may come up with or recall more events that could have possibly contributed to
their diagnosis when compared to the controls. Another weakness within this study is that since
its internal validity is so high, its external validity decreases. Since it comes from one single
neighborhood, there could potentially be an underlying factor that is not thought of or explored.
In a study conducted by Wiesli, Schmid, Kerwer, Nigg-Koch, Klaghofer, Seifert, Spinas
& Schwegler (2005) the question of whether or not acute psychological stress has an effect on
glucose concentrations of type I diabetics was assessed as well. Forty type I diabetic subjects
were recruited for two different parts of the study, the first group of 20 was exposed to acute
stress while in a fasting state and the second group of 20 was exposed to the stressor post-
prandial. All forty subjects also had a control day before the experiment day where all the same
17. 15
measurements were taken but there were no stressors. Acute stress was applied by the Trier
Social Stress Test (TSST) during which the subject has a three minute preparation period to give
a five minute free-speech task and complete a five minute mental arithmetic test. All of the tasks
are performed in front of an audience, of which two people are dressed in white coats. In order to
increase stress further, everything was video-taped and the audience had been trained to remain
emotionally neutral. Interstitial glucose concentrations were measured in five minute intervals by
the Medtronic MiniMed CGMS. Cortisol levels in the saliva were measured at different time
intervals during both the control day and TSST day. Lastly noninvasive measures of blood
pressure and heart rate were also taken (Wiesli, Schmid, Kerwer, Nigg-Koch, Klaghofer, Seifert,
Spinas & Schwegler 2005).
The results for the fasting group showed a statistically significant difference in blood
pressure and heart rate between the control day and the TSST day (P < 0.001). Salivary cortisol
levels were also statistically significant (P < 0.007) when comparing the control day to the TSST
day. The authors mentioned that nine samples were not measurable, but the remaining 11 showed
a higher salivary cortisol concentration on the TSST day. Glucose concentrations for the fasting
group were the only measurements that showed results that were not statistically significant
(Wiesli, Schmid, Kerwer, Nigg-Koch, Klaghofer, Seifert, Spinas & Schwegler 2005).
The results for the post-prandial group were very similar, but the results for glucose
concentrations differed. Blood pressure increased, from the start time of the TSST to 10 min into
the TSST, from 126/76 ± 16/10 mmHg to 154/93 ± 16/13 mmHg with a p-value of less than
0.001. For salivary cortisol concentrations, the researchers noted that there were five saliva
samples that could not be measured. For the 15 samples they could use, they found on the day of
the TSST there was a significant difference in concentration when comparing the levels at start
18. 16
time to the levels at 30 minutes into the TSST. Cortisol concentrations went from 5.5 ± 1.7
nmol/l to 13.6 ± 10.6 nmol/l. They also noted a significant difference in salivary cortisol
concentrations when comparing the control day to the TSST day but no different between the
fasting group and the post-prandial group. For glucose concentrations they only found that on the
TSST day there was a delay in the decrease of glucose concentrations caused by the TSST when
comparing it to the control day (P < 0.001) but they did not find a statistically significant
difference when comparing the fasting group to the post-prandial group (Wiesli, Schmid,
Kerwer, Nigg-Koch, Klaghofer, Seifert, Spinas & Schwegler 2005).
The authors concluded that overall there is not a large difference in glucose
concentrations when comparing the control day to the TSST day, but they did note that the most
important finding of their study was the delay of decreasing glucose concentrations caused by the
acute stress on the post-prandial day as shown in Figure 3. The authors believe that the delay is
caused
by the increased cortisol levels that increase insulin resistance and increase the amount of insulin
needed (Wiesli, Schmid, Kerwer, Nigg-Koch, Klaghofer, Seifert, Spinas & Schwegler 2005).
FIGURE 3: A: Glucose concentrations in the fasting state. B: Glucose concentrations in the
postprandial period. In both A and B onset of stress is indicated by an arrow. The red arrow
indicates the general area where there was a delayed decrease in glucose concentrations.
Adapted from Wiesli, Schmid, Kerwer, Nigg-Koch, Klaghofer, Seifert, Spinas & Schwegler
(2005).
19. 17
The authors pointed out their biggest limitation was that their glucose concentrations
were interstitial measurements, not blood measurements. They used a CGMS which allows
glucose concentrations to be measured without blood samples and does it in intervals of five
minutes. They mentioned the biggest problem with the CGMS is that the results are more of an
estimate and rely on the measurement taken at the last five minute interval. But they also
mentioned that because they used the same CGMS method for both the control day and the TSST
day, that the measurements were comparable. Smaller limitations to the study are that they only
measured cortisol levels when there are many other stress hormones that could have an effect on
glucose concentrations, and the fact that the research stressor only caused acute stress
representing smaller stressful events rather than repetitive events that could represent chronic
stress (Wiesli, Schmid, Kerwer, Nigg-Koch, Klaghofer, Seifert, Spinas & Schwegler 2005).
Although the authors point out their biggest weaknesses, the study has their strengths as well,
which include the reliability of their measurements of blood pressure, heart rate, interstitial
glucose and cortisol and their study design. The human experimental study design allows for the
researches to potentially find a cause and effect relationship between stress and glucose
concentrations (Wiesli, Schmid, Kerwer, Nigg-Koch, Klaghofer, Seifert, Spinas & Schwegler
2005).
Overall, all three of these studies came to conclusion that psychological stress, acute
stress, and life difficulties do have an effect on blood glucose levels and potentially an effect on
the onset of type I diabetes. If stress causes an increase in glucose concentrations, chronic stress
from difficulties or life events will cause chronic hyperglycemia and lower resistance to
infection, and increase insulin resistance and requirements which could lead to the onset of type I
diabetes in genetically susceptible individuals (Robinson & Fuller, 1985; Gonder-Frederick,
20. 18
Carter, Cox & Clarke, 1990; Wiesli, Schmid, Kerwer, Nigg-Koch, Klaghofer, Seifert, Spinas &
Schwegler, 2005).
Role of environmental stress and life events on type II diabetes
A study done by Faulenbach, Uthoff, Schwegler, Spinas, Schmid & Wiesli (2011)
addresses the same issue as the study done by Gonder-Frederick, Carter, Cox & Clarke (1990)
except for type II diabetes rather than type I. Faulenbach, Uthoff, Schwegler, Spinas, Schmid &
Wiesli (2011) want to find out if stress has an effect on blood glucose levels in type II diabetics.
For this study, they recruited 30 subjects, 12 female and 18 male from the outpatient center.
They included subjects that were on any oral glucose lowering treatment and excluded subjects
that were on other forms of insulin therapies, were pregnant, or had unstable coronary artery
disease, unstable retinopathy or uncontrolled hypertension. They split up the 30 subjects into two
groups, 10 subjects would complete the tasks in a fasting state and the other 20 would complete
them post-prandial (Faulenbach, Uthoff, Schwegler, Spinas, Schmid & Wiesli, 2011).
The study was conducted on two consecutive days. The first day was the control day and
the second day was the stress-test day during which the subjects would be exposed to a stressful
task. During the control day, subjects were kept in a quiet room and were allowed to read or
listen to music while having their blood glucose levels monitored. The stress-test day used the
Trier Social Stress Test (TSST) during which the subject has a three minute preparation period to
give a five minute free-speech task and complete a five minute mental arithmetic test. All of the
tasks are performed in front of an audience, of which two people are dressed in white coats. In
order to increase stress further, everything was video-taped and the audience had been trained to
remain emotionally neutral. In order to monitor the subjects, they used a glucose monitoring
system that tested the glucose every five minutes, a mobile and non-invasive blood pressure
21. 19
monitoring device to check their blood pressure during the stress events and they also measured
cortisol levels in the saliva (Faulenbach, Uthoff, Schwegler, Spinas, Schmid & Wiesli, 2011).
They found that in the fasting group, there was no significant change in their blood
glucose levels when comparing the stress day and the control day. The post prandial results
showed that there was a statistically significant increase in blood glucose when comparing the
stress day to the control day. The average difference between the two days in the post-prandial
group was 1.5mmol/l with a 95% confidence interval of 0.5-2.4mmol/l and a p-value of 0.004
which makes the results statistically significant; see Figure 4. (Faulenbach, Uthoff, Schwegler,
Spinas, Schmid & Wiesli, 2011). This study only tested the effect of acute stress on blood
glucose levels. If acute stress can cause an increase in blood glucose levels, chronic stress could
potentially lead to hyperglycemia and increase the rate of progression of type II diabetes along
with its complications and comorbidities.
Faulenbach, Uthoff, Schwegler, Spinas, Schmid & Wiesli (2011) point out the
weaknesses they found in their study. They mentioned that because the catecholamine hormones
FIGURE 4. Glucose concentrations measured by continuous glucose monitoring on the
control day without stress (ᴏ) and on the stress testing day (■). *Indicates a significant
difference in glucose concentration with P < 0.05 at each time point. Adapted from
Faulenbach, Uthoff, Schwegler, Spinas, Schmid & Wiesli (2011).
22. 20
(epinephrine and norepinephrine) were not measured, definitive conclusions could not be drawn.
And the other weakness they outlined was that they could not completely rule out other
confounding factors that may have contributed to the stress response. Lastly, repetition of this
experiment would have led to better results. Although this study has its flaws, it also has its
strengths. The results are very strong and may indicate a cause and effect relationship between
blood glucose and stress.
Another study is a cross-sectional study by Mooy, De Vries, Grootenhuis, Bouter &
Heine (2000) looked at if major stressful life events are associated with development of type II
diabetes. They randomly selected 2,262 subjects. In order to assess chronic stress, they used a
questionnaire that asked about stressful life events from the past five years. The stress
questionnaire listed 10 non-work events and four work-related events. The questionnaire was
reviewed during an interview with each of the subjects during which the researchers also asked
about family history, exercise, alcohol use, and education level. Also during the interview they
diagnosed previously undiagnosed diabetics using the World Health Organization
recommendations (Mooy, De Vries, Grootenhuis, Bouter & Heine 2000).
They divided the groups up into five groups, based on the amount of life events they
reported; zero, one, two, three, and four or more. They compared the highest quartile (four or
more) with the lowest quartile (zero) and found that those in the highest quartile have a 60 %
higher chance of having diabetes. Their odds ratio was 1.6 with a confidence interval of 1.0 to
2.6 and a p-value of <0.05 which they considered to be statistically significant (Mooy, De Vries,
Grootenhuis, Bouter & Heine 2000). The one problem with their confidence interval is that it
contains the null, 1.0, which would normally cause researchers to accept that there is no
difference; or except the null hypothesis.
23. 21
The biggest weakness with this study was its design. It is very hard to tell within cross
sectional studies which came first, the diabetes or the stressful life events. Also within their
results, they only adjusted their statistical analyses for family history of diabetes, physical
activity, level of alcohol consumption and education level. Their biggest strengths were that all
of their subjects were randomly selected and they had a large sample size (n=2,262).
These studies found that an increase in serum stress hormones can lead to elevated blood
glucose levels or hyperglycemia in type II diabetics and that chronic hyperglycemia caused by
life events or difficulties increase one’s likelihood of developing type II diabetes.
Stress management in type I diabetes mellitus
A study conducted by Stenstrom, Goth, Carlsson & Andersson (2003) wanted to assess if
there were any positive effects of stress management training on glycemic control in type I
diabetics. They also wanted to test if stress management had an effect on the moods of their
subjects because they mentioned that negative moods can disrupt one’s blood glucose and
diabetes management regimen.
Thirty-six type I diabetics were recruited from a diabetes clinic. Before the study began
there was an eight week long run in period, which left the researchers with 31 subjects that
actually completed the program. Within the 31 subjects, there were 12 men and 19 women
whose mean age was 40.8 years and the mean duration of diabetes was 16.7 years. The
researchers wanted to conduct a replicated, interrupted-time-series experiment design which is a
design used to compare the effectiveness of an intervention by allowing measurements to be
taken pre- and post-intervention. They then divided the 31 subjects into two groups, group I
would be participating in the stress management program during the spring and group II acted as
24. 22
a control and would participate in the program six months later in autumn (Stenstrom, Goth,
Carlsson & Andersson 2003).
Before and after the intervention period, hemoglobin A1c was measured and subjects
filled out the MACL or mood adjective checklist. The MACL is a reliable measure of both short
and long term changes in mood. The MACL has 71 questions made up of six domains; hedonic
tone, extraversion/introversion, positive/negative social interaction, activation/deactivation,
relaxation/tension and control/lack of control (Stenstrom, Goth, Carlsson & Andersson 2003).
The intervention/stress management program was 14 weeks long. The participants
attended a two hour long group sessions during which subjects received education regarding
stress and stress management. They were taught muscle-relaxing techniques, mental-imaging
techniques, and mental goal setting techniques. Participants were encouraged to practice these
techniques outside of the group sessions on a daily basis. In order to aid the subjects with the
techniques at home, they gifted them various books and materials (Stenstrom, Goth, Carlsson &
Andersson 2003).
The researchers found that after the intervention period for both groups, there was no
difference in hemoglobin A1c levels when comparing the before, one month after and one year
after intervention measurements. The only significant results they found from the intervention
were changes in moods from the six domains. They found improvements in the hedonic tone,
social orientation, and control and relaxation. These results are shown in Table 1. The results
indicate that even though there were no changes in A1c levels, there were still positive mood
changes. After the intervention the participants were more satisfied, happy, optimistic, and self-
confident. There was also an improvement in social orientation and a larger improvement in the
relaxation domain. The researchers gave reasons as to why there may not have been a change in
25. 23
glycemic control, the main one being because the subjects already had fairly acceptable glycemic
control, so there was not a lot of room for improvement (Stenstrom, Goth, Carlsson & Andersson
2003).
Stress management in type II diabetes mellitus
In a study conducted by Surwitt, Van Tilburg, Zucker, McCaskill, Parekh, Feinglos,
Edwards, Williams & Lane (2002), the authors mentioned that there have already been studies
that have shown how stress management can be very effective in glycemic control in type II
diabetics when they are in an inpatient center. Stress management includes progressive muscle
relaxation (PMR), mental imagery, diaphragmatic breathing, and instructions on how to modify
the physiologic, cognitive, and behavioral responses to stress (Surwitt, Van Tilburg, Zucker,
McCaskill, Parekh, Feinglos, Edwards, Williams & Lane, 2002). The only limitation of the
previous studies is that the results were only applicable to inpatients, since all the research was
conducted while patients were hospitalized. The authors mentioned that since the effectiveness
of stress management in inpatient centers has been discovered there have been many attempts to
apply those results and conduct studies in an outpatient setting. The results of these studies have
TABLE 1
MACL Scores and HbA1c values (means and S.D.) for the free measurement occasions (n=31). 1
1
Tests were conducted for statistical significance (P < 0.05) comparing results before and 1 month after
intervention* as well as before and one year after intervention**. N.S = not significant. Adapted from
Stenstrom, Goth, Carlsson & Andersson (2003).
26. 24
been mixed. Two case studies suggest there are positive effects on blood glucose concentrations
for those completing stress management courses (McGrady & Gerstenmaier, 1990; Rosenbaum,
1983) but there has also been others studies that have failed to demonstrate that same
relationship (Jablon, Naliboff, Gilmore & Rosenthal, 1997; Aikens, Kiobalsa, & Sobel, 1997).
Surwitt, Van Tilburg, Zucker, McCaskill, Parekh, Feinglos, Edwards, Williams & Lane (2002)
believe that the mixed results could possibly be from the difference in the stress management
courses or interventions; whether it was group or individual, or medication based, etc. Another
possible explanation is that since some patients are highly anxious and some have low anxiety
levels, the courses may affect them differently. What Surwitt, Van Tilburg, Zucker, McCaskill,
Parekh, Feinglos, Edwards, Williams & Lane (2002) are trying to do in their current study is
examine effectiveness and practicality of cost-effective group-stress management training in
outpatients. They also want to determine if stress management is more effective in high-anxiety
patients rather than low-anxiety patients or vice versa.
Surwitt, Van Tilburg, Zucker, McCaskill, Parekh, Feinglos, Edwards, Williams & Lane
(2002) recruited their type II diabetic subjects from Duke University Outpatient Clinics, general
medical facilities, and diabetes support and education groups through the use of advertisements.
They recruited both diabetic men and women above the age of 30 to participate that currently
manage their diabetes through exercise, diet, and/or medication. The exclusion criteria were
extensive. They excluded subjects if they have already taken a stress management or relaxation
course or have any previous training, if they are currently undergoing any psychiatric treatment
or on any psychoactive drugs, if they use insulin, if they are pregnant or lactating, or they have
any other chronic illnesses. They had a total of 113 volunteers that first completed the initial
assessment but five were excluded because of their baseline glucose tolerance. They ended up
27. 25
with 108 subjects and out of 108 a total of 72 completed the study. Of the 72 there were 38 in the
treatment group and 34 in the control group. (Surwitt, Van Tilburg, Zucker, McCaskill, Parekh,
Feinglos, Edwards, Williams & Lane, 2002)
The main measurement for the study was hemoglobin A1c. It is used as an indicator of
glycemic control over the last three months. They also used self-reporting measurement tools in
order to assess perceived stress, anxiety, and psychological health. They took these measures in
order to assess the effectiveness of the stress management training. The Spielberger State-Trait
Anxiety Inventory (STAI) was the tool used to measure the current level of one’s tension and
apprehension as well as their anxiety level. A higher STAI score indicates higher anxiety. The
Perceived Stress Scale (PSS) was another tool used to assess perceived stress in one’s daily life.
The PSS correlates with life-stress events and social anxiety. The General Health Questionnaire
(GHQ) is a self-reported psychiatric screening tool that addresses aspects of adjustments and
feelings of distress. In addition to the STAI, PSS and GHQ, the researchers also measured body
mass index (BMI) and dietary intake. They measured dietary intake by having a registered
dietitian use a 24 hour recall method and analyzing the data in a nutrient analysis program. And
lastly they measured activity level and ability to perform activities of daily living through the
Duke Activity Status Index (DASI), which is a self-reporting questionnaire that gives estimated
on change in exercise ability and physical limitations (Surwitt, Van Tilburg, Zucker, McCaskill,
Parekh, Feinglos, Edwards, Williams & Lane, 2002)
The study lasted for 12 months and all the subjects reported to the Duke University
Medical Center. They took baseline measurements of all the subjects then randomized them into
either the control group or treatment group. For the first two months of the study, the subjects
were required to attended weekly small-group education sessions. The control group’s session
28. 26
was just focused on general diabetes education and the intervention group had both diabetes
education and stress management combined. Subjects were terminated if they missed more than
one (treatment) or two (control) sessions. After baseline measurements, subjects were required to
come into the center at two, four, six and 12 months to get measurements taken again (Surwitt,
Van Tilburg, Zucker, McCaskill, Parekh, Feinglos, Edwards, Williams & Lane, 2002).
The diabetes education consisted of five 30 minute sessions focusing on general diabetes
facts like signs and symptoms, treatments, physiology, etc. The stress management program had
three parts. They used progressive muscle relaxation (PMR), instruction on how to increase their
awareness of stress and behavioral skills to decrease that stress, and lastly health education on
the health consequence of stress. When the researches sent the subjects home, they encouraged
them to continue all the skills learned in the group sessions. And during follow up, the researches
asked how many times a day the subjects actually practiced the stress management methods
(Surwitt, Van Tilburg, Zucker, McCaskill, Parekh, Feinglos, Edwards, Williams & Lane, 2002).
FIGURE 5. Treatment-related changes in HbA1c with statistical adjustment for
baseline levels. The linear component of change is shown by the straight line. From
Surwitt, Van Tilburg, Zucker, McCaskill, Parekh, Feinglos, Edwards, Williams &
Lane (2002).
29. 27
In their primary analysis of the baseline measurements they found that their main variable
of interest (HgbA1c) was different when comparing the control group to the treatment group. In
order to account for the difference they had to make a covariance adjustment. During months
four and six there were contrasting results meaning that the control groups HgbA1c levels were
lower than those of the intervention groups. But after the 12 month mark it becomes very
apparent that the intervention group’s HgbA1c levels were significantly lower than those of the
control group. These changes can be seen in Figure 5. Even though the changes are modest and
improved over longer periods of time, the hypothesis of stress management contributing to
effective glycemic control is still supported (Surwitt, Van Tilburg, Zucker, McCaskill, Parekh,
Feinglos, Edwards, Williams & Lane, 2002).
In order to test their second hypothesis of whether or not subjects with high anxiety levels
benefit more from a stress management program, they compared the answers from the PSS,
STAI, and QHQ at baseline and at two, four, six, and 12 months. They did not find any of their
results from that analysis to be statistically significant (Surwitt, Van Tilburg, Zucker, McCaskill,
Parekh, Feinglos, Edwards, Williams & Lane, 2002). Lastly in order to evaluate whether diet or
physical activity had an impact on their results, they compared the 24 hour recall and the DASI
questionnaire at the different check in periods for the subjects and found that they did not have
any change in diet or physical activity during the intervention period that could have had an
impact on glycemic control (Surwitt, Van Tilburg, Zucker, McCaskill, Parekh, Feinglos,
Edwards, Williams & Lane, 2002). Overall the researchers came to the conclusion that even
though the HgbA1c levels changed modestly, the effect of stress management courses are long
term and effective (Surwitt, Van Tilburg, Zucker, McCaskill, Parekh, Feinglos, Edwards,
Williams & Lane, 2002).
30. 28
Summary and Future Research Needs
The first set of studies analyzed the effect of stress on type I diabetics. Two testing the
effects of acute stress on blood glucose concentrations and one studying the effect of life events
on the onset of type I diabetes. Wiesli, Schmid, Kerwer, Nigg-Koch, Klaghofer, Seifert, Spinas
& Schwegler (2005) found that only in the post-prandial state stress had a negative effect on
blood glucose. They did not particularly find that stress increased blood sugar levels, but they
found that after a meal (not in a fasting state) when exposed to acute stress, blood glucose levels
take a longer time to return to normal concentrations than they do when the same subjects are not
exposed to the stressor. This potentially could have harmful effects because diabetic patients
want to avoid hyperglycemia, and if their blood sugar is taking longer to return to a normal range
it means that they may be in a hyperglycemic state for longer periods of time which can over
time increase the rate of complications. (Wiesli, Schmid, Kerwer, Nigg-Koch, Klaghofer, Seifert,
Spinas & Schwegler 2005).
In another study testing stress on blood glucose in type I diabetes by Gonder-Frederick,
Carter, Cox & Clarke (1990), they found that their stressors caused an increase in glucose levels
on the first day of their experiment, but not on the second day they conducted the same
experiment which was 12 weeks later (Gonder-Frederick, Carter, Cox & Clarke, 1990). Another
study testing the effects of stress on type I diabetes, was a case-control retrospective study that
showed that there is a larger percentage of diabetics versus non-diabetic controls that have
experienced two or more severe life events within the three years prior of their diagnosis. It is
difficult to make a conclusion on the effect of psychological stress on type I diabetes because
none of the studies are completely conclusive or similar to each other.
31. 29
In the another group of studies, the effect of stress on blood glucose in type II diabetics
was studies along with the possibility that stressful life events can lead to type II diabetes. The
study conducted by Faulenbach, Uthoff, Schwegler, Spinas, Schmid & Wiesli (2011) looked at
the effect of acute stressors on blood glucose and found that in a post-prandial state stress
increased blood glucose levels (Faulenbach, Uthoff, Schwegler, Spinas, Schmid & Wiesli
(2011). In a study done by Mooy, De Vries, Grootenhuis, Bouter & Heine (2000) the effect of
stressful life events on diabetes was tested by doing a cross-sectional study and observing what
the likelihood of developing type II diabetes was when a person was exposed to life difficulties.
They found that one is 60% more likely to develop type II diabetes when exposed to stressful life
events (Mooy, De Vries, Grootenhuis, Bouter & Heine, 2000). Once again, it is difficult to draw
up a definite conclusion on the effect of stress on type II diabetes.
The last two areas of studies were testing the effect of stress management training on
glycemic control in both type I and type II diabetes. The two studies were very similar in design
except for the fact that one was studying type I diabetes, and the other type II diabetes. The study
testing type I diabetes done by Stenstrom, Goth, Carlsson & Andersson (2003) found that stress
management did not have an effect on lowering HbgA1c levels. The only results they found were
that stress management had a positive effect on the subject’s moods (Stenstrom, Goth, Carlsson
& Andersson 2003). In the study done by Surwitt, Van Tilburg, Zucker, McCaskill, Parekh,
Feinglos, Edwards, Williams & Lane (2002) on stress management and type II diabetes; they
found that stress management training has a positive effect on blood glucose levels. They
concluded that over time, stress management improves overall HbgA1c levels when compared to
the control group (Surwitt, Van Tilburg, Zucker, McCaskill, Parekh, Feinglos, Edwards,
Williams & Lane 2002). Just like all the other studies it is hard to draw up a definitive
32. 30
conclusion about stress management because these two studies were all from the 1960-1990 and
later studies could not be found and stress management techniques have improved since then,
and new studies may draw different conclusions. As of now, stress management has a positive
effect on blood glucose in type II diabetics and a positive effect on mood in type I diabetics.
Overall, there is a clear need for more research to able to make conclusions for both type
I and type II diabetes. There are very few studies that look at the effect of chronic stress on
diabetes, and of the few that did, none clinical trial studies which have the most accuracy. Cross-
sectional studies and case-control studies are the best attempt thus far to study chronic stress and
diabetes but those both have their limitations when looking for a cause and effect relationship.
Drawing an overall conclusion from all the research that is currently available, the author would
conclude stress does have a negative effect on one’s health and those effects may be amplified
when their health is already compromised, like of those who have diabetes mellitus. It is also
safe to conclude that stress has a hyperglycemic effect due to the hormones released and how
they affect glucose metabolism. Whether that is directly linked to diabetes is still an area that
needs more research. Lastly, incorporating stress management into any prevention and treatment
of any disease would be beneficial. Stress has been proven to be a contributing factor in the
development of other diseases and it may be to diabetes as well, all though more concrete
research is needed. In general, stress management is an important life skill and will contribute to
the overall well-being of any individual with or without disease.
33. REFERENCES
Aikens, J.E., Kiolbasa, T.A., & Sobel, R. (1997). Psychological predictors of glycemic change
with relaxation training in non-insulin-dependent diabetes mellitus. Psychother
Psychosom, 66, 302-306.
American Diabetes Association. (2014 a). Diagnosing diabetes and learning about prediabetes.
Retrieved May 10th
, 2015, from http://www.diabetes.org/diabetes-basics/diagnosis/.
American Diabetes Association. (2015). Insulin Routines. Retrieved June 2nd
, 2015, from
http://www.diabetes.org/living-with-diabetes/treatment-and-
care/medication/insulin/insulin-routines.html
American Diabetes Association. (2014 b). Statistics about diabetes. Retrieved May 10th
, 2015,
from http://www.diabetes.org/diabetes-basics/statistics/?loc=db-slabnav.
American Psychological Association. (2013). How stress affects your health. Retrieved May
10th
, 2015, from http://www.apa.org/helpcenter/stress.aspx.
American Psychological Association. (n.d. a). Stress effects on the body. Retrieved May 10th
,
2015, from http://www.apa.org/helpcenter/stress-body.aspx.
American Psychological Association. (n.d b). Stress: The different kinds of stress. Retrieved May
10th
, 2015 from http://www.apa.org/helpcenter/stress-kinds.aspx.
Charmandari, E., Tsigos, C. & Chrousos, G. (2006). Endocrinology of the stress response.
Annual Review of Physiology, 67, 259-284.
Faulenbach, M., Uthoff, H., Schwegler, K., Spinas, G. A., Schmid, C. & Wiesli, P. Effect of
psychological stress on glucose control in patients with type 2 diabetes. Diabetic
Medicine, 28, 128-131.
Gonder-Frederick, L. A., Carter, W. R., Cox, D. J., Clarke, W. L. (1990). Environmental stress
and blood glucose change in insulin-dependent diabetes mellitus. Health Psychology, 9,
503-515.
34. Jablon, S.L., Naliboff, B.D., Gilmore, S.L., & Rosenthal, M.J. (1997). Effects of relaxation
training on glucose tolerance and diabetic control in type II diabetes. Applied
Psychophysiology and Biofeedback, 22, 155-169.
Kyrou, I. & Tsigos, C. (2009). Stress hormones: Physiological stress and regulation of
metabolism. Current Opinion in Pharmacology, 9, 787-793.
Marieb, E. N. & Hoehn, K. (2013). Human anatomy and physiology. Harlow, Essex: Pearson.
McGrady, A. & Gerstenmaier, L. (1990). Effect of biofeedback assisted relaxation training on
blood glucose levels in a type I insulin dependent diabetic: a case report. Journal of
Behavior Therapy and Experimental Psychiatry, 21, 69-75.
Mooy, J. M., De Vries, H., Grootenhuis, P. A., Bouter, L. M., & Heine, R. J. (2000) Major
stressful life events in relation to prevalence of undetected type II diabetes. Diabetes
Care, 23, 197-201.
Nelms, M., Sucher, K. P., Lacey, K., Roth, S. L. (2009). Nutrition therapy and pathophysiology.
Belmont, CA: Wadsworth, Cengage Learning.
Robinson, N. & Fuller, J. H. (1985). Role of life events and difficulties in the onset on diabetes
mellitus. Journal of Psychosomatic Research, 29, 583-591.
Rosenbaum, L. (1983). Biofeedback-assisted stress management for insulin-treated diabetes
mellitus. Biofeedback and Self-Regulation, 8, 519-532.
Stenstrom, U., Goth, A., Carlsson, C., & Andersson, P. (2003). Stress management training as
related to glycemic control and mood in adults with type I diabetes mellitus. Diabetes
Research and Clinical Practice, 60, 147-152.
Surwit, R. S. & Schneider, M. S. (1993). Role of stress in the etiology and treatment of diabetes
mellitus. Psychosomatic Medicine: Journal of Behavioral Medicine, 55, 380-393.
Surwit, R.S., Van Tilburg, M. A. L., Zucker, N., McCaskill, C. C., Parekh, P., Feinglos, M. N.,
Edwards, C. L., Williams, P., & Lane, J. D. (2002). Stress management improves long-
term glycemic control in type 2 diabetes. Diabetes Care, 23, 30-34.
35. Vicennati, V., Pasqui, F., Cavazza, C., Pagotto, U., & Pasquali, R. (2009). Stress-related
development of obesity and cortisol in women. Integrative Physiology, 17, 1678-1683.
Wiesli, P., Schmid, C., Kerwer, O., Nigg-Koch, C., Klaghofer, R., Seifert, B., Spinas, G. A., &
Schwegler, K. (2005). Acute psychological stress affects glucose concentrations in
patients with type 1 diabetes following food intake but not in the fasting state. Diabetes
Care, 28, 1910-1914.