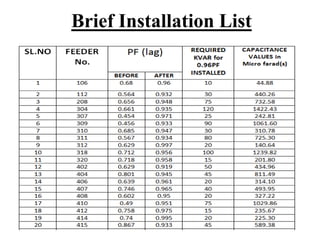
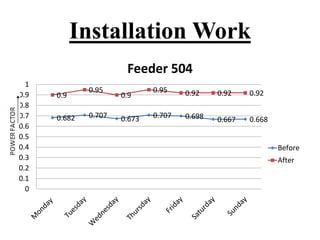
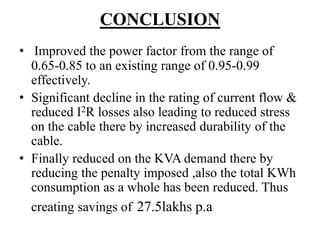
ANALYSIS AND IMPROVEMENT
OF POWER FACTOR AT
BOSCH SHOP FLOOR BY
INSTALLING CAPACITOR BANK
BY External Guide
Lingaraju.Ky(Sptd.Eng)
P.Sreelekha Internal Guide
Akash Roy A.M.Leela(Asct.Professor)
Sunith Kumar.A
SCOPE
Introduction to Problem Definition.
Possible Solutions & Remedy Chosen.
 Present Situation & Conclusion.
Terminologies
Power Triangle
Terminologies
Power Factor:
Cosine of the angle between the
voltage & the current.
Types of Power Factor:
• Unity
• Lagging
• Leading
Causes for Low Power Factor
Most A.C motors are of induction type
having low lagging power factor.
Magnetizing current drawn by transformers
lead to lagging current at low loads(specially
during morning & evening).
Typical characteristics of Arc lamp in Cinema
Induction furnace ,Short transmission lines.
Current limiting reactors used to minimize
fault currents work at low power factor.
Disadvantages of Low Power Factor
Large KVA rating of equipment .
Greater conductor size .
Large copper losses .
Poor voltage regulation .
Reduced handling capacity of system.
Unnecessary penalty is imposed (during
billing).
Different PF Correction Methods Available
Reduce the amount of reactive energy.
Compensate artificially for the consumption
of reactive energy.
 ROTARY EQUIPMENT
 STATIC CAPACITORS
Remedy Chosen
STATIC CAPACITORS
Specification of the Capacitors
Capacitors
Advantages Of Capacitors Over
Other Method(s)
Capacitor banks ensures very low initial cost.
The running costs are minimal and they
can be used with the same high efficiency
on all sizes of installation.
Compact, reliable, highly efficient &
convenient to install .
Present Situation At BOSCH
Procedure Followed
• Calculations
Procedure Followed
Procedure Followed
Procurement List
Procurement List
Brief Installation List
,
Brief Installation List
,
Savings in Power
• Resistance of the cable 0.15ohm / km load ; Length= 175mt.
• Resistance of the cable = 0.15 *0.175km = 0.026 ohm.
• P= √3 *VL*IL* Cos Φ1
• Current drawn by the load at 0.763 P.F , IL1= P/ (√3 *VL*Cos Φ1 )
=171.83/( √3 *430.52*0.763)
=302.009A.
• PF after correction Cos Φ2 = 0.96
• Current drawn by the load at 0.96 P.F , IL2 = P/ ( √3 *VL*Cos Φ2 )
= 171.83/( √3*430.52*0.96)
= 240.03A.
Savings in Power
• Power loss P1= 3*I1
2R = 7.114KW
• Power loss P2= 3*I2
2R = 4.493KW
• Saving in power = 7.114KW – 4.493KW = 2.621KW.
• Time= 18Hours * 25 Days = 450.
• KWh loss in P1 = 3201.3KWh.
• KWh loss in P2 = 2021.85KWh.
• Reduction in KWh (units) = 1179.45
• Cost saving = 1179.45 *12 months * Rs. 6/-unit =
RS.84920.4
Installation Work
Single Line Diagram
Installation Work
0.57 0.54 0.54
0.6 0.55
0.67
0.575
0.94 0.93 0.93 0.96
0.9
0.98 0.93
0
0.2
0.4
0.6
0.8
1
1.2
Feeder 307
Before
After
Installation Work
0.682 0.707 0.673 0.707 0.698 0.667 0.668
0.9
0.95
0.9
0.95 0.92 0.92 0.92
0
0.1
0.2
0.3
0.4
0.5
0.6
0.7
0.8
0.9
1
Feeder 504
Before
After
,
0
0.1
0.2
0.3
0.4
0.5
0.6
0.7
0.8
0.9
1
106 307 312 402 501 415 504 505 511
0.65
0.57
0.809
0.73
0.82 0.86
0.7
0.78 0.736
0.32
0.37
0.12
0.22
0.1 0.05
0.23 0.1 0.174
Previous Improvement
ALGORITHM
• Identify the feeder to be worked based on the
difference of power factor
• p= Power in KW
• a= Power factor(current)
• b= Target power factor
• Find out the Reactive power Compensation
required for achieving target power factor
• Compare the current and targeted P.F
• Improvement done is displayed
Simulation using MATLAB
FLOW CHART
FLOW CHART
CONCLUSION
• Improved the power factor from the range of
0.65-0.85 to an existing range of 0.95-0.99
effectively.
• Significant decline in the rating of current flow &
reduced I2R losses also leading to reduced stress
on the cable there by increased durability of the
cable.
• Finally reduced on the KVA demand there by
reducing the penalty imposed ,also the total KWh
consumption as a whole has been reduced. Thus
creating savings of 27.5lakhs p.a
THANK YOU

Bosch Project

  • 1.
    ANALYSIS AND IMPROVEMENT OFPOWER FACTOR AT BOSCH SHOP FLOOR BY INSTALLING CAPACITOR BANK BY External Guide Lingaraju.Ky(Sptd.Eng) P.Sreelekha Internal Guide Akash Roy A.M.Leela(Asct.Professor) Sunith Kumar.A
  • 2.
    SCOPE Introduction to ProblemDefinition. Possible Solutions & Remedy Chosen.  Present Situation & Conclusion.
  • 3.
  • 4.
    Terminologies Power Factor: Cosine ofthe angle between the voltage & the current. Types of Power Factor: • Unity • Lagging • Leading
  • 5.
    Causes for LowPower Factor Most A.C motors are of induction type having low lagging power factor. Magnetizing current drawn by transformers lead to lagging current at low loads(specially during morning & evening). Typical characteristics of Arc lamp in Cinema Induction furnace ,Short transmission lines. Current limiting reactors used to minimize fault currents work at low power factor.
  • 6.
    Disadvantages of LowPower Factor Large KVA rating of equipment . Greater conductor size . Large copper losses . Poor voltage regulation . Reduced handling capacity of system. Unnecessary penalty is imposed (during billing).
  • 7.
    Different PF CorrectionMethods Available Reduce the amount of reactive energy. Compensate artificially for the consumption of reactive energy.  ROTARY EQUIPMENT  STATIC CAPACITORS
  • 8.
  • 9.
  • 10.
  • 11.
  • 12.
    Advantages Of CapacitorsOver Other Method(s) Capacitor banks ensures very low initial cost. The running costs are minimal and they can be used with the same high efficiency on all sizes of installation. Compact, reliable, highly efficient & convenient to install .
  • 13.
  • 14.
  • 15.
  • 16.
  • 17.
  • 18.
  • 19.
  • 20.
  • 21.
  • 22.
    Savings in Power •Resistance of the cable 0.15ohm / km load ; Length= 175mt. • Resistance of the cable = 0.15 *0.175km = 0.026 ohm. • P= √3 *VL*IL* Cos Φ1 • Current drawn by the load at 0.763 P.F , IL1= P/ (√3 *VL*Cos Φ1 ) =171.83/( √3 *430.52*0.763) =302.009A. • PF after correction Cos Φ2 = 0.96 • Current drawn by the load at 0.96 P.F , IL2 = P/ ( √3 *VL*Cos Φ2 ) = 171.83/( √3*430.52*0.96) = 240.03A.
  • 23.
    Savings in Power •Power loss P1= 3*I1 2R = 7.114KW • Power loss P2= 3*I2 2R = 4.493KW • Saving in power = 7.114KW – 4.493KW = 2.621KW. • Time= 18Hours * 25 Days = 450. • KWh loss in P1 = 3201.3KWh. • KWh loss in P2 = 2021.85KWh. • Reduction in KWh (units) = 1179.45 • Cost saving = 1179.45 *12 months * Rs. 6/-unit = RS.84920.4
  • 24.
  • 25.
  • 26.
    Installation Work 0.57 0.540.54 0.6 0.55 0.67 0.575 0.94 0.93 0.93 0.96 0.9 0.98 0.93 0 0.2 0.4 0.6 0.8 1 1.2 Feeder 307 Before After
  • 27.
    Installation Work 0.682 0.7070.673 0.707 0.698 0.667 0.668 0.9 0.95 0.9 0.95 0.92 0.92 0.92 0 0.1 0.2 0.3 0.4 0.5 0.6 0.7 0.8 0.9 1 Feeder 504 Before After
  • 28.
    , 0 0.1 0.2 0.3 0.4 0.5 0.6 0.7 0.8 0.9 1 106 307 312402 501 415 504 505 511 0.65 0.57 0.809 0.73 0.82 0.86 0.7 0.78 0.736 0.32 0.37 0.12 0.22 0.1 0.05 0.23 0.1 0.174 Previous Improvement
  • 29.
    ALGORITHM • Identify thefeeder to be worked based on the difference of power factor • p= Power in KW • a= Power factor(current) • b= Target power factor • Find out the Reactive power Compensation required for achieving target power factor • Compare the current and targeted P.F • Improvement done is displayed Simulation using MATLAB
  • 30.
  • 31.
  • 32.
    CONCLUSION • Improved thepower factor from the range of 0.65-0.85 to an existing range of 0.95-0.99 effectively. • Significant decline in the rating of current flow & reduced I2R losses also leading to reduced stress on the cable there by increased durability of the cable. • Finally reduced on the KVA demand there by reducing the penalty imposed ,also the total KWh consumption as a whole has been reduced. Thus creating savings of 27.5lakhs p.a
  • 33.