
Recommended
More Related Content
What's hot
What's hot (17)
Viewers also liked
Viewers also liked (12)
Similar to Boréalis analytics
Similar to Boréalis analytics (20)
Recently uploaded
Recently uploaded (20)
Boréalis analytics
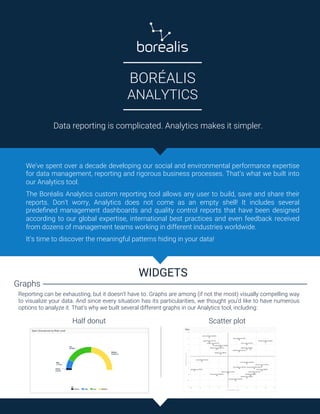
- 1. BORÉALIS ANALYTICS We’ve spent over a decade developing our social and environmental performance expertise for data management, reporting and rigorous business processes. That’s what we built into our Analytics tool. The Boréalis Analytics custom reporting tool allows any user to build, save and share their reports. Don’t worry, Analytics does not come as an empty shell! It includes several predefined management dashboards and quality control reports that have been designed according to our global expertise, international best practices and even feedback received from dozens of management teams working in different industries worldwide. It’s time to discover the meaningful patterns hiding in your data! Data reporting is complicated. Analytics makes it simpler. WIDGETS Graphs Reporting can be exhausting, but it doesn’t have to. Graphs are among (if not the most) visually compelling way to visualize your data. And since every situation has its particularities, we thought you’d like to have numerous options to analyze it. That’s why we built several different graphs in our Analytics tool, including: Half donut Scatter plot
- 2. BORÉALIS ANALYTICS Horizontal bars Spline Pie Pyramid Area Bars Mapping and GIS Build your custom maps: display filtered data and categorize it according to any field. Calendar Use filters to build and integrate calendars in your dashboards. For example, keep track of upcoming communications, know when your stakeholders have birthdays, and plan team meetings. Table Build custom lists of records with the desired columns and sort records (ascending/ descending). Indicators Define your custom KPIs, such as grievance average resolution time.
- 3. BORÉALIS ANALYTICS Built-in / Customizable Dashboards With Analytics, possibilities have no limits. But when you’re out there in the field, time is among your most precious resources. We prepared several built-in dashboards to get you started as quickly as possible. They are living reports of your data that offer an overview of the situation in a single click. Want to customize a dashboard or build your own? No problem. Mix and match the graphs, maps and calendars you need, apply desired filters, and voilà! The best part is you can customize everything, from widget size, to their position in the dashboard. Stakeholder Mapping We know how important it is for you to understand your key stakeholders. That’s why we put a lot of effort into developing the stakeholder mapping feature. Here are some examples of what the calculation and filtering options let you do: • Visualize the evolution of a stakeholder through time • View the results of all your stakeholder maps in a single chart • Filter data to only view stakeholders you recently engaged with DATA ANALYSIS Drill Down Widgets Access detailed information directly from your graphs, calendars and maps: simply click to navigate the data. Limitless Filtering of Data We want to offer as many possibilities as possible when it comes to the data analysis potential of our application, which is why Analytics uses dynamic filters: any field of any record can be used to filter data.
- 4. BORÉALIS ANALYTICS Export as PDF, Excel and images Do you need to send a report to your manager or investors on a regular basis? Well, things just got a lot simpler for you! You can export every widget and dashboard to various formats, including: PDF, Excel, JPEG, SVG and PNG. Sharing information has never been this easy. Monthly social performance reports by email How well is your team doing? What are there hot topics you should be focusing on for the upcoming weeks? Are there any unsolved grievances your team needs to address to make sure operations keep running smoothly? These are all questions you’ll be able to answer with your monthly social performance report. It’s simple, all you have to do is carry out operations and use the system as you normally would, and it will send you a monthly email with stats of the last 3 months. In addition to giving you the opportunity to take the pulse of operations, it’ll provide you with insights on what your efforts should be focused on. Ready to simplify operations? We’re here to help. www.boreal-is.com +1 819 575-6037