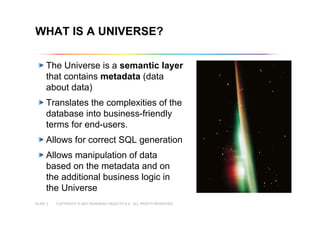
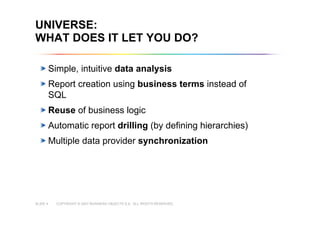
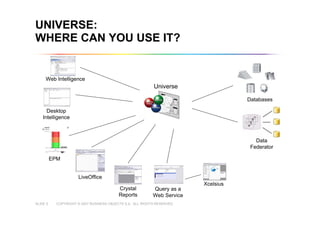
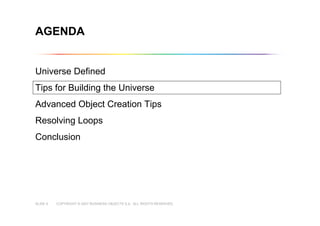
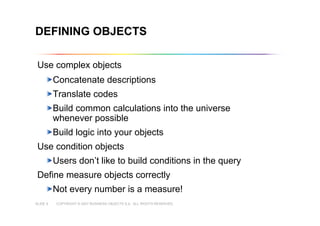
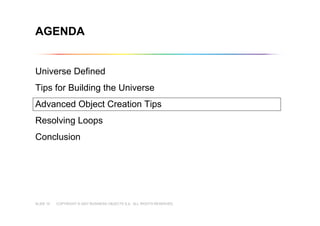
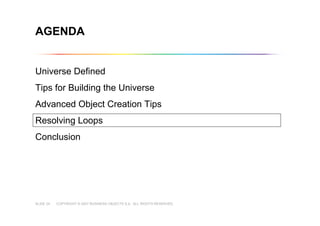
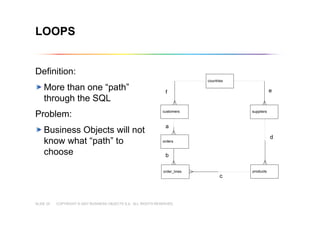
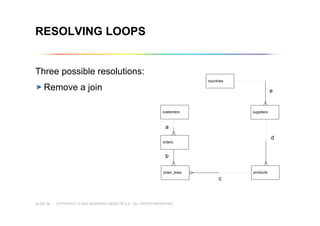
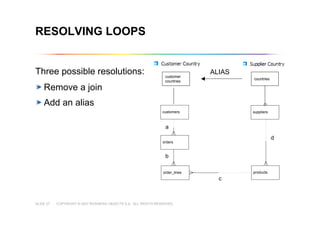
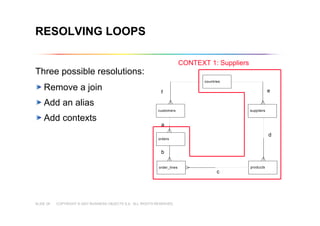
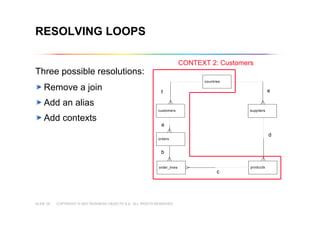
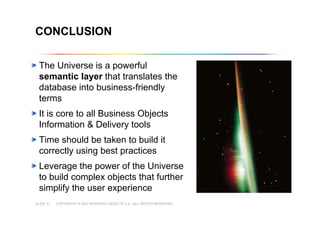
This document outlines best practices for building universes in Business Objects. It defines what a universe is, as a semantic layer that translates database structures into business terms. The agenda covers defining objects, advanced object creation tips like using case statements and custom lists of values, resolving loops in joins, and concludes by emphasizing taking time to build the universe correctly to simplify the user experience.
SAP Business Objects Universe Designer & Introduction to Business Intelligenc...BigClasses Com
Universe is a middle layer between the database and reports that includes only required table structures to avoid burdening the database. It can generate multiple reports from a single universe. Changes to the database will impact the universe and reports, while changes to the universe only impact reports, not the database. The new release of SAP Business Objects BI 4.0 introduces native connectivity to SAP BW and SAP HANA via BICS connections for Web Intelligence reporting.
Sap business objects BI4.0 reporting presentationshaktell2
The document discusses SAP Business Objects reporting tools. It provides an overview of ERP Technicals Inc. and their expertise in SAP Business Objects components like data warehousing, rapid marts, data cleansing, product migration, reporting, dashboards, proofs of concept, and training. The agenda outlines topics on SAP Business Objects architecture, universes, Web Intelligence, Crystal Xcelsius dashboards, and a demonstration.
Power BI Dashboard | Microsoft Power BI Tutorial | Data Visualization | EdurekaEdureka!
This Edureka Power BI Dashboard Tutorial will take you through step by step creation of Power BI dashboard. It helps you learn different functionalities present in Power BI tool with a demo on superstore dataset. You will learn how to create a Power BI dashboard by taking out multiple insights from superstore dataset and representing them visually.
SQL Data Services is a cloud-based database service based on SQL Server technology that provides a highly available and scalable infrastructure for storing and querying data. It eliminates the need to manage database servers and storage. The data model uses a flexible schema-less approach based on entities, properties, and containers. SQL Data Services supports common scenarios like reporting, ETL, data mining, and data sync between applications and mobile users.
This document provides an overview of accessing relational data using Microsoft Visual Studio .NET and ADO.NET. It discusses what .NET and ADO.NET are, the history and evolution of ADO.NET, the core ADO.NET object model including DataSets, DataAdapters, and list-bound controls. It also provides an example of using ADO.NET with SQL Server to populate and display data in a datagrid.
The document provides information about the SnowPro Advanced: Architect certification exam. It outlines the requirements to become a candidate, including having 2+ years of experience as a Snowflake architect. The exam contains 65 multiple choice and true/false questions across four domains: 1) Accounts and Security, 2) Snowflake Architecture, 3) Data Engineering, and 4) Performance Optimization. It is recommended that candidates complete hands-on training and have extensive experience as a Snowflake architect before taking the exam.
Here are the steps to configure the target in Scribe Workbench:
1. Click Configure Target. The Configure Target dialog box appears.
2. Click the Connections drop-down and select Scribe Sample. This is the target database.
3. Expand Tables and select Accounts. This will be the target table.
4. Click OK. The target fields from the Accounts table will display in the target pane.
5. The target fields may be in a different order than the source fields. You can rearrange the order of the target fields by dragging and dropping them.
6. Notice that the Ref column shows the reference number for each target field, similar to the source fields. These reference numbers
This document provides an overview of Power BI and discusses various features and considerations for building effective data models and reports. It begins with an introduction to Power BI Desktop and its capabilities compared to other Power BI options. The document then covers topics like building a data warehouse, learning SQL and DAX, creating measures and relationships, and best practices for mapping and self-service BI. It concludes with instructions for a Power BI demo. In 3 sentences or less: This document provides guidance on getting started with Power BI, discusses key skills needed like data warehousing and DAX, and includes a demo for exploring Power BI functionality through a sample model and report.
Benefits of SQL Server 2017 and 2019 | IDERAIDERA Software
The document discusses several new features introduced in SQL Server 2017 and 2019, including batch mode execution using only one parallelism zone for less processing in 2019; table-valued function interleaved execution running multi-statement functions first in 2017; and adaptive joins expanding to rowstore indexes in 2019. It also mentions adaptive memory grants, scalar function inlining, and automatic tuning as additional new features.
This document discusses how Oracle Discoverer reports were deployed in the Banner Student System (BSS) at Higher Colleges of Technology (HCT) in the United Arab Emirates. It provides an overview of HCT and the history of management reporting there. It then covers the basic concepts of Oracle Discoverer, how to create an End User Layer and build reports using Discoverer. Sample reports deployed in BSS via Discoverer are also discussed.
Microsoft SQL Server Integration Services (SSIS) is a platform for extraction, transformation and loading (ETL) processes. SQL Server Data Tools (SSDT) is the central development tool for SSIS packages, which are collections of tasks that execute data flows in an orderly fashion. SSIS packages include sources, destinations, and transformations within data flows to move and transform data, as well as dimension loading wizards to simplify loading dimension tables.
This document provides an overview of Al Ottley's skills and experience with Microsoft Business Intelligence technologies. It includes examples of Transact SQL queries, dimensional data modeling, SQL Server Integration Services packages, SQL Server Analysis Services cubes and MDX queries, key performance indicators, Excel pivot tables connected to OLAP data, SQL Server Reporting Services reports, PerformancePoint scorecards, and use of SharePoint to deliver BI artifacts. The document demonstrates Ottley's extensive experience with BI development and implementation across the Microsoft stack.
This document provides an overview of Microsoft SQL Server Analysis Services (SSAS) tabular models. It discusses the different modes in SSAS including multidimensional and tabular. The key differences between multidimensional and tabular models are described. Tabular models are better suited for tools like Power View, Power BI, and SQL Server Reporting Services. The document demonstrates how to build a sample tabular model in SQL Server Management Studio and Analysis Services including adding data, measures, columns, and other model elements. New features of tabular models in SQL Server 2017 like the user interface and DAX functions are also summarized.
Chris O'Brien - Intro to Power BI for Office 365 devs (March 2017)Chris O'Brien
A high-level view of Power BI as it relates to Office 365, SharePoint and developers. Potentially useful to help consider Power BI against custom development options.
TekSlate is the leader in Tableau tutorials and other business intelligence tutorials emphasis on delivering complete knowledge through self-paced learning. Tableau Free Tutorials tech to create highly interactive dashboards using actions.
To Learn More Click On Below Link:
http://bit.ly/1zKKnPm
Melbourne: Certus Data 2.0 Vault Meetup with Snowflake - Data Vault In The Cl...Certus Solutions
Snowflake is a cloud data warehouse that provides elasticity, scalability, and simplicity. It allows organizations to consolidate their diverse data sources in one place and instantly scale up or down their compute capacity as needed. Aptus Health, a digital marketing company, used Snowflake to break down data silos, integrate disparate data sources, enable broad data sharing, and provide a scalable and cost-effective solution to meet their analytics needs. Snowflake addressed both business needs for timely access to centralized data and IT needs for flexibility, extensibility, and reducing ETL work.
This document provides an introduction to Power Query, including its purpose and advantages. Power Query is an Excel add-in that allows users to extract data from various sources, transform it, and load it into a worksheet. It provides tools for cleaning, transforming, and reshaping data in one place. Using Power Query can save hours of manual work when copying, pasting, and redoing transformations. It also allows data to be refreshed with one click to update it quickly. The document reviews how to install Power Query, get to know the editor interface, load data, and provides some useful links for learning more.
This document provides an overview of faceted search and the Endeca guided navigation solution. It defines key concepts like facets, dimensions, properties and discusses Endeca components like the Information Transformation Layer, MDEX Engine and Application Tier. It also distinguishes between navigation and keyword search queries and explains dimension hierarchies.
Keentechnologies-is the best online training institute for ORACLE DATA INTEGRATOR in India.Trainings will be provided by experts. Job oriented real time trainings will be provided
This document provides an overview of Power BI, including:
- Power BI is a business analytics tool from Microsoft that allows users to visualize, analyze, and share insights from data.
- It offers desktop, service, and mobile platforms. The desktop application allows local data preparation, while the service enables cloud-based sharing of reports and dashboards.
- The document walks through an example of connecting to sample GDP data, cleaning and preparing the data with Power Query, building visualizations with charts and maps, and publishing a report to the Power BI cloud service.
The document discusses the benefits of conventions in Rails and the need for conventions in building APIs and client-side frameworks. It argues that conventions save developers from having to make trivial decisions and push problems into shared solutions. While Rails has benefited from conventions like REST, there is still room to improve APIs and make them as transparent as ActiveRecord. ActiveModel::Serializers is presented as one approach to provide conventions for serialization. The document also discusses how conventions could improve browser frameworks and application structure beyond just code organization.
This document summarizes a presentation on building VSTO applications using LINQ. The presentation covers the fundamentals of VSTO development, how and why to use LINQ, and includes demos. Reasons for using VSTO over VBA are discussed, as well as how to add LINQ to a VSTO application.
The document discusses how Flex applications can consume web services. It begins with an introduction to web services and the differences between SOAP/WSDL and REST approaches. It then demonstrates how to access and build applications using both SOAP and REST services from Flex at runtime and development time, including code generation. The document emphasizes that web services allow Flex to retrieve data for rich clients and provides examples consuming a SOAP video search service and REST del.icio.us API.
The document outlines new features for Oracle Analytics Cloud (OAC) version 4. Key highlights include a refreshed user interface, improved data visualization controls, new data flow steps for merging data, binning, and forecasting, expanded machine learning capabilities for attribute analysis and applying pre-trained models, and enhanced administration tools for content embedding, data replication, and map configuration.
MaxTECH Technical Training - Maximo Custom Audit SolutionHelen Fisher
Missed MaxTECH at Houston? The objective of this course is to show you how to build a Custom Audit Solution in your Maximo system which will provide pinpoint accuracy for the auditing of key system data.
The document discusses the ADO.NET Entity Framework, which is an extension to the ADO.NET provider model that offers object-relational mapping and LINQ capabilities. It abstracts a conceptual model from the underlying data store schema. The Entity Framework supports pluggable providers for different databases. It allows mapping between the conceptual and storage models and exposes ADO.NET and ORM APIs.
The document provides an overview of SQL Server 2008 business intelligence capabilities including SQL Server Analysis Services (SSAS) for online analytical processing (OLAP) cubes and data mining models. Key capabilities covered include new aggregation designer, simplified cube/dimension wizards in SSAS, improved time series and cross-validation algorithms in data mining, and the ability to use Excel as both an OLAP cube and data mining client and model creator.
This portfolio contains examples of SQL Server development skills learned through a hands-on SQL Master's program. It includes projects on querying databases, database design, security, and high availability solutions. Sample work includes projects on book sales, a library database, banking transactions, loading data from CSV files, and restricting database access through stored procedures. The portfolio owner has 12 years of development experience and is seeking a database developer/administrator position.
Learning Objectives:
- Learn AWS architectural best practices
- Measure your architecture against pillars of security, reliability, cost, performance, and operations
- Build a plan to remediate and improve your architecture
CMP319_Easily Coordinate Microservices, Build Serverless Apps, and Automate T...Amazon Web Services
Do you have daily, weekly, or monthly tasks that you would like to automate? Looking to link two or more AWS Lambda functions in long-running processes? Are you building applications using microservices or containers? AWS Step Functions makes it easy to coordinate the components of distributed applications using visual workflows. In this session, we will share how AWS customers like Yelp are using Step Functions to reliably build and scale multi-step applications such as order processing, report generation, and data transformation. You will learn how to reduce the time to deploy and change microservices and serverless applications, and automate IT infrastructure for improved resilience and security.
This document discusses decoupling a Drupal website to build a new website or mobile app using AngularJS and Ionic.
Some key points:
- Decoupling the frontend from the backend (Drupal) allows building multiple sites/apps with one backend, easier maintenance, and a more natural design process.
- AngularJS provides MVC structure to separate logic from markup. Ionic can build mobile apps using AngularJS.
- Drupal data can be exposed via a REST API and consumed in AngularJS. This allows fetching content without using a CMS for the frontend.
- Benefits include faster/more responsive sites, easier upgrades, and faster development cycles. However,
This document provides an agenda and overview for a presentation on foundations of programming and building better software. The presentation covers topics like ALT.NET principles, domain driven design, persistence, dependency injection, unit testing, object relational mappers and conclusions. It discusses domain objects, data driven vs domain centric design, and bridging the gap between objects and relational databases. Code examples are provided for domain models, data access and mapping objects to database tables.
Using object dependencies in sql server 2008 tech republicKaing Menglieng
This document discusses how SQL Server 2008 improves on tracking object dependencies by name rather than ID. It introduces two new dynamic management functions and a view for tracking dependencies. An example creates database objects with dependencies and queries the new functions and view to identify referenced and referencing objects. The conclusion states advantages of tracking dependencies by name include finding objects referencing those that don't exist.
This document provides a summary of an individual's qualifications and experiences in business intelligence. The individual has over 25 years of experience in roles involving developing BI tools, dashboards, and reports for various companies in industries such as healthcare, finance, telecom, and retail. They are skilled in tools from Microsoft, Oracle, SAP, and others. The individual's goal is to combine their interests in art, design, technology and finance to think creatively and solve problems.
2008 09-26 demonstration monthly reporting in deal databaseMalin Johansson
This document provides an agenda for a demonstration of monthly reporting in the Deal Database. It outlines that EQT needs a more efficient process for inputting and outputting financial data from portfolio companies. Currently, reporting is done across different documents and formats. The Deal Database will store all financial data, and portfolio companies will directly input reports. Deal teams will comment on key performance indicators. Standard reports will then be available from the Deal Database and Excel. The demonstration will show the workflow process in the Deal Database for monthly updates reported by deal teams. Next steps include installing an Excel add-in, testing the application with an August 2008 monthly update, and providing instructions and support contacts.