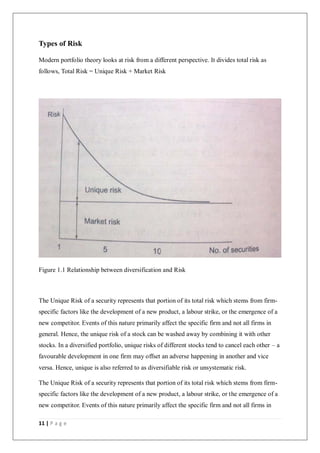
1 | P a g e
A Study of Factors Influencing Investors Decisions With Respect to
Portfolio Investment in Mumbai
A Project Submitted to
HSNC University, Mumbai For Partial Completion
Of the degree of Master in Commerce Under the
Faculty of Commerce
Deepak Niranjan Pradhan
Under the Guidance of
Prachi Ahuja
H.R Collage of Commerce and Economics
Churchgate, Mumbai-400020
OCTOBER 2023
2 | P a g e
Table of Content
Sr.
No.
Contents Page
No.
1 Declaration Certificate 4
2 Certificate 5
3 Acknowledgment 6
4 Executive Summary 7
5 Introduction 8
Objectives of the Study
Portfolio
Risk
Investment
Criteria for evaluation
Common errors in investment management
6 Literature Review 41
Murithial et al., 2012
Sultana et al., 2012
Sivaramakrishnan et al., 2017
Raut, 2020
Sachdeva et al., 2021
Cecily, 2022
Hypothesis
7 Research Methodology 47
Scope of the Study
Research Objectives
Sampling Method
Data Analysis 62
Conclusion 63
3 | P a g e
Recommendations 65
Bibliography 67
4 | P a g e
DECLARATION
I the undersigned Mr. Deepak Niranjan Pradhan from 2nd
Year Mcom My Roll No is
HSPMCBF045 here by, declare that the work embodied in this project work titled “A Study
of Factor Influencing Investors Decisions With Respect to Portfolio Investments in Mumbai
”, forms my own contribution to the research work carried out under the guidance of Prachi
Ahuja is a result of my own research work and has not been previously submitted to any
other University for any other Degree/ Diploma to this or any other University. Wherever
reference has been made to previous works of others, it has been clearly indicated as such and
included in the bibliography. The learner has complied to the provisions of the
UGC(Promotion of Academic Integrity and Prevention of Plagiarism in Higher Educational
Institution)Regulation 2018.
I, here by further declare that all information of this document has been obtained and
presented in accordance with academic rules and ethical conduct.
Deepak Niranjan Pradhan
Name and Signature of the learner
Certified by
Prachi Ahuja
Name and Signature of the Guiding Teacher
5 | P a g e
H.R Collage of Commerce and Economics
Churchgate, Mumbai-400020
Certificate
This is to certify that Mr. Deepak Niranjan Pradhan From 2nd
Year of Mcom Roll no
HSPMCBF045 has worked and duly completed his Project work for the degree of Master of
Commerce under the Faculty of Commerce in the subject of his project is entitled , “ under
my supervision. I further certify that the entire work has been done by the learner under my
guidance and that no part of it has been submitted previously for any degree or diploma of
any University. It is his own work and facts reported by his personal findings and
investigations
6 | P a g e
ACKNOWLEDGMENT
To list who all have helped me is difficult because they are so numerous and the depthisso
enormous.
I would like to acknowledge the following as being idealistic channels and fresh dimensions
in the completion of this project.
I take this opportunity to thank the HSNC University for giving me chance to do this project.
I would like to thank my Principal, for providing the necessary facilities required for
completion of this project.
I take this opportunity to thank our Coordinator , for her moral support and guidance.
I would also like to express my sincere gratitude towards my project guide whose guidance
and care made the project successful.
I would like to thank my College Library, for having provided various reference books and
magazines related to my project.
Lastly, I would like to thank each and every person who directly or indirectly helped mein the
completion of the project especially my Parents and Peers who supported me throughout my
project
7 | P a g e
SUMMERY
An investment is a sacrifice of current money or other resources for future benefits.
Numerous avenues of investment are available today. The two key aspects of any investment
are time and risk. Very broadly, the investment process consists of two tasks. The first task is
security analysis which focuses on assessing the risk and return characteristics of the
available investment alternatives. The second task is portfolio selection which involves
choosing the best possible portfolio from the set of feasible portfolios.
Construction of portfolio is only part of the battle. Once it is built, the portfolio needs to be
maintained. The market values, needs of the beneficiary, and relative merits of the portfolio
components can change over time. The portfolio manager must react to these changes.
Portfolio management usually requires periodic revision of the portfolio in accordance with a
predetermined strategy.
The type of sampling technique used is Simple Random Sampling wherein a questionnaire
was prepared and distributed to the retail investors. The investor’s profile is based on the
results of a questionnaire that the Investors completed. The Sample consists of 50 people
from various backgrounds. The target customers were only the retail investors who invest in
various avenues so as to know about their knowledge and concern regarding the economy,
principal invested, investment options, market conditions etc.
According to the opinion of these investors interpretation has been done and there has been
findings and conclusion along with some recommendations.
8 | P a g e
INTRODUCTION
Portfolio
A portfolio is an appropriate mix of or collection of investments held by an institution or a
private individual. It is a collection of securities, since it is rarely desirable to invest the entire
funds of an individual or an institution in a single security. Portfolio analysis considers the
determination of future risk and return in holding various blends of individual securities.
Portfolio Management
Portfolio management is the art and science of making decisions about investment mix and
policy, matching investments to objectives, asset allocation for individuals and institutions,
and balancing risk against performance. Portfolio management is all about determining
strengths, weaknesses, opportunities and threats in the choice of debt vs. equity, domestic vs.
international, growth vs. safety, and many other trade-offs encountered in the attempt to
maximize return at a given appetite for risk.
Portfolio management can by either passive or active, in the case of mutual and exchange-
traded funds (ETFs). Passive management simply tracks a market index, commonly referred
to as indexing or index investing. Active management involves a single manager, co-
managers or a team of managers who attempt to beat the market return by actively managing
a fund's portfolio through investment decisions based on research and decisions on individual
holdings. Closed-end funds are generally actively managed.
9 | P a g e
The Key Element of Portfolio Management
Asset Allocation:
The key to effective portfolio management is the long-term mix of assets. Asset allocation is
based on the understanding that different types of assets do not move in concert, and some
are more volatile than others. Asset allocation seeks to optimize the risk/return profile of an
investor by investing in a mix of assets that have low correlation to each other. Investors with
a more aggressive profile can weight their portfolio toward more volatile investments.
Investors with a more conservative profile can weight their portfolio toward more stable
investments.
Diversification:
The only certainty in investing is it is impossible to consistently predict the winners and
losers, so the prudent approach is to create a basket of investments that provide broad
exposure within an asset class. Diversification is the spreading of risk and reward within an
asset class. Because it is difficult to know which particular subset of an asset class or sector is
likely to outperform another, diversification seeks to capture the returns of all of the sectors
over time but with less volatility at any one time. Proper diversification takes place across
different classes of securities, sectors of the economy and geographical regions.
Objectives of the Study
The objectives of study are as follows:
1. To find out whether most of the investors prefer return as their investment criteria rather
than risk, liquidity and safety of principal etc.
2. To Find Criteria for evaluating the investment.
3. To Find Common Errors in investment management.
4. To Find Qualities for successful management
10 | P a g e
Portfolio
A portfolio is an appropriate mix of or collection of investments held by an institution or a
private individual. It is a collection of securities, since it is rarely desirable to invest the entire
funds of an individual or an institution in a single security.
Portfolio analysis considers the determination of future risk and return in holding various
blends of individual securities.
Portfolio expected return is a weighted average of the expected return of individual securities
but portfolio variance, in short contrast, can be something less than a weighted average of
security variances.
As a result an investor can sometimes reduce portfolio risk by adding security with greater
individual risk than any other security in the portfolio. This is because risk depends greatly on
the co-variance among return of individual securities.
Since portfolios expected return is a weighted average of the expected return of its securities,
the contribution of each security to the portfolio’s expected returns depends on its expected
returns and its proportionate share of the initial portfolio’s market value.
Risk
Risk is a concept that denotes a potential negative impact to an asset or some characteristic of
value that may arise from some present process or future event. In everyday usage, risk is
often used synonymously with the probability of a known loss. Risk is uncertainty of the
income/capital appreciation or loss of the both.
The total risk of an individual security comprises two components, the market related risk
called Systematic Risk also known as undiversifiable risk and the unique risk of that
particular security called Unsystematic Risk or diversifiable risk.
11 | P a g e
Types of Risk
Modern portfolio theory looks at risk from a different perspective. It divides total risk as
follows, Total Risk = Unique Risk + Market Risk
Figure 1.1 Relationship between diversification and Risk
The Unique Risk of a security represents that portion of its total risk which stems from firm-
specific factors like the development of a new product, a labour strike, or the emergence of a
new competitor. Events of this nature primarily affect the specific firm and not all firms in
general. Hence, the unique risk of a stock can be washed away by combining it with other
stocks. In a diversified portfolio, unique risks of different stocks tend to cancel each other – a
favourable development in one firm may offset an adverse happening in another and vice
versa. Hence, unique is also referred to as diversifiable risk or unsystematic risk.
The Unique Risk of a security represents that portion of its total risk which stems from firm-
specific factors like the development of a new product, a labour strike, or the emergence of a
new competitor. Events of this nature primarily affect the specific firm and not all firms in
12 | P a g e
general. Hence, the unique risk of a stock can be washed away by combining it with other
stocks. In a diversified portfolio, unique risks of different stocks tend to cancel each other – a
favourable development in one firm may offset an adverse happening in another and vice
versa. Hence, unique is also referred to as diversifiable risk or unsystematic risk
Investment
Investment may be defined as an activity that commits funds in any financial form in the
present with an expectation of receiving additional return in the future. The expectations
bring with it a probability that the quantum of return may vary from a minimum to a
maximum. This possibility of variation in the actual return is known as investment risk. Thus
every investment involves a return and risk.
Investment is an activity that is undertaken by those who have savings. Savings can be
defined as the excess of income over expenditure. An investor earns/expects to earn
additional monetary value from the mode of investment that could be in the form of financial
assets.
The three important characteristics of any financial assets are:
Return – the potential return possible from an asset
Risk – the variability in returns of the asset from the chances of its value going down/up.
Liquidity – the ease with which an asset can be converted into cash.
Investors tend to look at t these three characteristics while deciding on their individual
preference [pattern of investments. Each financial asset will have a certain level of each of
these characteristics.
13 | P a g e
Investment Alternatives
An investor has wide range of investment avenues such as:
Non – Marketable Financial Assets
A good portion of financial assets is represented by non – marketable Financial Assets. They
can be classified into various categories such as:
 Bank Deposits
 Post Office Deposits
 Company Deposits
 Provident Fund Deposit
Equity Shares
Equity shares represent ownership capital. An equity shareholder has an ownership stake in
the company i.e. he / she has a residual interest in income and wealth. Equity shares are
classified into broad categories by stock market analysts such as:
 Blue Chip Shares
 Growth Shares
 Income shares
 Cyclical Shares
 Speculative Shares
Bonds
Bonds or Debentures represent long-term debt instruments. The issuer of a bond promises to
pay a stipulated stream of cash flow. Bonds may be classified into the following categories
such as:
 Government Securities,
 Savings Bonds,
 Government Agency Securities,
 PSU
14 | P a g e
 Bonds,
 Debentures of Private Sector Companies
 Preference Shares.
Mutual Funds Schemes
Instead of directly buying equity shares and / or fixed income instruments we can participate
in various schemes of mutual funds which, in turn, invest in equity shares and fixed income
securities. There are three broad types of mutual fund schemes such as:
 Equity Schemes
 Debt Schemes
 Balanced Schemes
Life Insurance Policies
Life Insurance may also be viewed as an investment. Insurance premiums represent the
sacrifice and the assured sum, the benefit. The important types of insurance policies are:
 Endowment assurance policy
 Money back policy
 Whole life policy
 Term assurance policy
Real Estate
For the bulk of the investors the most important asset in their portfolio is a residential house.
In addition to a residential house, the more affluent investors are likely to be interested in the
following types of real estate:
 Agriculture Land
 Semi – Urban Land
 Commercial Property
 A resort home
 A second house
15 | P a g e
Criteria for Evaluation
For evaluating an investment avenue, the following criteria are relevant:
Rate of Return
The rate of return on an investment for a period (usually a period of one year) is defined as
follows:
Rate of return = Annual Income + (Ending Price – Beginning Price) / Beginning Price
Risk
The rate of return from investments like equity shares, real estate, silver, and gold can vary
rather widely. The risk of an investment refers to the variability of its rate of return like how
much do individual outcomes deviate from the expected value?
There are some measures which are used to measure risk such as:
1. Dispersion
2. Variance
3. Standard Deviation
4. Beta (This reflects how volatile is the return from an investment relative to market swings.)
Marketability
An investment is highly marketable or liquid if,
1. It can be transacted quickly
2. The transaction cost is low
3. The price change between two successive transactions is negligible. The liquidity of a
market may be judged in terms of its depth, breadth, and resilience. Depth refers to the
existence of buy as well as sell orders around the current market price. Breadth implies the
16 | P a g e
presence of such orders in substantial volume. Resilience means that new orders emerge in
response to price changes. Investors value liquidity because it allows them to change their
minds. They can correct errors they may have made quickly and cheaply. Further, they can
easily modify their investments in line with changing circumstances and objectives.
Tax Shelter
Some investments provide tax benefits and some do not. Tax benefits are of three types:
1. Initial Tax Benefit: It refers to the tax relief enjoyed at the time of investment.
2. Continuing Tax Benefit: It represents the tax shield associated with the periodic returns
from the investment.
3. Terminal Tax Benefit: It refers to relief from taxation when an investment is realized or
liquidated.
Convenience
It refers to the ease with which the investment can be made and looked after. The degree of
convenience associated with investments varies widely.
Common errors in investment management
Investors appear to be prone to the following errors in managing their investments. Some of
the common errors are:
Inadequate comprehension of return and risk
 Vaguely formulated investment policy
 NaĂŻve extrapolation of the past
 Cursory decision making
 Untimely entries and exits
 High costs
17 | P a g e
 Over – diversification and under – diversification Wrong attitude toward losses and
profits
Qualities for successful investing
The game of investment requires certain qualities and virtues on the part of the investors, to
be successful in the long run. The following qualities which are mostly found are:
 Contrary thinking
 Patience
 Composure
 Flexibility and openness
 Decisiveness
Optimal Portfolio
Once the efficient frontier is delineated, the optimal portfolio has to be determined. To
determine the optimal portfolio on the efficient frontier, the investor’s risk – return tradeoff
must be known. Figure 2 below represents two illustrative indifference curves which reflect
risk – return tradeoff functions. All points lying on an indifference curve provide the same
level of satisfaction. The indifference curves Ip and Iq represent the risk – return of two
hypothetical investors, P and Q. Both P and Q, like most investors, are risk – averse. They
want higher returns to bear more risk. Q is however more risk – averse than P. Q wants a
higher expected return for bearing a given amount of risk as compared to P. In general, the
steeper the slope of the indifference curve, the greater the degree of risk aversion.
18 | P a g e
FIGURE1.2: Risk-Return Indifference Curves
FIGURE 1.3: Utility Indifference Curves
19 | P a g e
Figure 3 shows the indifference map for P. In this figure, four risk – return indifference
curves, Ip1, Ip2, Ip3, and Ip4 are shown. All the points lying on a given indifference curve
offer the same level of satisfaction. For example, points A and B, which lie on the
indifference curve Ip1 offer the same level of satisfaction; likewise, points R and S, which lie
on the indifference curve Ip2, offer the same level of satisfaction. The level of satisfaction
increases as one moves leftward. The indifference curve Ip2, represents a higher level of
satisfaction as compared to the indifference curve Ip1; the indifference curve Ip3 represents a
higher level of satisfaction when compared to the indifference curve Ip4; and so on.
Given the efficient frontier and the risk – return indifference curves, the optimal portfolio is
found at the point of tangency between the efficient frontier and a utility indifference curve.
This point represents the highest level of utility the investor can reach. In figure 4 two
investors P and Q, confronted with the same efficient frontier, but having different utility
indifference curves (Ip1, Ip2 and Ip3 for P and Iq1, Iq2 and Iq3 for Q) are shown to achieve
their highest utilities at points P* and Q* respectively.
FIGURE 4: Optimal Portfolio
20 | P a g e
Capital Asset Pricing Model (CAPM)
The CAPM predicts the relationship between the risk of an asset and its expected return. This
relationship is important in two important ways:
 It produces a benchmark for evaluating various investments. For example, when the
investors analyse a security they are interested in knowing whether the expected
return from it is in line with its fair return as per the CAPM.
 It helps the investors make a guess about the return that can be expected from an asset
that has not yet been traded in the market.
Basic Assumptions of CAPM
The CAPM is based on the following assumptions:
 Individuals are risk averse.
 Individuals seek to maximize the expected utility of their portfolio over a single
period planning horizon.
 Individuals have homogenous expectations they have identical subjective estimates of
the means, variances, and covariance’s among returns.
 Individuals can borrow and lend freely at a riskless rate of interest.
 The market is perfect, there are no taxes, there are no transaction costs, securities are
completely divisible, and the market is competitive.
 The quantity of risky securities in the market is given.
21 | P a g e
Portfolio Construction
Understanding Portfolio Construction Methodology
The methodology used by fund managers to construct their portfolios will very much depend
on the type of fund that they are managing, as well as the style of management that they use.
Although there are many general funds, such as segregated pension funds, that invest
globally, there is a continuing trend towards specialization in particular funds, such as
segregated pension funds, that invest globally, there is a continuing trend towards
specialization in particular markets, and each market will have its own principal
considerations.
Equity management involves an element of asset allocation, either to countries managed by
the European, Far Eastern Latin America or Emerging Markets desks, or to industries within
single countries, especially within the UK. Having said this internationalization of many
companies in recent years has resulted in fund 18 managers looking at industry grouping
irrespective of the country in which the corporate is based.
Since firms derive an increasing proportion of their earnings from countries outside their
domicile, it is becoming less and less relevant analyses them on the basis of economic
prospects for that country (e.g. GDP growth etc), More relevant are the issues facing each
industry.
The number of different influences on a portfolio is quite diverse. This creates the need for a
broad range of different analyses so that the fund manager can look at his portfolio broken
down in different ways, particularly useful are analyses of portfolio giving the weights
allocated to each category, especially where these weights are compared to the constituents of
the index used as part or all of the fund’s bench mark.
Other Analyses are: Equities are sensitive to a number of different factors affecting their
market prices in the short, medium or long term. This means that the fund manager needs to
look at his portfolio, and the securities held in them, from a number of different perspectives
and involves assimilating the huge quantities of data available to fund managers, sourced
from external brokers as well as their own firm’s analysts. The key is the interpretation of the
data:
What does the news imply for a security or overall industry grouping?
22 | P a g e
Portfolio level analysis includes the following:
Fund Break down by:
Company Size: In an economic upswing smaller companies may grow faster than larger
firms, whilst in a recession investor may prefer larger, more resilient (through cash
availability or diversification) companies.
Economics theme: E.g. Sensitive to oil prices, interest rates, factors affecting other
economics in to products are sold. Overall portfolio factors such as the fund’s beta can also
provide useful risk information. As with most types of fund level analysis, the comparison of
the funds against the benchmark is the most useful. Other security level analysis includes the
price to earnings ratio growth which is a dynamic measure of a trend of changing value (if we
are a value -style manager) or changing growth (if we are growth manager).
Portfolio Objectives
Before selecting the appropriate objectives, several preconditions must be met. They are:
 An assessment of the existing situation is necessary like, current needs of the portfolio
beneficiary, drastic changes in the composition of the portfolio (especially the level of
income generated) may not be feasible.
 A second concern is the investment horizon considering if the portfolio is part of a
pension fund’s assets (the investment horizon is very long term), the ups and downs
of the market etc.
 Liquidity needs and ethical considerations established by the fund’s owner.
Some of the distinct portfolio objectives are
23 | P a g e
1. Stability of Principal
When someone says, “I don’t want any chance of losing the money I invest”, the fund
manager should interpret this person’s objective as stability of principal. This is the most
conservative portfolio objective, and over the long run, it will generate the most modest
return. The emphasis here is on preserving the “original” value of the fund. When stability of
principal is the objective, the appropriate investment vehicles include any of the money
market instruments and bank certificates of deposit.
2. Income
The income objective differs from stability of principal in that there is no specific
proscription (forbid) against periodic declines in principal value. The consequences of the
fluctuations in market may vary. When income is chosen objective, appropriate investments
include corporate bonds, government bonds, government agency securities, preferred stock,
and some common stock.
3. Growth of Income
The time value of money is one of the key concepts in finance. Rupees today are worth more
than an equal number of rupees ay any point in the future. This objective usually involves a
reduced initial income payout, but one that grows over time and eventually overtakes the
level amount from an income objective. The client and the fund manager should clearly
understand the difference between income and growth of income as objectives. An income
objective seeks to generate as much current income as possible within the risk parameters
established. Initially this amount will be higher than that generated by a portfolio seeking
growth of income. Eventually, though, income from the latter portfolio will overtake that
generated by the former.
24 | P a g e
The key point is a growth-of-income objective requires the fund manager to seek some
capital appreciation in the original principal. This means that some of the fund must be
invested in equity securities. The common stocks purchased may generate some income from
dividends, but the bulk of the income will come from fixed-income securities such as long-
term bonds.
4. Capital Appreciation
Occasionally it is not important that a portfolio generate any income at all. A retired couple,
for instance, might receive pension and Social Security Checks that are sufficient to finance
their retirement life-style. If these people have an investment portfolio, they might be more
interested in having it continue to grow in value rather than in getting additional income from
it.
There is also an income tax consideration. Interest or dividends received are immediately
taxable. Capital gains are not taxed until they are actually realized. This means that unless
income is actually needed, a rupee capital gain is really worth more than a rupee of income.
The unrealized capital gains are not taxed, whereas dividend or interest income is. Taxes can
be deferred for many years by successful long-term growth stock investing.
The Importance of Primary and Secondary Objectives
Establishing the primary objective of the portfolio is a major accomplishment for the fund
manager and the fund beneficiary. But it is also prudent and enormously helpful to establish a
secondary objective in addition to a primary objective. The secondary objective indicates
what is next in importance after specification of primary objective. The portfolio manager has
to decide what percentage of the investment funds to put into equities. Most of the remainder
will go into debt securities, real assets or hard assets.
Consider a person who wants that current income should be the primary objective of the
portfolio. This could be accomplished by investing in money market securities, in long-term
debt, or in dividend-producing common stock. The client might make statements like, “I
25 | P a g e
really don’t want to take any risk with this money” or “Is there any chance I am going to lose
any of this?”. In this case, stability of principal is probably the client’s secondary objective.
In contrast, the client might ask, “Is the income I get going to keep up with inflation?”. This
implies growth of income as a secondary objective. To accomplish this, the fund manager
must attempt to get some appreciation in the principal of the fund, and this requires a greater
investment in equities
Steps to Building a profitable portfolio:
In today's financial marketplace, a well-maintained portfolio is vital to any investor's success.
As an individual investor, we need to know how to determine an asset that best conforms to
our personal investment goals and strategies. In other words, our portfolio should meet our
future needs for capital and give us peace of mind. Investors can construct portfolios aligned
to their goals and investment strategies by following a systematic approach. Here we go over
some essential steps for taking such an approach.
Step 1: Determining the Appropriate Asset Allocation
Ascertaining our individual financial situation and investment goals is the first task in
constructing a portfolio. Important items to consider are age, how much time we have to
grow our investments, as well as amount of capital to invest and future capital needs. A single
college graduate just beginning his or her career and a 55- year-old married person expecting
to help pay for a child's college education and plans to retire soon will have very different
investment strategies.
A second factor to take into account is our personality and risk tolerance. Are we the kind of
person who is willing to risk some money for the possibility of greater returns? Everyone
would like to reap high returns year after year, but if we are unable to sleep at night when our
investments take a short-term drop, chances are the high returns from those kinds of assets
are not worth the stress.
As we can see, clarifying our current situation and our future needs for capital, as well as our
risk tolerance, will determine how our investments should be allocated among different asset
classes. The possibility of greater returns comes at the expense of greater risk of losses (a
26 | P a g e
principle known as the risk/return tradeoff) – we don't want to eliminate risk so much as
optimize it for our unique condition and style. For example, the young person who won't have
to depend on his or her investments for income can afford to take greater risks in the quest for
high returns.
On the other hand, the person nearing retirement needs to focus on protecting his or her assets
and drawing income from these assets in a tax-efficient manner.
Conservative Vs. Aggressive Investors
Generally, the more risk we can bear, the more aggressive our portfolio will be, devoting a
larger portion to equities and less to bonds and other fixed -income. Conversely, the less risk
that's appropriate, the more conservative our portfolio will be. Here are two examples: one
suitable for a conservative investor and another for the moderately aggressive investor.
The main goal of a conservative portfolio is to protect its value. The allocation shown above
would yield current income from the bonds, and would also provide some long-term capital
growth potential from the investment in high-quality equities.
A moderately aggressive portfolio satisfies an average risk tolerance, attracting those willing
to accept more risk in their portfolios in order to achieve a balance of capital growth and
income.
Step 2: Achieving the Portfolio Designed in Step 1
Once we have determined the right asset allocation, we simply need to divide our capital
between the appropriate asset classes. On a basic level, this is not difficult: equities are
equities, and bonds are bonds.
But we can further break down the different asset classes into subclasses, which also have
different risks and potential returns. For example, an investor might divide the equity portion
between different sectors and market caps, and between domestic and foreign stock. The
bond portion might be allocated between those that are short term and long term, government
versus corporate debt and so forth.
27 | P a g e
There are several ways we can go about choosing the assets and securities to fulfil our asset
allocation strategy:
 Stock Picking: Choose stocks that satisfy the level of risk we want to carry in the
equity portion of our portfolio -sector, market cap and stock type are factors to
consider. Analyse the companies using stock screeners to shortlist potential picks,
than carry out more in-depth analyses on each potential purchase to determine its
opportunities and risks going forward. This is the most work-intensive means of
adding securities to our portfolio, and requires us to regularly monitor price changes
in our holdings and stay current on company and industry news.
 Bond Picking: When choosing bonds, there are several factors to consider including
the coupon, maturity, the bond type and rating, as well as the general interest rate
environment.
 Mutual Funds: Mutual funds are available for a wide range of asset classes and
allows us to hold stocks and bonds that are professionally researched and picked by
fund managers. Of course, fund managers charge a fee for their services, which will
detract from our returns. Index funds present another choice; they tend to have lower
fees because they mirror an established index and are thus passively managed.
 Exchange-Traded Funds (ETFs): If we prefer not to invest with mutual funds, ETFs
can be a viable alternative. We can basically think of ETFs as mutual funds that trade
like stocks. ETFs are similar to mutual funds in that they represent a large basket of
stocks -usually grouped by sector, capitalization, country and the like -except that
they are not actively managed, but instead track a chosen index or other basket of
stocks. Because they are passively managed, ETFs offer cost savings over mutual
funds while providing diversification. ETFs also cover a wide range of asset classes
and can be a useful tool for rounding out our portfolio.
Step 3: Reassessing Portfolio Weightings
Once we have an established portfolio, we need to analyse and rebalance it periodically
because market movements may cause our initial weightings to change. To assess our
portfolio's actual asset allocation, quantitatively categorize the investments and determine
their values' proportion to the whole.
28 | P a g e
The other factors that are likely to change over time are our current financial situation, future
needs and risk tolerance. If these things change, we may need to adjust our portfolio
accordingly. If our risk tolerance has dropped, we may need to reduce the amount of equities
held. Or perhaps we are now ready to take on greater risk and our asset allocation requires
that a small proportion of our assets be held in riskier small – cap stocks.
Essentially, to rebalance, we need to determine which of our positions are overweighed and
underweighted. For example, say we are holding 30% of our current assets in small-cap
equities, while our asset allocation suggests we should only have 15% of our assets in that
class. Rebalancing involves determining how much of this position we need to reduce and
allocate to other classes.
Step 4: Rebalancing Strategically
Once we have determined which securities we need to reduce and by how much, decide
which underweighted securities we will buy with the proceeds from selling the overweighed
securities. To choose our securities, the approaches discussed in Step 2 are used.
When selling assets to rebalance our portfolio, a moment is taken to consider the tax
implications of readjusting our portfolio. Perhaps our investment in growth stocks has
appreciated strongly over the past year, but if we were to sell all of our equity positions to
rebalance our portfolio, we may incur significant capital gains taxes. In this case, it might be
more beneficial to simply not contribute any new funds to that asset class in the future while
continuing to contribute to other asset classes. This will reduce our growth stocks' weighting
in our portfolio over time without incurring capital gains taxes.
At the same time, the outlook of our securities has to be always considered. If we suspect that
those same overweighed growth stocks are ominously ready to fall, we may want to sell in
spite of the tax implications. Analyst opinions and research reports can be useful tools to help
gauge the outlook for your holdings. And taxloss selling is a strategy we can apply to reduce
tax implications.
29 | P a g e
Importance of Diversification.
Throughout the entire portfolio construction process, it is vital that we remember to maintain
our diversification above all else. It is not enough simply to own securities from each asset
class; we must also diversify within each class. Ensure that our holdings within a given asset
class are spread across an array of subclasses and industry sectors.
As already mentioned, investors can achieve excellent diversification by using mutual funds
and ETFs. These investment vehicles allow individual investors to obtain the economies of
scale that large fund managers enjoy, which the average person would not be able to produce
with a small amount of money.
Security Screening:
Security screening is an important part of the portfolio construction process, but one about
which relatively little is written. Picking stocks is an art rather than a science; there is no best
way to do the screening, nor is there even a right or wrong way. Everyone who participates in
the capital markets uses some type of screen –a procedure for reducing a large set of
alternatives to a more manageable number.
Sources of Information
There are several well-known and readily accessible sources of information that can be very
helpful in gathering some quick information about unfamiliar securities. These are:
 Value Line: One of the best-known subscription services is the Value Line Investment
Survey. This weekly publication from value line, Inc., follows 1700 different common
stocks and rates them in two categories:
Timeliness refers to precisely what one would expect i.e., the advisability of buying
this stock now.
30 | P a g e
Safety refers to the confidence the Value Line analysts have in their forecasts about
the firm. Value Line assigns a ranking in each of these categories according to the
schedule listed in the table below
RANKING NUMBER OF STOCKS
WITH THIS RANKING
MEANING
1 100 Best
2 300 Above average
3 900 Average
4 300 Below average
5 100 Worst
TABLE 1.1: Value Line Ranking System
 Standard & Poor’s Standard & Poor’s Corporation publishes a wide variety of
reports on the economy, industries, and individual stocks. Two of these reports are
especially useful to portfolio managers
 Stock Report: The S&P Stock Report is a one-page document that contains a
surprisingly thorough description of a company and an estimate of what the future
holds for it. These reports are updated quarterly and are housed in a loose-leaf binder
in most public libraries. The report contains financial statement information in
addition to dividend payment dates, beta, and other risk measures.
 Stock Guide: The S&P Stock Guide is published monthly and contains summary
statistics on thousands of common stocks, warrants, and mutual funds. This
publication is small enough to be carried conveniently in a briefcase or coat pocket.
Many brokers receive a dozen or so of these each month and provide them to their
customers who request them. Although they are published monthly, a Stock Guide
that is several months old is still quite useful.
 Moody’s Investment Service: Another widely used set of investment information are
the volumes published by Moody’s Investment Service. These volumes are
collectively called “Moody’s Manuals”. Some of the individual volumes are:
31 | P a g e
 Moody’s Manual of Investments: Most needs for quick information can be satisfied
by either the Stock Report or the Stock Guide, but at times we may not find what we
need in these two sources. Moody’s Manual of Investments is a good place to turn
next. This publication contains several sets of volumes: one set of industrial firms,
one on municipals and governments, one on OTC industrials, one on public utilities,
and one on transportation issues. An especially common problem arises when we seek
information about a company that, unknown to us, doesn’t have stock that trades
publicly. The firm may be a subsidiary of another company or may not be publicly
held. The blue pages of Moody’s Manuals contain a cross-reference of subsidiaries.
For instance, we will find that Pizza Hut is a subsidiary of Pepsico. Moody’s Manuals
also contain more detailed news reports about a firm, more detailed financial
statements, and other relevant information that cannot be included in the Stock Report
because of space limitations. This information source is a heavy book, is expensive to
acquire, and cannot be conveniently be taken outside.
 Moody’s Dividend Record: When it is necessary to investigate the recent dividend
history of a company (payment dates, ex-dividend dates, and so on), Moody’s
Dividend Record is one of the most convenient places to get this information quickly.
Brokerage Information
A final information source available is through our broker. All full-service brokerage firms
(and some discount firms) have in-house research capability. We can request a report on a
particular company or give our broker a list of securities of interest and ask that we receive
reports on these firms as they are produced.
The Role of Real Assets:
Introduction:
Modern investment decisions involve a lot more than traditional stocks and bond issues. A
general lack of understanding of concepts like duration and or the utility of futures market
products contributed to the demise of many savings and loans. Today’s executives in any
business must keep pace with changes in the industry if they want to survive. There are two
32 | P a g e
assets timberland and gold, which are non-traditional in the sense that most portfolio
managers have limited understanding of them. Not every portfolio can, or should, invest in
these.
Before looking at specific information about these investment alternatives, it is useful to
know the distinction between financial assets and real assets. Most portfolios are invested in
financial assets. These are familiar securities such as shares of common stock, corporate
bonds, and bank certificates of deposit. The key characteristic of a financial asset is that for
each such asset, somewhere out there a corresponding liability exists. Financial assets are on
two balance sheets: as an asset for someone and as a liability for someone else. Real assets, in
contrast, do not have a corresponding liability, although one may be created to finance the
purchase of the asset. Real estate purchases are normally leveraged.
Real Estate in General:
Investment Characteristics
Real estate is widely acclaimed as a good investment. Most real estate cites three
fundamental characteristics of land. Land is immobile, indestructible, and no fungible (means
every plot is unique). Land obviously cannot be moved. Land is widely considered a long-
term investment, although it does not have to be. Timberland buyers often hope to liquidate
the timber and sell the “carcass” over a fairly short time horizon. The majority of institutional
landowners are looking for a mix of annual cash flows and long-term capital appreciation.
Five general categories of real estate are shown in table below:
Residential Commercial Industrial Farm Special
Purpose
Owner occupied Office buildings Light
manufacturing
Timberland Cemeteries
Rental Store Properties Heavy
manufacturing
Pastureland Churches
Lofts Ranches Ranches Government
properties
Theatres Orchards Golf Courses
Garages Farmland Parks
33 | P a g e
Hotel and
motels
Public building
and streets
TABLE 1.2: Categories of real estate
GOLD
In a nutshell, perhaps the most important general investment characteristic of gold is people
buy it primarily because of the security it provides against times of trouble. Numerous factors
can make gold an attractive investment. Like timberland, gold has historically demonstrated
returns that are unrelated to the stock market as a whole. This makes gold a powerful
diversifying agent in a portfolio.
Gold is a popular trading commodity among speculators because of its price volatility. It is
popular with hedgers because of its risk-reduction characteristics. No one likes inflation.
Historically, gold has been a useful inflation hedge, and an increase in the price of oil raises
fears of inflation.
Investing in gold
An individual or an institution can invest in gold in four principal ways:
 Bullion: The rare individual may have the money and inclination to buy gold bars
(bullion) and stack them in basement. Smaller quantities may be stored in 1-ounce
bars, in nuggets, or as gold dust. These investments may be exotic, but they have
obvious shortcomings. First, there is a significant risk of theft. Second, they produce
no income until sold. Third, they lack marketability.
 Gold Certificates: Investors also can purchase documents representing ownership of
gold bullion that is kept by someone else on their behalf. A number of banks in the
United States and Canada issue these gold certificates, which are obligations of the
issuer to deliver gold upon demand. If we purchase these, we can actually take
delivery any time we wish. Certificates are registered in our name, which adds a bit of
security to the investment. Certificates may be readily sold back to the dealer from
whom we bought them, although we will lose a few percentage points in the dealer’s
34 | P a g e
bid-ask spread. The primary advantage of gold certificates over the bullion itself is
convenience. We are freed from worry about storage, delivery, and insurance. These
certificates do carry the risk that there is no gold backing them, but if we deal through
a major bank or brokerage firm, this risk is minimal.
 Shares in Mining Companies: Perhaps the most popular form of gold ownership in
the United States is through the purchase of shares in goldmining companies, either
directly or through a mutual fund. Owning shares has major advantages over other
forms of ownership as shares are instantly marketable and can generate some income
through dividends.
 Coins: Gold coins are popular with both collectors and gold speculators. It is
important to distinguish between a coin’s intrinsic value and its numismatic value. A
coin’s value intrinsic value is the higher of its bullion value or its fiat value (the value
assigned to it by the issuing government). Collectors may be willing to pay more than
the value of gold contained in a coin because the coin is rare or popular. Some people
find it difficult to be both collectors and investors in gold.
Portfolio Management
The technique of matching the assets of one’s portfolio with predetermined financial goals is
called Portfolio Management. Construction of a portfolio is only part of the battle. Once it is
built, the portfolio needs to be maintained. The market values, needs of the beneficiary, and
relative merits of the portfolio components can change over time. The portfolio manager must
react to these changes. Portfolio management usually requires periodic revision of the
portfolio in accordance with a predetermined management strategy.
Portfolio involves deciding what assets to include in the portfolio, given the goals of the
portfolio owner and changing economic conditions. Selection involves deciding what assets
to purchase, how many to purchase, when to purchase them, and what assets to divest. These
decisions always involve some sort of performance measurement, most typically expected
return on the portfolio, and the risk associated with this return (i.e. the standard deviation of
the return). Typically, the expected return from portfolios of different asset bundles are
35 | P a g e
compared. The unique goals and circumstances of the investor must also be considered. Some
investors are more risk averse than others.
Goals of portfolio management
The three goals of portfolio management are:
 Maximize the value of the portfolio
 Seek balance in the portfolio
 Keep portfolio projects strategically aligned
Types of portfolio management
An active management policy is one in which the composition of the portfolio is dynamic.
That is, the manager routinely changes the portfolio components or their proportion within
the portfolio. In contrast, a strategy of passive management is one in which the portfolio,
once established, is largely left alone. Before selecting one of these approaches, it is
important to understand the choices and their costs.
 Active portfolio management: Portfolio managers (either independent advisors or
managers tied to financial management firms) are constantly involved in the active
management of portfolios. They aim at earning more than the average market return
on the chosen investments. Market research is undertaken to formulate investment
strategies. Active portfolio management strategy involves purchasing undervalued
securities or selling securities that are overvalued. The success of an investment
portfolio depends on the skills of a portfolio manager and the accuracy of market
research.
 Passive portfolio management: This process is limited to selecting securities that
track a particular index. It includes formulating an investment plan as part of portfolio
building. Decisions regarding asset classes and the proportional allocation of funds to
them need to be finalized. This is followed by keeping records and rebalancing the
portfolio when needed.
36 | P a g e
What are the factors that influence this process?
Portfolio management would begin with the setting of investing objectives. While one
investor may aim for rapid growth, another may be seeking safe investments.
Accordingly, one can choose between debt instruments (such as bonds) and equities (stocks).
In addition, derivatives (such as options and futures contracts) are can also help diversify the
portfolio. Other factors that affect the process of portfolio management are:
 Financial circumstances of the portfolio owner
 Investment performance measurement (including expected return and risk associated
with it)
 The changing economic conditions
 A preference of the area of investment (domestic or international)
Performance Evaluation
Performance evaluation is a critical, and often poorly handled, part of the portfolio
management process. The principal problem with performance evaluation is the human
tendency to focus on the return a portfolio earned over a period of time with little regard to
the risk taken in achieving that return. Proper performance evaluation should involve
recognition of both the return and the riskiness of the investment.
Importance of measuring portfolio risk
The importance of associating a security’s return with a measure of the riskiness of that
return is a principle of finance. A precept of finance theory is the concept of utility
maximization: when given the choice, people avoid distasteful events and seek out satisfying
phenomena. They try to maximize the expected utility associated with their decisions.
Investors must choose between investment alternatives where the future performance of the
competing investment choices is uncertain.
37 | P a g e
Models
Some of the financial models used in the process of Valuation, stock selection, and
management of portfolios include:
 Maximizing return, given an acceptable level of risk.
 Modern portfolio theory - a model proposed by Harry Markowitz among others.
 The single – index model of portfolio variance.  Capital asset pricing model.
 Arbitrage pricing theory.
 The Jensen Index.
 The Treynor Index.
 The Sharpe Diagonal (or Index) model.
 Value at risk model.
Traditional Performance Measures
 Sharpe and Treynor Measures: The Sharpe measure uses the standard deviation of
periodic security returns, whereas the Treynor measure uses the security (or portfolio)
beta.
 Jensen Measure: Another traditional performance measure, the Jensen measure, is
seldom used today. It stems directly from the implications of the Capital Asset Pricing
Model:
Post-modern portfolio theory
Post-modern portfolio theory (or "PMPT") is an extension of the traditional modern portfolio
theory (“MPT”, also referred to as Mean-Variance Analysis or “MVA”). Both theories
propose how rational investors should use diversification to optimize their portfolios, and
how a risky asset should be priced.
38 | P a g e
Overview
Harry Markowitz laid the foundations of MPT, the greatest contribution of which is the
establishment of a formal risk/return framework for investment decisionmaking. By defining
investment risk in quantitative terms, Markowitz gave investors a mathematical approach to
asset-selection and portfolio management. But there are important limitations to the original
MPT formulation.
Limitations
Two major limitations of MPT are its assumptions that;
 Variance of portfolio returns is the correct measure of investment risk, and
 The investment returns of all securities and portfolios can be adequately represented
by the normal distribution.
Stated another way, MPT is limited by measures of risk and return that do not always
represent the realities of the investment markets.
Standard deviation and the normal distribution are a major practical limitation: they are
symmetrical. Using standard deviation implies that better-thanexpected returns are just as
risky as those returns that are worse than expected. Furthermore, using the normal
distribution to model the pattern of investment returns makes investment results with more
upside than downside returns appear riskier than they really are, and vice-versa for returns
with more a predominance of downside returns. The result is that using traditional MPT
techniques for measuring investment portfolio construction and evaluation frequently distorts
investment reality.
It has long been recognized that investors typically do not view as risky those returns above
the minimum they must earn in order to achieve their investment objectives. They believe
that risk has to do with the bad outcomes (i.e., returns below a required target), not the good
outcomes (i.e., returns in excess of the target) and that losses weigh more heavily than gains.
"Under certain conditions the MVA can be shown to lead to unsatisfactory predictions of
(investor) behavior. Markowitz suggests that a model based on the semi variance would be
39 | P a g e
preferable; in light of the formidable computational problems, however, he bases his (MV)
analysis on the mean and the standard deviation."
Recent advances in portfolio and financial theory, coupled with today’s increased electronic
computing power, have overcome these limitations. The resulting expanded risk/return
paradigm is known as Post-Modern Portfolio Theory, or PMPT. Thus, MPT becomes nothing
more than a (symmetrical) special case of PMPT.
PMPT PROCESS
In PMPT an analogous process is followed:
 Observe the monthly returns,
 Fit a distribution that permits asymmetry to the observations,
 Annualize the monthly returns, making sure the shape characteristics of the
distribution are retained,
 Apply integral calculus to the resultant distribution to calculate the appropriate
statistics.
Portfolio Manager
A team of analysts and researchers are ultimately responsible for establishing an investment
strategy, selecting appropriate investments and allocating each investment properly for a
fund- or asset-management vehicle.
Portfolio managers are presented with investment ideas from internal buy-side analysts and
sell-side analysts from investment banks. It is their job to sift through the relevant
information and use their judgment to buy and sell securities. Throughout each day, they read
reports, talk to company managers and monitor industry and economic trends looking for the
right company and time to invest the portfolio’s capital.
40 | P a g e
Portfolio managers make decisions about investment mix and policy, matching investments to
objectives, asset allocation for individuals and institutions, and balancing risk against
performance.
Portfolio managers make decisions about investment mix and policy, matching investments to
objectives, asset allocation for individuals and institutions, and balancing risk against
performance.
In the case of mutual and exchange-traded funds (ETFs), there are two forms of portfolio
management: passive and active. Passive management simply tracks a market index,
commonly referred to as indexing or index investing. Active
management involves a single manager, co-managers, or a team of managers who attempt to
beat the market return by actively managing a fund's portfolio through investment decisions
based on research and decisions on individual holdings. Closed – end funds are generally
actively managed
41 | P a g e
LITERATURE REVIEW
Numerous research studies have been carried out over time to examine the elements and
factors influencing investors' behaviour and decisions while making investments. The
literature in this review paper has been taken from 20 studies of investors spread across 11
years (from 2012-2022) in various parts of India.
Murithial et al., 2012 made an effort to research the market's available investment choices,
investors' investment preferences, and the factors that influence why people choose to invest
in particular financial instruments. Proportional analysis on a sample of 100 respondents, the
Chi-square test, bar chart, and correlation analysis were used. A large portfolio is not a
reliable indicator of a sound investment. They came to the conclusion that Indian investors
understand the notion of portfolio allocations as well as risk and return on investment. In
India, buying gold and real estate are the two best ways to invest. It has a good return and is
well-liked. This demonstrated that Indian investors, despite their high income and education
levels, are conservative ones.
Sultana et al., 2012 made an effort to examine and pinpoint the variables impacting Indian
individual equity investors' stock selection. For the aim of choosing the sample, various stock
brokerage firms were contacted, and a sample of 891 investors—out of a total of 1500—was
taken into consideration. Factor analysis approaches were used to research the variables
influencing individual equities investors' behaviour. They came to the conclusion that the
typical modern investor is an educated, well-groomed person. Following the application of
factor analysis, it was discovered that all 40 attributes can be boiled down to the ten factors
listed below: individual eccentricity, wealth maximisation, risk minimization, brand
perception, social responsibility, financial expectation, accounting information, government
& media, economic expectation, and advocate recommendation factors.
Sahi et al., 2013 performed an in-depth examination of investor beliefs and preferences, the
goal of their article was to discover individual investors' views and attitudes about financial
investment decision making, with a focus on investor biases. For this purpose, 30 exploratory
semi structured interviews were undertaken. According to this study, understanding an
individual investor's psychology can aid in better understanding how individual investing
42 | P a g e
decisions are made. The technique and analysis of this study added value to it. This article
added new understanding about financial product purchasing behaviour by examining the
perceptions and opinions of the financial consumer regarding their financial investment
biases.
Gender differences in employee investing behaviour were the subject of an
investigation by Bhushan et al., 2013. His research study used the survey approach to
get data from the respondents. Their findings suggest that there are considerable gender
differences in employees' investing preferences for market investments, fixed deposits, and
health insurance.
Sureshrajan et al., 2013 looked at how investors felt about various investment and saving
options. They took a sample of 300 investors and determined that even though the sample of
stratified investors, such as government employees, private employees, business people, and
housewives, had different age, different educational levels, different professions but they had
same pattern of investment. The primary contribution of the study was to demonstrate that
investors' preferences for risk reduction in their investments are based on a sample of people
who regularly make investment decisions.
Jothilingam et al., 2013 conducted a literature review on the attitudes of investors toward
various investment possibilities. Both primary and secondary data sources were used to create
this. The key Finding was that Investors favored less risky investment options including gold,
mutual funds, and bank deposits. It was proposed that female investors should be enthusiastic
about investing in alternatives to gold, such as mutual funds, securities and cash. This can be
a sign that they want to stay out of dangerous circumstances.
43 | P a g e
Sellappan et al., 2013 attempted to demonstrate the key requirement of women's
investment attitudes toward various types of securities. They analyzed that risk-takers were
more likely to be young and single. Older and married folks shied away from risk. Married
women were more eager to invest than single women. Compared to older women, younger
women were more likely to invest in fixed deposits, insurance, mutual funds, and stocks.
Charles et al., 2014 made an attempt to determine whether or not a person's emotions
influence their investment personality. A multi-stage sampling strategy was used to gather
data from 742 ordinary investors who visited the Indian stock market for that purpose.
AMOS, STATA, SPSS, and SEM models were used to quantitatively examine the data that
had been gathered. The results of their study revealed that an investor's investment
personality may be influenced by their intuitiveness based on emotions.
Umamaheswari et al., 2014 identified the elements that had an absolute influence on the
choices and priorities of investments made by the target group of investors while also paying
close attention to the investment preferences of the salaried class. The primary elements that
impact salaried investors were awareness, attitude, anticipation, and satisfaction. This
research used random sampling to plan the relationship between the top group and
demographic aspects of the salaried middle class that influence investment criteria such as
investment awareness, investment attitude, and investment returns.
Parimalakanthi et al., 2015 sought to understand how Coimbatore city residents behaved
as individual investors in relation to the various investment opportunities in the Indian
financial markets. The safety of the principal amount, liquidity, income stability, and
appreciation were the main driving forces behind an investment. The easy sampling method
was used to choose 107 clients. Utilizing the Friedman test, Garratt ranking, and factor
analysis, the acquired data was evaluated. According to the author, security was also one of
the most favoured components in fixed income and investment for safety. The key element in
long-term investment was capital approval. The most chosen alternative for investments in
liquid assets was additional income.
44 | P a g e
Singh, 2015 intended to find elements that affect investors when they invest in the stock
market, as well as some of the factors that inspire investors to buy shares. The study was
empirical in nature, and a convenience sample of 100 individual investors had been taken.
Primary and secondary data was used, and data gathered through questionnaires. They
concluded that when a person decides to invest, he or she takes into account factors including
tax planning, future demands, investment safety, recurring income, etc. The goals of
investment have a major impact on investment decisions. The author went on to say that
when investing in the market, both men and women are worried about previous dividends.
The survey also found that male investors examined financial ratios including the P/E ratio,
the D/P ratio, and other liquidity ratios, whereas female investors were less comfortable with
financial ratios due to lack of financial knowledge.
Thulasipriya, 2016 investigated the evidence that salaried investors' investing behaviour is
influenced by other investors, as well as the investment preferences of salaried investors. The
research shows that salaried investors seek both long-term and short-term investments to
protect their future financial security. The author concluded that salaried individuals prefer
investment alternatives that offer long-term benefits and extraordinarily secure cum
gratifying pathways, regardless of their age or annual salary, as well as their work and marital
situation.
Sivaramakrishnan et al., 2017 investigated the impact of elements like financial literacy
on a consumer's choice of investments, notably in the stock market. In a mixed-methods
study, qualitative research came first and was followed by a quantitative survey-based
investigation. In-depth interviews with investors and specialists were conducted. 506 retail
investors from four Indian cities responded, and their responses were analyzed. The study's
findings showed that real stock market investments were predicted by investment intentions
(which represented behaviour). Both subjective and objective financial literacy were
discovered to have a considerable impact on intentions, but only objective financial literacy
appeared to have an impact on behaviour. A second-order construct called "Attitude to
Investment Behaviour" was created by combining the three variables "perception of
regulator," "risk avoidance," and "burden factor." The intention to invest in the equity markets
45 | P a g e
was negatively impacted by this. Financial security appeared to have a positive association
with behaviour but a negative effect on intention.
Singh et al., 2018 made research on risk perception of bank employees as they possess
higher level of financial literacy as compared to other persons in the society. He found that
the general risk perception of bank personnel was moderate. Fear psychosis, lack of
information, and lack of confidence are three elements that influence total risk perception,
and these three characteristics have an impact on employees' investing decisions. The
research was the first of its sort, making it unique.
Akhtar et al., 2019 explained the investment intention of potential individual investors in a
developing nation (in this case, India). A questionnaire-based survey was conducted as part of
the study's quantitative and cross-sectional methodology to gather responses from potential
individual investors (920 usable responses). The link between the constructs was established
using AMOS and SPSS.The study's findings revealed that while financial self-efficacy played
a dual role in the interaction between personality traits and investment intention, attitude was
partially responsible for mediating the association between financial knowledge and
investment intention. On the other hand, subjective norms had a somewhat favourable
influence on investment intention
Raut, 2020 initiated to understand how prior behaviour and financial literacy affect
individual investors' investment decisions. His study looked at the applicability of the
planned behaviour theory in this situation. The study used a self-administered questionnaire,
convenience sampling, and a snowball sampling method to gather information from
individual investors in each of India's four different states. AMOS 20.0 was used to analyse
the collected data using two-step structural equation modelling (SEM). Results showed that
each predicted predictor had a substantial impact. The investor's purpose was not
significantly impacted by past behaviour directly, but it was significantly impacted indirectly
through investor attitude. Multiple squared correlation (R2) results revealed that the final
model could account for 36% of the variation in investors' intention to invest in stocks,
indicating a successful application of the TPB model with the addition of external factors. In
46 | P a g e
addition, it was discovered that Indian investors were heavily impacted by social pressure,
which may be reduced through financial literacy
Cecily, 2022 made research that the most popular option among investors is a bank deposit,
which they actually believe is the most safe and easy way of investment. This indicates that
safety is the major factor influencing the decision of investors. The city of Chennai was
chosen for this study because of its distinct and distinctive historical significance. The
investors are less aware that investing in mutual funds has a number of benefits, including
adaptability, diversification, liquidity, profitability, high-quality collateral, and tax
advantages. Alterations in demographic variables like age, income, education, and occupation
have an impact on the preferred investment avenue. According to certain studies, the attitude
toward risk is more strongly influenced by variables including marital status, the number of
dependents, wealth, and income.
Hypothesis Statement
A hypothesis is a proposed explanation for an observable phenomenon. The term derives
from the Greek word – hyposthenia meaning "to put under" or "to suppose”.
For the present study it is proposed to have following hypothesis:
Null Hypothesis:
Most of the investors prefer return as their investment criteria rather than risk, liquidity and
safety of principal etc.
47 | P a g e
RESEARCH METHODOLOGY
Data collection method
To get the information about the study, a survey has been conducted considering number of
respondents. Respondents were selected by using random sampling technique.
Selection of Sample
To get the information about the study, a survey has been conducted considering number of
respondents. Respondents were selected by using random sampling technique. Samples
would be chosen as various possible investments or funds under a portfolio. Data has been
collected through questionnaire mainly considering various age groups, their risk perception,
risk appetite, safety of principal, liquidity etc. Keeping this view in mind we followed a
simple method of selecting respondents – following the method of “Simple Random
Sampling”. The respondents were selected randomly. Due to the want of time and resources
only 50 respondents were selected for the study.
Q 1. How do you look into Indian economy?
TABLE 3.1:
Very Good 10 20
Good 37 74
Bad 3 6
Don’t Know 0 0
48 | P a g e
CHART 3.1:
Interpretation:
 74% of the respondents have said Indian economy is good. This means that after the
economic meltdown the Indian economy has been faring well.
 20% of the respondents have said Indian economy is very good. This means they feel
that irrespective of the recession effects, the economy is doing good
 6% of the respondents feel Indian economy is bad. This means they still feel the
economy has to grow for better means.
 Each and every respondent has a fair idea about Indian economy, therefore there were
no respondents as such who said that they don’t know about Indian economy.
Q2. Being an investor, you must be aware of all investment options
available today?
TABLE 3.2
49 | P a g e
YES 32 64%
NO 17 34%
DIDN’T SAY 1 2%
CHART 3.2:
Interpretation:
 64% of the respondents are aware of all the investment options available.
This means they have been tracking the market conditions and have a fair
idea of what are the options available for investing wherein they can earn
money.
 34% of the respondents are not aware of the investment optionsavailable.
This means they are least bothered to know about the optionsavailable for
investing and rather try to play safe side by not taking too much of risk.
50 | P a g e
 2% of the respondents didn’t say anything because they may not have any
idea of what are the investment avenues and may be they take help of third
party for their investments and remain ignorant.
Q3. If No, do you take help of an investment advisor?
TABLE 3:
CHART 3.3:
51 | P a g e
Interpretation:
 Out of total respondents, 34% (17) said they are not aware of all the investment
options available and out of this,
 65% of 17 respondents take the help of investment advisor because they are not aware
of the present market conditions and its volatility and don’t want to take unnecessary
risk by investing into various portfolio without understanding its consequences.
 35% of 17 respondents don’t take help of investment advisor even if they are not
aware of the investment avenues. This shows the ignorance of the investors and their
lack of interest towards being educated regarding various investment options.
Q4. Is your investment objective for?
TABLE 3.4:
52 | P a g e
Retirement
Planning
14 28%
To meet major
commitments
13 26%
Wealth Creation 19 38%
Others 4 8%
CHART 3.4:
Interpretation
 28% of the respondents have said their investment objective is for retirement
planning. This means they are investing in order to secure their future after their
retirement.
53 | P a g e
 26% of the respondents have said their investment objective is to meet major
commitments. Here major commitments mean higher education for their dependents,
marriage etc.
 38% of the respondents have said their investment objective is for wealth creation.
This means majority of the investors invest to create wealth. Their motto is to invest
into various avenues and get maximum out of it.
 8% of the respondents have said they have some other reasons for investment instead
of creating wealth, to meet major commitments and retirement planning.
Q5. Do you review your portfolio?
TABLE 3.6:
CHART 3.5:
Interpretation:
 74% of the respondents review their portfolio. This means they are concerned
about their investment and its consequences. They check frequently whether their
54 | P a g e
portfolio is giving them the returns they are expecting otherwise they tend to
review it. The frequency of review varies from investor to investor.
 26% of the respondents do not review thir portfolio. This means once they create
their portfolio they are not concerned anymore to check whether the portfolio is
giving them the best returns and rather stick to it in the hope that the same
portfolio would give them the best returns. It also shows they do not want to take
risk of diversifying their investment and may be they do not have much idea of
how market conditions are.
Q6. If yes, the reason for review and the frequency (How often you review)?
TABLE 3.7:
Weekly 6 12%
Fortnightly 1 2%
Quarterly 7 14%
Monthly 4 8%
Half-yearly 4 8%
Yearly 6 12%
Didn’t Say 22 44%
CHART 3.6:
55 | P a g e
Interpretation:
 12% of the respondents review their portfolio weekly. This shows that these investors
have concern for their investment and check every week whether their money is safe or
else they need to reconstruct their portfolio.
 14% of the respondents review their portfolio fortnightly. These investors review their
investments once in two weeks. They keep themselves in track with the market
conditions and its volatility. If their portfolio is faring well then they would continue
with it.
 8% of the respondents review their portfolio monthly. Every month these investors
check whether their investment into various securities is giving them the expected
returns or not.
 14% of the respondents review their portfolio quarterly. These investors don’t review
their portfolio frequently rather they review it in every three months. These investors
may keep themselves in track with the market conditions and how well the securities
are faring in the market.
 8% of the respondents review their portfolio for every 6 months. These investors
continue with their investments for 6 months in the hope that those would give them
the maximum returns. This is a risk which these investors are taking because it is not a
long term investment and they are least bothered about their money in the market.
 12% of the respondents review their portfolio yearly. These investors are rather very
ignorant of how the market and economy is going on and may be they take help of the
investment advisors. Due to this they least bother to check whether their money is safe
and is getting them the required returns.
 44% of the respondents don’t review their portfolio. This shows that how ignorant they
are with respect to their money invested. They also don’t keep track of the market
conditions and are not well educated about the investment avenues. Most of these
investors fully depend upon their investment advisors and are least bothered of what is
happening with their money. The only thing is they want their money invested to be
safe and in the meantime get maximum returns out of it.
56 | P a g e
Q7. What proportion of your portfolio would you feel comfortable allocating
to equities?
TABLE 3.9:
0-30% 9 18%
30-60% 33 66%
60-100% 8 16%
CHART 3.7:
57 | P a g e
Interpretation:
 18% of the respondents allocate only 0 – 30% of their investment into equities. This
means some of the investors do not want to take risk investing into equities rather they
invest into debt or balanced (debt and equity).
 66% of the respondents allocate 30 – 60% of their investments into equities. This means
they are ready to take risk in the hope that they get maximum returns. These investors
invest some of their money into equity like stock market and some into bonds, fixed
deposits etc. thus diversifying their investments
 16% of the respondents allocate 60-100% of their investment into equities. This means
there are very less investors who tend to take maximum risk of investing into equities.
These investors are risk – takers and put almost all their money into stock market and
hope they make profit out of that.
Q8. What is your investment time horizon?
TABLE 3.10:
0 – 1 Year 11 22%
1 – 3 Years 27 54%
3 Years and above 12 24%
58 | P a g e
CHART3. 8:
Interpretation:
 22% of the respondents invest with a shorter investment horizon i.e. 0 -1 year because
they mostly tilt their portfolio in favour of bonds. May be they are more comfortable
in investing in non – risky assets and do not want to take more risk in investing into
stocks or risky assets.
 54% of the respondents invest in a horizon of 1 – 3 years. This shows that the
investors with a greater tolerance of risk tilt their portfolio in favour of stocks and
with a lesser tolerance of risk tilt their portfolio in favour of bonds. Here if a risky
investment performs poorly at the beginning of a short horizon, there little these
investors can do to compensate for loss of wealth but over a long horizon, these
investors can postpone consumption, and work harder to achieve their financial goals.
 24% of the respondents invest in a longer horizon of more than 3 years. This shows
there are investors who tend to take much more risk and mostly into stocks. These
investors think the risk of stocks diminsh as the investment period lengthens because
they feel as the investment period lengthens, the average yearly return over the period
59 | P a g e
is subject to lesser volatility because low returns in some years may be offset by high
returns in other years and vice versa.
Q9. Please indicate your risk perception and risk taking abilities?
TABLE 3.11:
Risk Taker 22 44%
Risk Averser 10 20%
Risk Neutral 18 36%
CHART 3.9:
60 | P a g e
Interpretation
 44% of the respondents are Risk-Takers. This means these investors have an appetite
for risk and mostly they invest into risky assets. Their certainty equivalent to the
expected monetary value is more than the expected value
 20% of the respondents are Risk-Averrers. These investors don’t want to take risk but
expect higher returns from their investment. They don’t diversify their investments
into risky assets but stick to the portfolio which gives constant returns. Here their
certainty equivalent to the expected monetary value is less than the expected value.
 36% of the respondents are Risk-Neutral. These investors are indifferent to risk. These
investors play safe by diversifying their investments into both risky and non-risky
assets. Their certainty equivalent to the expected monetary value is equal to the
expected value.
Q10. Which would you prefer?
TABLE 3.13:
Low Return with Low 11 22%
Risk
Moderate Return with 25 50%
Moderate Risk
High Return with High 14 28%
Risk
61 | P a g e
CHART 3.11:
Interpretation:
 50% of the respondents prefer moderate return with moderate risk. These investors
are risk neutral investors because they take moderate risk by investing into both
equities and debt and other fixed income securities. By this their money invested is
secured and get their principal amount back with moderate returns.
 28% of the respondents prefer high return with high risk. These investors are risk
takers as they largely invest into risky assets in the hope that they maximize their
returns.
62 | P a g e
DATA ANALYSIS
As per the primary data collected through questionnaire and its interpretation we found that
most of the investors want their money to be safe as their first priority. Thus these investors
want be get their money back first then would go for maximizing their returns. Also from the
interpretations, most of the investors prefer moderate return with moderate risk thus showing
that they diversify their investments into balanced funds like equities as well as bonds and
other fixed income securities. By this their investment remains safe and get moderate returns.
From the above analysis, we found out that “Most of the investors don’t prefer return as their
investment criteria rather go for either risk or liquidity or safety of principal etc.”
63 | P a g e
CONCLUSIONS
From the above study we can conclude that,
 Most of them feel that Indian economy is doing good in spite of the economic hit
recession.
 64% of the respondents are aware of the investment options available today. This
shows that remaining number of respondents are not aware and not well educated
about the investment options.
 Out of 36% (18) who are not aware of investment options, 65% of them take help of
investment advisor. This shows most of them are concern of their investment but
remaining 35% out of 18 are ignorant of their investments and are least bothered to
get educated.
 Most of the respondents (38%) investment objective is to create wealth. This shows
most of them invest only for wealth creation by investing in for a longer period
 32% of the respondents prefer safety of principal as 1st priority as their investment
criteria. This shows that the money invested by them has to be safe and their 1st motto
is to get back the money invested then would go for maximizing their returns.
 74% of the respondents review their portfolio. This shows that most of the investors
are concern about their investments and like to keep track of the market conditions
and its volatility.
 Most of the respondents review their portfolio quarterly but still there are 22% of
these investors who don’t know to review their portfolio and are least bothered.
 Most of the respondents (46%) prefer balanced type of portfolio. These investors
rather play safe by not taking too much of risk but at the same time they prefer to
Risk-neutral. They like to diversify their investments into stock, bonds, fixed deposits
etc
 As these investors prefer balanced type, 66% of these investors invest 30-60% into
equities. This clearly shows most of them are aware of the market conditions and
want their money invested to be safe.
 Most of the respondents (54%) invest in a time horizon of 1-3 years. This shows that
they tend to tilt their portfolio according to the market conditions and portfolio
64 | P a g e
performance. If there is any loss in shorter time horizon, they would try to compensate
their wealth loss in a longer horizon.
 44% of the respondents are risk takers. This shows that most of them have the
tendency to take risk and rather invest into risky assets. There are also 36% of the
respondents who are risk neutral. So most of the investors lie in between taking too
much of risk and taking some amount of risk.
 30% of the respondents allow their existing portfolio to continue. These investors
want to invest into the same portfolio for a longer period so as to maximize their
returns and also to offset for any loss in shorter period. By this their money invested is
safe and almost get their expected returns.
 50% of the respondents prefer moderate return with moderate risk. This shows that
half of the respondents don’t take much of a risk by investing into risky assets but
rather diversify their investments into both risky as well as non-risky assets.
So far in India, most of the middle class earners have been risk-averse and therefore park
most of their savings in Fixed Deposits and Other Savings Accounts, though the yield from
such investment avenues is very low. However, the recent trend has been such that more
people have been attracted towards investment in Mutual Funds and Equities. It is in this light
that Portfolio Management Companies have been gaining prominence in India. The trend is
only set to go upwards in the years to come, as the Indian middle class becomes more risk
friendly.
65 | P a g e
RECOMMENDATIONS
We expect that following these recommendations could result in higher abnormal return
for the investors:
 The investors should have a clear understanding of their investment objectives, tax
status and risk tolerances. Only by this the portfolio managers can offer suitable
advice or construct appropriate portfolios.
 Investment must be with reputed organization. Before investment we should be aware
of the standards of the company where we want to invest. Standards of the company
means, balance sheet, size, management capability etc. of the company must be
excellent
 The investment should be carefully done for the previous performance, present market
status and future risk properly assessed for better results
 Equity should be invested in such a manner that assured return must be guaranteed by
regularly watching the market volatility to avoid higher risk.
 Where compatible with investor’s objectives we recommend investing in equities on a
long-term basis. The reason is that equities tend to offer better returns than alternative
investment classes over periods of ten years or more. Although equity prices may be
volatile on a day-to-day basis the effects of this are reduced over time if prices are on
a rising trend. The effects of volatility are also reduced by holding a portfolio of
equities with an appropriate spread of exposures to different sectors and/or countries.
 Not all clients can accept the risk of being fully invested in equities and others may
require higher levels of income than can be prudently achieved from a pure equity
portfolio. In these cases, we will recommend investors setting aside a part of the
portfolio for investment in fixed income stocks (bonds)
 While managing the investment portfolio, it is important to remember that the riskier
strategic investments should always be balanced with more conservative investments.
The investment mix should be constantly monitored to assess which investments are
on track, and which are the ones that need help and which are the ones that need to be
shut down
 A huge market downturn: A simpler way to deal is to re-balance the portfolio to
whatever the target equity weight is, trimming stocks and adding to fixed income or
66 | P a g e
money market. This is a good discipline to get into on a regular basis and helps buffer
the portfolio against the inevitable volatility we see in equity markets.
 Most people need a balance of stocks and bonds in their portfolio, so the question is
how much of each. If they are worried about inflation, we would look at using some
of the RRB's (Real Return Bonds), high quality corporate bonds to increase the yield
and reduce susceptibility to any increases in interest rates and keep their term
relatively short. Overall, we believe the risk: reward relationship favours stocks over
bonds at this point, so we are overweight stocks and underweight bonds.
67 | P a g e
Bibliography
1.Stock Investing For Dummies by Paul J. Mladjenovic
2.The Intelligent Investor: The Definitive Book on Value Investing. by Benjamin Graham,
Jason Zweig and Warren E. Buffett
3.Managing Investment Portfolios: A Dynamic Process (CFA Institute Investment Series) by
John L.
4.Investment Analysis and Portfolio Management (with Thomson ONE - Business School
Edition) by Frank K.
5.Indian Stock Market by Bishnupriya Mishra and Sathya Swaroop Debasish
6. www.moneycontrol.com
7. www.nseindia.com
8. www.bseindia.com
9. www.sebi.gov.in
10. http://en.wikipedia.org/wiki/Securities_and_Exchange_Board_of_India

Black Book 2nd Year Mcom 3rd Sem (1).pdf

  • 1.
    1 | Pa g e A Study of Factors Influencing Investors Decisions With Respect to Portfolio Investment in Mumbai A Project Submitted to HSNC University, Mumbai For Partial Completion Of the degree of Master in Commerce Under the Faculty of Commerce Deepak Niranjan Pradhan Under the Guidance of Prachi Ahuja H.R Collage of Commerce and Economics Churchgate, Mumbai-400020 OCTOBER 2023
  • 2.
    2 | Pa g e Table of Content Sr. No. Contents Page No. 1 Declaration Certificate 4 2 Certificate 5 3 Acknowledgment 6 4 Executive Summary 7 5 Introduction 8 Objectives of the Study Portfolio Risk Investment Criteria for evaluation Common errors in investment management 6 Literature Review 41 Murithial et al., 2012 Sultana et al., 2012 Sivaramakrishnan et al., 2017 Raut, 2020 Sachdeva et al., 2021 Cecily, 2022 Hypothesis 7 Research Methodology 47 Scope of the Study Research Objectives Sampling Method Data Analysis 62 Conclusion 63
  • 3.
    3 | Pa g e Recommendations 65 Bibliography 67
  • 4.
    4 | Pa g e DECLARATION I the undersigned Mr. Deepak Niranjan Pradhan from 2nd Year Mcom My Roll No is HSPMCBF045 here by, declare that the work embodied in this project work titled “A Study of Factor Influencing Investors Decisions With Respect to Portfolio Investments in Mumbai ”, forms my own contribution to the research work carried out under the guidance of Prachi Ahuja is a result of my own research work and has not been previously submitted to any other University for any other Degree/ Diploma to this or any other University. Wherever reference has been made to previous works of others, it has been clearly indicated as such and included in the bibliography. The learner has complied to the provisions of the UGC(Promotion of Academic Integrity and Prevention of Plagiarism in Higher Educational Institution)Regulation 2018. I, here by further declare that all information of this document has been obtained and presented in accordance with academic rules and ethical conduct. Deepak Niranjan Pradhan Name and Signature of the learner Certified by Prachi Ahuja Name and Signature of the Guiding Teacher
  • 5.
    5 | Pa g e H.R Collage of Commerce and Economics Churchgate, Mumbai-400020 Certificate This is to certify that Mr. Deepak Niranjan Pradhan From 2nd Year of Mcom Roll no HSPMCBF045 has worked and duly completed his Project work for the degree of Master of Commerce under the Faculty of Commerce in the subject of his project is entitled , “ under my supervision. I further certify that the entire work has been done by the learner under my guidance and that no part of it has been submitted previously for any degree or diploma of any University. It is his own work and facts reported by his personal findings and investigations
  • 6.
    6 | Pa g e ACKNOWLEDGMENT To list who all have helped me is difficult because they are so numerous and the depthisso enormous. I would like to acknowledge the following as being idealistic channels and fresh dimensions in the completion of this project. I take this opportunity to thank the HSNC University for giving me chance to do this project. I would like to thank my Principal, for providing the necessary facilities required for completion of this project. I take this opportunity to thank our Coordinator , for her moral support and guidance. I would also like to express my sincere gratitude towards my project guide whose guidance and care made the project successful. I would like to thank my College Library, for having provided various reference books and magazines related to my project. Lastly, I would like to thank each and every person who directly or indirectly helped mein the completion of the project especially my Parents and Peers who supported me throughout my project
  • 7.
    7 | Pa g e SUMMERY An investment is a sacrifice of current money or other resources for future benefits. Numerous avenues of investment are available today. The two key aspects of any investment are time and risk. Very broadly, the investment process consists of two tasks. The first task is security analysis which focuses on assessing the risk and return characteristics of the available investment alternatives. The second task is portfolio selection which involves choosing the best possible portfolio from the set of feasible portfolios. Construction of portfolio is only part of the battle. Once it is built, the portfolio needs to be maintained. The market values, needs of the beneficiary, and relative merits of the portfolio components can change over time. The portfolio manager must react to these changes. Portfolio management usually requires periodic revision of the portfolio in accordance with a predetermined strategy. The type of sampling technique used is Simple Random Sampling wherein a questionnaire was prepared and distributed to the retail investors. The investor’s profile is based on the results of a questionnaire that the Investors completed. The Sample consists of 50 people from various backgrounds. The target customers were only the retail investors who invest in various avenues so as to know about their knowledge and concern regarding the economy, principal invested, investment options, market conditions etc. According to the opinion of these investors interpretation has been done and there has been findings and conclusion along with some recommendations.
  • 8.
    8 | Pa g e INTRODUCTION Portfolio A portfolio is an appropriate mix of or collection of investments held by an institution or a private individual. It is a collection of securities, since it is rarely desirable to invest the entire funds of an individual or an institution in a single security. Portfolio analysis considers the determination of future risk and return in holding various blends of individual securities. Portfolio Management Portfolio management is the art and science of making decisions about investment mix and policy, matching investments to objectives, asset allocation for individuals and institutions, and balancing risk against performance. Portfolio management is all about determining strengths, weaknesses, opportunities and threats in the choice of debt vs. equity, domestic vs. international, growth vs. safety, and many other trade-offs encountered in the attempt to maximize return at a given appetite for risk. Portfolio management can by either passive or active, in the case of mutual and exchange- traded funds (ETFs). Passive management simply tracks a market index, commonly referred to as indexing or index investing. Active management involves a single manager, co- managers or a team of managers who attempt to beat the market return by actively managing a fund's portfolio through investment decisions based on research and decisions on individual holdings. Closed-end funds are generally actively managed.
  • 9.
    9 | Pa g e The Key Element of Portfolio Management Asset Allocation: The key to effective portfolio management is the long-term mix of assets. Asset allocation is based on the understanding that different types of assets do not move in concert, and some are more volatile than others. Asset allocation seeks to optimize the risk/return profile of an investor by investing in a mix of assets that have low correlation to each other. Investors with a more aggressive profile can weight their portfolio toward more volatile investments. Investors with a more conservative profile can weight their portfolio toward more stable investments. Diversification: The only certainty in investing is it is impossible to consistently predict the winners and losers, so the prudent approach is to create a basket of investments that provide broad exposure within an asset class. Diversification is the spreading of risk and reward within an asset class. Because it is difficult to know which particular subset of an asset class or sector is likely to outperform another, diversification seeks to capture the returns of all of the sectors over time but with less volatility at any one time. Proper diversification takes place across different classes of securities, sectors of the economy and geographical regions. Objectives of the Study The objectives of study are as follows: 1. To find out whether most of the investors prefer return as their investment criteria rather than risk, liquidity and safety of principal etc. 2. To Find Criteria for evaluating the investment. 3. To Find Common Errors in investment management. 4. To Find Qualities for successful management
  • 10.
    10 | Pa g e Portfolio A portfolio is an appropriate mix of or collection of investments held by an institution or a private individual. It is a collection of securities, since it is rarely desirable to invest the entire funds of an individual or an institution in a single security. Portfolio analysis considers the determination of future risk and return in holding various blends of individual securities. Portfolio expected return is a weighted average of the expected return of individual securities but portfolio variance, in short contrast, can be something less than a weighted average of security variances. As a result an investor can sometimes reduce portfolio risk by adding security with greater individual risk than any other security in the portfolio. This is because risk depends greatly on the co-variance among return of individual securities. Since portfolios expected return is a weighted average of the expected return of its securities, the contribution of each security to the portfolio’s expected returns depends on its expected returns and its proportionate share of the initial portfolio’s market value. Risk Risk is a concept that denotes a potential negative impact to an asset or some characteristic of value that may arise from some present process or future event. In everyday usage, risk is often used synonymously with the probability of a known loss. Risk is uncertainty of the income/capital appreciation or loss of the both. The total risk of an individual security comprises two components, the market related risk called Systematic Risk also known as undiversifiable risk and the unique risk of that particular security called Unsystematic Risk or diversifiable risk.
  • 11.
    11 | Pa g e Types of Risk Modern portfolio theory looks at risk from a different perspective. It divides total risk as follows, Total Risk = Unique Risk + Market Risk Figure 1.1 Relationship between diversification and Risk The Unique Risk of a security represents that portion of its total risk which stems from firm- specific factors like the development of a new product, a labour strike, or the emergence of a new competitor. Events of this nature primarily affect the specific firm and not all firms in general. Hence, the unique risk of a stock can be washed away by combining it with other stocks. In a diversified portfolio, unique risks of different stocks tend to cancel each other – a favourable development in one firm may offset an adverse happening in another and vice versa. Hence, unique is also referred to as diversifiable risk or unsystematic risk. The Unique Risk of a security represents that portion of its total risk which stems from firm- specific factors like the development of a new product, a labour strike, or the emergence of a new competitor. Events of this nature primarily affect the specific firm and not all firms in
  • 12.
    12 | Pa g e general. Hence, the unique risk of a stock can be washed away by combining it with other stocks. In a diversified portfolio, unique risks of different stocks tend to cancel each other – a favourable development in one firm may offset an adverse happening in another and vice versa. Hence, unique is also referred to as diversifiable risk or unsystematic risk Investment Investment may be defined as an activity that commits funds in any financial form in the present with an expectation of receiving additional return in the future. The expectations bring with it a probability that the quantum of return may vary from a minimum to a maximum. This possibility of variation in the actual return is known as investment risk. Thus every investment involves a return and risk. Investment is an activity that is undertaken by those who have savings. Savings can be defined as the excess of income over expenditure. An investor earns/expects to earn additional monetary value from the mode of investment that could be in the form of financial assets. The three important characteristics of any financial assets are: Return – the potential return possible from an asset Risk – the variability in returns of the asset from the chances of its value going down/up. Liquidity – the ease with which an asset can be converted into cash. Investors tend to look at t these three characteristics while deciding on their individual preference [pattern of investments. Each financial asset will have a certain level of each of these characteristics.
  • 13.
    13 | Pa g e Investment Alternatives An investor has wide range of investment avenues such as: Non – Marketable Financial Assets A good portion of financial assets is represented by non – marketable Financial Assets. They can be classified into various categories such as:  Bank Deposits  Post Office Deposits  Company Deposits  Provident Fund Deposit Equity Shares Equity shares represent ownership capital. An equity shareholder has an ownership stake in the company i.e. he / she has a residual interest in income and wealth. Equity shares are classified into broad categories by stock market analysts such as:  Blue Chip Shares  Growth Shares  Income shares  Cyclical Shares  Speculative Shares Bonds Bonds or Debentures represent long-term debt instruments. The issuer of a bond promises to pay a stipulated stream of cash flow. Bonds may be classified into the following categories such as:  Government Securities,  Savings Bonds,  Government Agency Securities,  PSU
  • 14.
    14 | Pa g e  Bonds,  Debentures of Private Sector Companies  Preference Shares. Mutual Funds Schemes Instead of directly buying equity shares and / or fixed income instruments we can participate in various schemes of mutual funds which, in turn, invest in equity shares and fixed income securities. There are three broad types of mutual fund schemes such as:  Equity Schemes  Debt Schemes  Balanced Schemes Life Insurance Policies Life Insurance may also be viewed as an investment. Insurance premiums represent the sacrifice and the assured sum, the benefit. The important types of insurance policies are:  Endowment assurance policy  Money back policy  Whole life policy  Term assurance policy Real Estate For the bulk of the investors the most important asset in their portfolio is a residential house. In addition to a residential house, the more affluent investors are likely to be interested in the following types of real estate:  Agriculture Land  Semi – Urban Land  Commercial Property  A resort home  A second house
  • 15.
    15 | Pa g e Criteria for Evaluation For evaluating an investment avenue, the following criteria are relevant: Rate of Return The rate of return on an investment for a period (usually a period of one year) is defined as follows: Rate of return = Annual Income + (Ending Price – Beginning Price) / Beginning Price Risk The rate of return from investments like equity shares, real estate, silver, and gold can vary rather widely. The risk of an investment refers to the variability of its rate of return like how much do individual outcomes deviate from the expected value? There are some measures which are used to measure risk such as: 1. Dispersion 2. Variance 3. Standard Deviation 4. Beta (This reflects how volatile is the return from an investment relative to market swings.) Marketability An investment is highly marketable or liquid if, 1. It can be transacted quickly 2. The transaction cost is low 3. The price change between two successive transactions is negligible. The liquidity of a market may be judged in terms of its depth, breadth, and resilience. Depth refers to the existence of buy as well as sell orders around the current market price. Breadth implies the
  • 16.
    16 | Pa g e presence of such orders in substantial volume. Resilience means that new orders emerge in response to price changes. Investors value liquidity because it allows them to change their minds. They can correct errors they may have made quickly and cheaply. Further, they can easily modify their investments in line with changing circumstances and objectives. Tax Shelter Some investments provide tax benefits and some do not. Tax benefits are of three types: 1. Initial Tax Benefit: It refers to the tax relief enjoyed at the time of investment. 2. Continuing Tax Benefit: It represents the tax shield associated with the periodic returns from the investment. 3. Terminal Tax Benefit: It refers to relief from taxation when an investment is realized or liquidated. Convenience It refers to the ease with which the investment can be made and looked after. The degree of convenience associated with investments varies widely. Common errors in investment management Investors appear to be prone to the following errors in managing their investments. Some of the common errors are: Inadequate comprehension of return and risk  Vaguely formulated investment policy  NaĂŻve extrapolation of the past  Cursory decision making  Untimely entries and exits  High costs
  • 17.
    17 | Pa g e  Over – diversification and under – diversification Wrong attitude toward losses and profits Qualities for successful investing The game of investment requires certain qualities and virtues on the part of the investors, to be successful in the long run. The following qualities which are mostly found are:  Contrary thinking  Patience  Composure  Flexibility and openness  Decisiveness Optimal Portfolio Once the efficient frontier is delineated, the optimal portfolio has to be determined. To determine the optimal portfolio on the efficient frontier, the investor’s risk – return tradeoff must be known. Figure 2 below represents two illustrative indifference curves which reflect risk – return tradeoff functions. All points lying on an indifference curve provide the same level of satisfaction. The indifference curves Ip and Iq represent the risk – return of two hypothetical investors, P and Q. Both P and Q, like most investors, are risk – averse. They want higher returns to bear more risk. Q is however more risk – averse than P. Q wants a higher expected return for bearing a given amount of risk as compared to P. In general, the steeper the slope of the indifference curve, the greater the degree of risk aversion.
  • 18.
    18 | Pa g e FIGURE1.2: Risk-Return Indifference Curves FIGURE 1.3: Utility Indifference Curves
  • 19.
    19 | Pa g e Figure 3 shows the indifference map for P. In this figure, four risk – return indifference curves, Ip1, Ip2, Ip3, and Ip4 are shown. All the points lying on a given indifference curve offer the same level of satisfaction. For example, points A and B, which lie on the indifference curve Ip1 offer the same level of satisfaction; likewise, points R and S, which lie on the indifference curve Ip2, offer the same level of satisfaction. The level of satisfaction increases as one moves leftward. The indifference curve Ip2, represents a higher level of satisfaction as compared to the indifference curve Ip1; the indifference curve Ip3 represents a higher level of satisfaction when compared to the indifference curve Ip4; and so on. Given the efficient frontier and the risk – return indifference curves, the optimal portfolio is found at the point of tangency between the efficient frontier and a utility indifference curve. This point represents the highest level of utility the investor can reach. In figure 4 two investors P and Q, confronted with the same efficient frontier, but having different utility indifference curves (Ip1, Ip2 and Ip3 for P and Iq1, Iq2 and Iq3 for Q) are shown to achieve their highest utilities at points P* and Q* respectively. FIGURE 4: Optimal Portfolio
  • 20.
    20 | Pa g e Capital Asset Pricing Model (CAPM) The CAPM predicts the relationship between the risk of an asset and its expected return. This relationship is important in two important ways:  It produces a benchmark for evaluating various investments. For example, when the investors analyse a security they are interested in knowing whether the expected return from it is in line with its fair return as per the CAPM.  It helps the investors make a guess about the return that can be expected from an asset that has not yet been traded in the market. Basic Assumptions of CAPM The CAPM is based on the following assumptions:  Individuals are risk averse.  Individuals seek to maximize the expected utility of their portfolio over a single period planning horizon.  Individuals have homogenous expectations they have identical subjective estimates of the means, variances, and covariance’s among returns.  Individuals can borrow and lend freely at a riskless rate of interest.  The market is perfect, there are no taxes, there are no transaction costs, securities are completely divisible, and the market is competitive.  The quantity of risky securities in the market is given.
  • 21.
    21 | Pa g e Portfolio Construction Understanding Portfolio Construction Methodology The methodology used by fund managers to construct their portfolios will very much depend on the type of fund that they are managing, as well as the style of management that they use. Although there are many general funds, such as segregated pension funds, that invest globally, there is a continuing trend towards specialization in particular funds, such as segregated pension funds, that invest globally, there is a continuing trend towards specialization in particular markets, and each market will have its own principal considerations. Equity management involves an element of asset allocation, either to countries managed by the European, Far Eastern Latin America or Emerging Markets desks, or to industries within single countries, especially within the UK. Having said this internationalization of many companies in recent years has resulted in fund 18 managers looking at industry grouping irrespective of the country in which the corporate is based. Since firms derive an increasing proportion of their earnings from countries outside their domicile, it is becoming less and less relevant analyses them on the basis of economic prospects for that country (e.g. GDP growth etc), More relevant are the issues facing each industry. The number of different influences on a portfolio is quite diverse. This creates the need for a broad range of different analyses so that the fund manager can look at his portfolio broken down in different ways, particularly useful are analyses of portfolio giving the weights allocated to each category, especially where these weights are compared to the constituents of the index used as part or all of the fund’s bench mark. Other Analyses are: Equities are sensitive to a number of different factors affecting their market prices in the short, medium or long term. This means that the fund manager needs to look at his portfolio, and the securities held in them, from a number of different perspectives and involves assimilating the huge quantities of data available to fund managers, sourced from external brokers as well as their own firm’s analysts. The key is the interpretation of the data: What does the news imply for a security or overall industry grouping?
  • 22.
    22 | Pa g e Portfolio level analysis includes the following: Fund Break down by: Company Size: In an economic upswing smaller companies may grow faster than larger firms, whilst in a recession investor may prefer larger, more resilient (through cash availability or diversification) companies. Economics theme: E.g. Sensitive to oil prices, interest rates, factors affecting other economics in to products are sold. Overall portfolio factors such as the fund’s beta can also provide useful risk information. As with most types of fund level analysis, the comparison of the funds against the benchmark is the most useful. Other security level analysis includes the price to earnings ratio growth which is a dynamic measure of a trend of changing value (if we are a value -style manager) or changing growth (if we are growth manager). Portfolio Objectives Before selecting the appropriate objectives, several preconditions must be met. They are:  An assessment of the existing situation is necessary like, current needs of the portfolio beneficiary, drastic changes in the composition of the portfolio (especially the level of income generated) may not be feasible.  A second concern is the investment horizon considering if the portfolio is part of a pension fund’s assets (the investment horizon is very long term), the ups and downs of the market etc.  Liquidity needs and ethical considerations established by the fund’s owner. Some of the distinct portfolio objectives are
  • 23.
    23 | Pa g e 1. Stability of Principal When someone says, “I don’t want any chance of losing the money I invest”, the fund manager should interpret this person’s objective as stability of principal. This is the most conservative portfolio objective, and over the long run, it will generate the most modest return. The emphasis here is on preserving the “original” value of the fund. When stability of principal is the objective, the appropriate investment vehicles include any of the money market instruments and bank certificates of deposit. 2. Income The income objective differs from stability of principal in that there is no specific proscription (forbid) against periodic declines in principal value. The consequences of the fluctuations in market may vary. When income is chosen objective, appropriate investments include corporate bonds, government bonds, government agency securities, preferred stock, and some common stock. 3. Growth of Income The time value of money is one of the key concepts in finance. Rupees today are worth more than an equal number of rupees ay any point in the future. This objective usually involves a reduced initial income payout, but one that grows over time and eventually overtakes the level amount from an income objective. The client and the fund manager should clearly understand the difference between income and growth of income as objectives. An income objective seeks to generate as much current income as possible within the risk parameters established. Initially this amount will be higher than that generated by a portfolio seeking growth of income. Eventually, though, income from the latter portfolio will overtake that generated by the former.
  • 24.
    24 | Pa g e The key point is a growth-of-income objective requires the fund manager to seek some capital appreciation in the original principal. This means that some of the fund must be invested in equity securities. The common stocks purchased may generate some income from dividends, but the bulk of the income will come from fixed-income securities such as long- term bonds. 4. Capital Appreciation Occasionally it is not important that a portfolio generate any income at all. A retired couple, for instance, might receive pension and Social Security Checks that are sufficient to finance their retirement life-style. If these people have an investment portfolio, they might be more interested in having it continue to grow in value rather than in getting additional income from it. There is also an income tax consideration. Interest or dividends received are immediately taxable. Capital gains are not taxed until they are actually realized. This means that unless income is actually needed, a rupee capital gain is really worth more than a rupee of income. The unrealized capital gains are not taxed, whereas dividend or interest income is. Taxes can be deferred for many years by successful long-term growth stock investing. The Importance of Primary and Secondary Objectives Establishing the primary objective of the portfolio is a major accomplishment for the fund manager and the fund beneficiary. But it is also prudent and enormously helpful to establish a secondary objective in addition to a primary objective. The secondary objective indicates what is next in importance after specification of primary objective. The portfolio manager has to decide what percentage of the investment funds to put into equities. Most of the remainder will go into debt securities, real assets or hard assets. Consider a person who wants that current income should be the primary objective of the portfolio. This could be accomplished by investing in money market securities, in long-term debt, or in dividend-producing common stock. The client might make statements like, “I
  • 25.
    25 | Pa g e really don’t want to take any risk with this money” or “Is there any chance I am going to lose any of this?”. In this case, stability of principal is probably the client’s secondary objective. In contrast, the client might ask, “Is the income I get going to keep up with inflation?”. This implies growth of income as a secondary objective. To accomplish this, the fund manager must attempt to get some appreciation in the principal of the fund, and this requires a greater investment in equities Steps to Building a profitable portfolio: In today's financial marketplace, a well-maintained portfolio is vital to any investor's success. As an individual investor, we need to know how to determine an asset that best conforms to our personal investment goals and strategies. In other words, our portfolio should meet our future needs for capital and give us peace of mind. Investors can construct portfolios aligned to their goals and investment strategies by following a systematic approach. Here we go over some essential steps for taking such an approach. Step 1: Determining the Appropriate Asset Allocation Ascertaining our individual financial situation and investment goals is the first task in constructing a portfolio. Important items to consider are age, how much time we have to grow our investments, as well as amount of capital to invest and future capital needs. A single college graduate just beginning his or her career and a 55- year-old married person expecting to help pay for a child's college education and plans to retire soon will have very different investment strategies. A second factor to take into account is our personality and risk tolerance. Are we the kind of person who is willing to risk some money for the possibility of greater returns? Everyone would like to reap high returns year after year, but if we are unable to sleep at night when our investments take a short-term drop, chances are the high returns from those kinds of assets are not worth the stress. As we can see, clarifying our current situation and our future needs for capital, as well as our risk tolerance, will determine how our investments should be allocated among different asset classes. The possibility of greater returns comes at the expense of greater risk of losses (a
  • 26.
    26 | Pa g e principle known as the risk/return tradeoff) – we don't want to eliminate risk so much as optimize it for our unique condition and style. For example, the young person who won't have to depend on his or her investments for income can afford to take greater risks in the quest for high returns. On the other hand, the person nearing retirement needs to focus on protecting his or her assets and drawing income from these assets in a tax-efficient manner. Conservative Vs. Aggressive Investors Generally, the more risk we can bear, the more aggressive our portfolio will be, devoting a larger portion to equities and less to bonds and other fixed -income. Conversely, the less risk that's appropriate, the more conservative our portfolio will be. Here are two examples: one suitable for a conservative investor and another for the moderately aggressive investor. The main goal of a conservative portfolio is to protect its value. The allocation shown above would yield current income from the bonds, and would also provide some long-term capital growth potential from the investment in high-quality equities. A moderately aggressive portfolio satisfies an average risk tolerance, attracting those willing to accept more risk in their portfolios in order to achieve a balance of capital growth and income. Step 2: Achieving the Portfolio Designed in Step 1 Once we have determined the right asset allocation, we simply need to divide our capital between the appropriate asset classes. On a basic level, this is not difficult: equities are equities, and bonds are bonds. But we can further break down the different asset classes into subclasses, which also have different risks and potential returns. For example, an investor might divide the equity portion between different sectors and market caps, and between domestic and foreign stock. The bond portion might be allocated between those that are short term and long term, government versus corporate debt and so forth.
  • 27.
    27 | Pa g e There are several ways we can go about choosing the assets and securities to fulfil our asset allocation strategy:  Stock Picking: Choose stocks that satisfy the level of risk we want to carry in the equity portion of our portfolio -sector, market cap and stock type are factors to consider. Analyse the companies using stock screeners to shortlist potential picks, than carry out more in-depth analyses on each potential purchase to determine its opportunities and risks going forward. This is the most work-intensive means of adding securities to our portfolio, and requires us to regularly monitor price changes in our holdings and stay current on company and industry news.  Bond Picking: When choosing bonds, there are several factors to consider including the coupon, maturity, the bond type and rating, as well as the general interest rate environment.  Mutual Funds: Mutual funds are available for a wide range of asset classes and allows us to hold stocks and bonds that are professionally researched and picked by fund managers. Of course, fund managers charge a fee for their services, which will detract from our returns. Index funds present another choice; they tend to have lower fees because they mirror an established index and are thus passively managed.  Exchange-Traded Funds (ETFs): If we prefer not to invest with mutual funds, ETFs can be a viable alternative. We can basically think of ETFs as mutual funds that trade like stocks. ETFs are similar to mutual funds in that they represent a large basket of stocks -usually grouped by sector, capitalization, country and the like -except that they are not actively managed, but instead track a chosen index or other basket of stocks. Because they are passively managed, ETFs offer cost savings over mutual funds while providing diversification. ETFs also cover a wide range of asset classes and can be a useful tool for rounding out our portfolio. Step 3: Reassessing Portfolio Weightings Once we have an established portfolio, we need to analyse and rebalance it periodically because market movements may cause our initial weightings to change. To assess our portfolio's actual asset allocation, quantitatively categorize the investments and determine their values' proportion to the whole.
  • 28.
    28 | Pa g e The other factors that are likely to change over time are our current financial situation, future needs and risk tolerance. If these things change, we may need to adjust our portfolio accordingly. If our risk tolerance has dropped, we may need to reduce the amount of equities held. Or perhaps we are now ready to take on greater risk and our asset allocation requires that a small proportion of our assets be held in riskier small – cap stocks. Essentially, to rebalance, we need to determine which of our positions are overweighed and underweighted. For example, say we are holding 30% of our current assets in small-cap equities, while our asset allocation suggests we should only have 15% of our assets in that class. Rebalancing involves determining how much of this position we need to reduce and allocate to other classes. Step 4: Rebalancing Strategically Once we have determined which securities we need to reduce and by how much, decide which underweighted securities we will buy with the proceeds from selling the overweighed securities. To choose our securities, the approaches discussed in Step 2 are used. When selling assets to rebalance our portfolio, a moment is taken to consider the tax implications of readjusting our portfolio. Perhaps our investment in growth stocks has appreciated strongly over the past year, but if we were to sell all of our equity positions to rebalance our portfolio, we may incur significant capital gains taxes. In this case, it might be more beneficial to simply not contribute any new funds to that asset class in the future while continuing to contribute to other asset classes. This will reduce our growth stocks' weighting in our portfolio over time without incurring capital gains taxes. At the same time, the outlook of our securities has to be always considered. If we suspect that those same overweighed growth stocks are ominously ready to fall, we may want to sell in spite of the tax implications. Analyst opinions and research reports can be useful tools to help gauge the outlook for your holdings. And taxloss selling is a strategy we can apply to reduce tax implications.
  • 29.
    29 | Pa g e Importance of Diversification. Throughout the entire portfolio construction process, it is vital that we remember to maintain our diversification above all else. It is not enough simply to own securities from each asset class; we must also diversify within each class. Ensure that our holdings within a given asset class are spread across an array of subclasses and industry sectors. As already mentioned, investors can achieve excellent diversification by using mutual funds and ETFs. These investment vehicles allow individual investors to obtain the economies of scale that large fund managers enjoy, which the average person would not be able to produce with a small amount of money. Security Screening: Security screening is an important part of the portfolio construction process, but one about which relatively little is written. Picking stocks is an art rather than a science; there is no best way to do the screening, nor is there even a right or wrong way. Everyone who participates in the capital markets uses some type of screen –a procedure for reducing a large set of alternatives to a more manageable number. Sources of Information There are several well-known and readily accessible sources of information that can be very helpful in gathering some quick information about unfamiliar securities. These are:  Value Line: One of the best-known subscription services is the Value Line Investment Survey. This weekly publication from value line, Inc., follows 1700 different common stocks and rates them in two categories: Timeliness refers to precisely what one would expect i.e., the advisability of buying this stock now.
  • 30.
    30 | Pa g e Safety refers to the confidence the Value Line analysts have in their forecasts about the firm. Value Line assigns a ranking in each of these categories according to the schedule listed in the table below RANKING NUMBER OF STOCKS WITH THIS RANKING MEANING 1 100 Best 2 300 Above average 3 900 Average 4 300 Below average 5 100 Worst TABLE 1.1: Value Line Ranking System  Standard & Poor’s Standard & Poor’s Corporation publishes a wide variety of reports on the economy, industries, and individual stocks. Two of these reports are especially useful to portfolio managers  Stock Report: The S&P Stock Report is a one-page document that contains a surprisingly thorough description of a company and an estimate of what the future holds for it. These reports are updated quarterly and are housed in a loose-leaf binder in most public libraries. The report contains financial statement information in addition to dividend payment dates, beta, and other risk measures.  Stock Guide: The S&P Stock Guide is published monthly and contains summary statistics on thousands of common stocks, warrants, and mutual funds. This publication is small enough to be carried conveniently in a briefcase or coat pocket. Many brokers receive a dozen or so of these each month and provide them to their customers who request them. Although they are published monthly, a Stock Guide that is several months old is still quite useful.  Moody’s Investment Service: Another widely used set of investment information are the volumes published by Moody’s Investment Service. These volumes are collectively called “Moody’s Manuals”. Some of the individual volumes are:
  • 31.
    31 | Pa g e  Moody’s Manual of Investments: Most needs for quick information can be satisfied by either the Stock Report or the Stock Guide, but at times we may not find what we need in these two sources. Moody’s Manual of Investments is a good place to turn next. This publication contains several sets of volumes: one set of industrial firms, one on municipals and governments, one on OTC industrials, one on public utilities, and one on transportation issues. An especially common problem arises when we seek information about a company that, unknown to us, doesn’t have stock that trades publicly. The firm may be a subsidiary of another company or may not be publicly held. The blue pages of Moody’s Manuals contain a cross-reference of subsidiaries. For instance, we will find that Pizza Hut is a subsidiary of Pepsico. Moody’s Manuals also contain more detailed news reports about a firm, more detailed financial statements, and other relevant information that cannot be included in the Stock Report because of space limitations. This information source is a heavy book, is expensive to acquire, and cannot be conveniently be taken outside.  Moody’s Dividend Record: When it is necessary to investigate the recent dividend history of a company (payment dates, ex-dividend dates, and so on), Moody’s Dividend Record is one of the most convenient places to get this information quickly. Brokerage Information A final information source available is through our broker. All full-service brokerage firms (and some discount firms) have in-house research capability. We can request a report on a particular company or give our broker a list of securities of interest and ask that we receive reports on these firms as they are produced. The Role of Real Assets: Introduction: Modern investment decisions involve a lot more than traditional stocks and bond issues. A general lack of understanding of concepts like duration and or the utility of futures market products contributed to the demise of many savings and loans. Today’s executives in any business must keep pace with changes in the industry if they want to survive. There are two
  • 32.
    32 | Pa g e assets timberland and gold, which are non-traditional in the sense that most portfolio managers have limited understanding of them. Not every portfolio can, or should, invest in these. Before looking at specific information about these investment alternatives, it is useful to know the distinction between financial assets and real assets. Most portfolios are invested in financial assets. These are familiar securities such as shares of common stock, corporate bonds, and bank certificates of deposit. The key characteristic of a financial asset is that for each such asset, somewhere out there a corresponding liability exists. Financial assets are on two balance sheets: as an asset for someone and as a liability for someone else. Real assets, in contrast, do not have a corresponding liability, although one may be created to finance the purchase of the asset. Real estate purchases are normally leveraged. Real Estate in General: Investment Characteristics Real estate is widely acclaimed as a good investment. Most real estate cites three fundamental characteristics of land. Land is immobile, indestructible, and no fungible (means every plot is unique). Land obviously cannot be moved. Land is widely considered a long- term investment, although it does not have to be. Timberland buyers often hope to liquidate the timber and sell the “carcass” over a fairly short time horizon. The majority of institutional landowners are looking for a mix of annual cash flows and long-term capital appreciation. Five general categories of real estate are shown in table below: Residential Commercial Industrial Farm Special Purpose Owner occupied Office buildings Light manufacturing Timberland Cemeteries Rental Store Properties Heavy manufacturing Pastureland Churches Lofts Ranches Ranches Government properties Theatres Orchards Golf Courses Garages Farmland Parks
  • 33.
    33 | Pa g e Hotel and motels Public building and streets TABLE 1.2: Categories of real estate GOLD In a nutshell, perhaps the most important general investment characteristic of gold is people buy it primarily because of the security it provides against times of trouble. Numerous factors can make gold an attractive investment. Like timberland, gold has historically demonstrated returns that are unrelated to the stock market as a whole. This makes gold a powerful diversifying agent in a portfolio. Gold is a popular trading commodity among speculators because of its price volatility. It is popular with hedgers because of its risk-reduction characteristics. No one likes inflation. Historically, gold has been a useful inflation hedge, and an increase in the price of oil raises fears of inflation. Investing in gold An individual or an institution can invest in gold in four principal ways:  Bullion: The rare individual may have the money and inclination to buy gold bars (bullion) and stack them in basement. Smaller quantities may be stored in 1-ounce bars, in nuggets, or as gold dust. These investments may be exotic, but they have obvious shortcomings. First, there is a significant risk of theft. Second, they produce no income until sold. Third, they lack marketability.  Gold Certificates: Investors also can purchase documents representing ownership of gold bullion that is kept by someone else on their behalf. A number of banks in the United States and Canada issue these gold certificates, which are obligations of the issuer to deliver gold upon demand. If we purchase these, we can actually take delivery any time we wish. Certificates are registered in our name, which adds a bit of security to the investment. Certificates may be readily sold back to the dealer from whom we bought them, although we will lose a few percentage points in the dealer’s
  • 34.
    34 | Pa g e bid-ask spread. The primary advantage of gold certificates over the bullion itself is convenience. We are freed from worry about storage, delivery, and insurance. These certificates do carry the risk that there is no gold backing them, but if we deal through a major bank or brokerage firm, this risk is minimal.  Shares in Mining Companies: Perhaps the most popular form of gold ownership in the United States is through the purchase of shares in goldmining companies, either directly or through a mutual fund. Owning shares has major advantages over other forms of ownership as shares are instantly marketable and can generate some income through dividends.  Coins: Gold coins are popular with both collectors and gold speculators. It is important to distinguish between a coin’s intrinsic value and its numismatic value. A coin’s value intrinsic value is the higher of its bullion value or its fiat value (the value assigned to it by the issuing government). Collectors may be willing to pay more than the value of gold contained in a coin because the coin is rare or popular. Some people find it difficult to be both collectors and investors in gold. Portfolio Management The technique of matching the assets of one’s portfolio with predetermined financial goals is called Portfolio Management. Construction of a portfolio is only part of the battle. Once it is built, the portfolio needs to be maintained. The market values, needs of the beneficiary, and relative merits of the portfolio components can change over time. The portfolio manager must react to these changes. Portfolio management usually requires periodic revision of the portfolio in accordance with a predetermined management strategy. Portfolio involves deciding what assets to include in the portfolio, given the goals of the portfolio owner and changing economic conditions. Selection involves deciding what assets to purchase, how many to purchase, when to purchase them, and what assets to divest. These decisions always involve some sort of performance measurement, most typically expected return on the portfolio, and the risk associated with this return (i.e. the standard deviation of the return). Typically, the expected return from portfolios of different asset bundles are
  • 35.
    35 | Pa g e compared. The unique goals and circumstances of the investor must also be considered. Some investors are more risk averse than others. Goals of portfolio management The three goals of portfolio management are:  Maximize the value of the portfolio  Seek balance in the portfolio  Keep portfolio projects strategically aligned Types of portfolio management An active management policy is one in which the composition of the portfolio is dynamic. That is, the manager routinely changes the portfolio components or their proportion within the portfolio. In contrast, a strategy of passive management is one in which the portfolio, once established, is largely left alone. Before selecting one of these approaches, it is important to understand the choices and their costs.  Active portfolio management: Portfolio managers (either independent advisors or managers tied to financial management firms) are constantly involved in the active management of portfolios. They aim at earning more than the average market return on the chosen investments. Market research is undertaken to formulate investment strategies. Active portfolio management strategy involves purchasing undervalued securities or selling securities that are overvalued. The success of an investment portfolio depends on the skills of a portfolio manager and the accuracy of market research.  Passive portfolio management: This process is limited to selecting securities that track a particular index. It includes formulating an investment plan as part of portfolio building. Decisions regarding asset classes and the proportional allocation of funds to them need to be finalized. This is followed by keeping records and rebalancing the portfolio when needed.
  • 36.
    36 | Pa g e What are the factors that influence this process? Portfolio management would begin with the setting of investing objectives. While one investor may aim for rapid growth, another may be seeking safe investments. Accordingly, one can choose between debt instruments (such as bonds) and equities (stocks). In addition, derivatives (such as options and futures contracts) are can also help diversify the portfolio. Other factors that affect the process of portfolio management are:  Financial circumstances of the portfolio owner  Investment performance measurement (including expected return and risk associated with it)  The changing economic conditions  A preference of the area of investment (domestic or international) Performance Evaluation Performance evaluation is a critical, and often poorly handled, part of the portfolio management process. The principal problem with performance evaluation is the human tendency to focus on the return a portfolio earned over a period of time with little regard to the risk taken in achieving that return. Proper performance evaluation should involve recognition of both the return and the riskiness of the investment. Importance of measuring portfolio risk The importance of associating a security’s return with a measure of the riskiness of that return is a principle of finance. A precept of finance theory is the concept of utility maximization: when given the choice, people avoid distasteful events and seek out satisfying phenomena. They try to maximize the expected utility associated with their decisions. Investors must choose between investment alternatives where the future performance of the competing investment choices is uncertain.
  • 37.
    37 | Pa g e Models Some of the financial models used in the process of Valuation, stock selection, and management of portfolios include:  Maximizing return, given an acceptable level of risk.  Modern portfolio theory - a model proposed by Harry Markowitz among others.  The single – index model of portfolio variance.  Capital asset pricing model.  Arbitrage pricing theory.  The Jensen Index.  The Treynor Index.  The Sharpe Diagonal (or Index) model.  Value at risk model. Traditional Performance Measures  Sharpe and Treynor Measures: The Sharpe measure uses the standard deviation of periodic security returns, whereas the Treynor measure uses the security (or portfolio) beta.  Jensen Measure: Another traditional performance measure, the Jensen measure, is seldom used today. It stems directly from the implications of the Capital Asset Pricing Model: Post-modern portfolio theory Post-modern portfolio theory (or "PMPT") is an extension of the traditional modern portfolio theory (“MPT”, also referred to as Mean-Variance Analysis or “MVA”). Both theories propose how rational investors should use diversification to optimize their portfolios, and how a risky asset should be priced.
  • 38.
    38 | Pa g e Overview Harry Markowitz laid the foundations of MPT, the greatest contribution of which is the establishment of a formal risk/return framework for investment decisionmaking. By defining investment risk in quantitative terms, Markowitz gave investors a mathematical approach to asset-selection and portfolio management. But there are important limitations to the original MPT formulation. Limitations Two major limitations of MPT are its assumptions that;  Variance of portfolio returns is the correct measure of investment risk, and  The investment returns of all securities and portfolios can be adequately represented by the normal distribution. Stated another way, MPT is limited by measures of risk and return that do not always represent the realities of the investment markets. Standard deviation and the normal distribution are a major practical limitation: they are symmetrical. Using standard deviation implies that better-thanexpected returns are just as risky as those returns that are worse than expected. Furthermore, using the normal distribution to model the pattern of investment returns makes investment results with more upside than downside returns appear riskier than they really are, and vice-versa for returns with more a predominance of downside returns. The result is that using traditional MPT techniques for measuring investment portfolio construction and evaluation frequently distorts investment reality. It has long been recognized that investors typically do not view as risky those returns above the minimum they must earn in order to achieve their investment objectives. They believe that risk has to do with the bad outcomes (i.e., returns below a required target), not the good outcomes (i.e., returns in excess of the target) and that losses weigh more heavily than gains. "Under certain conditions the MVA can be shown to lead to unsatisfactory predictions of (investor) behavior. Markowitz suggests that a model based on the semi variance would be
  • 39.
    39 | Pa g e preferable; in light of the formidable computational problems, however, he bases his (MV) analysis on the mean and the standard deviation." Recent advances in portfolio and financial theory, coupled with today’s increased electronic computing power, have overcome these limitations. The resulting expanded risk/return paradigm is known as Post-Modern Portfolio Theory, or PMPT. Thus, MPT becomes nothing more than a (symmetrical) special case of PMPT. PMPT PROCESS In PMPT an analogous process is followed:  Observe the monthly returns,  Fit a distribution that permits asymmetry to the observations,  Annualize the monthly returns, making sure the shape characteristics of the distribution are retained,  Apply integral calculus to the resultant distribution to calculate the appropriate statistics. Portfolio Manager A team of analysts and researchers are ultimately responsible for establishing an investment strategy, selecting appropriate investments and allocating each investment properly for a fund- or asset-management vehicle. Portfolio managers are presented with investment ideas from internal buy-side analysts and sell-side analysts from investment banks. It is their job to sift through the relevant information and use their judgment to buy and sell securities. Throughout each day, they read reports, talk to company managers and monitor industry and economic trends looking for the right company and time to invest the portfolio’s capital.
  • 40.
    40 | Pa g e Portfolio managers make decisions about investment mix and policy, matching investments to objectives, asset allocation for individuals and institutions, and balancing risk against performance. Portfolio managers make decisions about investment mix and policy, matching investments to objectives, asset allocation for individuals and institutions, and balancing risk against performance. In the case of mutual and exchange-traded funds (ETFs), there are two forms of portfolio management: passive and active. Passive management simply tracks a market index, commonly referred to as indexing or index investing. Active management involves a single manager, co-managers, or a team of managers who attempt to beat the market return by actively managing a fund's portfolio through investment decisions based on research and decisions on individual holdings. Closed – end funds are generally actively managed
  • 41.
    41 | Pa g e LITERATURE REVIEW Numerous research studies have been carried out over time to examine the elements and factors influencing investors' behaviour and decisions while making investments. The literature in this review paper has been taken from 20 studies of investors spread across 11 years (from 2012-2022) in various parts of India. Murithial et al., 2012 made an effort to research the market's available investment choices, investors' investment preferences, and the factors that influence why people choose to invest in particular financial instruments. Proportional analysis on a sample of 100 respondents, the Chi-square test, bar chart, and correlation analysis were used. A large portfolio is not a reliable indicator of a sound investment. They came to the conclusion that Indian investors understand the notion of portfolio allocations as well as risk and return on investment. In India, buying gold and real estate are the two best ways to invest. It has a good return and is well-liked. This demonstrated that Indian investors, despite their high income and education levels, are conservative ones. Sultana et al., 2012 made an effort to examine and pinpoint the variables impacting Indian individual equity investors' stock selection. For the aim of choosing the sample, various stock brokerage firms were contacted, and a sample of 891 investors—out of a total of 1500—was taken into consideration. Factor analysis approaches were used to research the variables influencing individual equities investors' behaviour. They came to the conclusion that the typical modern investor is an educated, well-groomed person. Following the application of factor analysis, it was discovered that all 40 attributes can be boiled down to the ten factors listed below: individual eccentricity, wealth maximisation, risk minimization, brand perception, social responsibility, financial expectation, accounting information, government & media, economic expectation, and advocate recommendation factors. Sahi et al., 2013 performed an in-depth examination of investor beliefs and preferences, the goal of their article was to discover individual investors' views and attitudes about financial investment decision making, with a focus on investor biases. For this purpose, 30 exploratory semi structured interviews were undertaken. According to this study, understanding an individual investor's psychology can aid in better understanding how individual investing
  • 42.
    42 | Pa g e decisions are made. The technique and analysis of this study added value to it. This article added new understanding about financial product purchasing behaviour by examining the perceptions and opinions of the financial consumer regarding their financial investment biases. Gender differences in employee investing behaviour were the subject of an investigation by Bhushan et al., 2013. His research study used the survey approach to get data from the respondents. Their findings suggest that there are considerable gender differences in employees' investing preferences for market investments, fixed deposits, and health insurance. Sureshrajan et al., 2013 looked at how investors felt about various investment and saving options. They took a sample of 300 investors and determined that even though the sample of stratified investors, such as government employees, private employees, business people, and housewives, had different age, different educational levels, different professions but they had same pattern of investment. The primary contribution of the study was to demonstrate that investors' preferences for risk reduction in their investments are based on a sample of people who regularly make investment decisions. Jothilingam et al., 2013 conducted a literature review on the attitudes of investors toward various investment possibilities. Both primary and secondary data sources were used to create this. The key Finding was that Investors favored less risky investment options including gold, mutual funds, and bank deposits. It was proposed that female investors should be enthusiastic about investing in alternatives to gold, such as mutual funds, securities and cash. This can be a sign that they want to stay out of dangerous circumstances.
  • 43.
    43 | Pa g e Sellappan et al., 2013 attempted to demonstrate the key requirement of women's investment attitudes toward various types of securities. They analyzed that risk-takers were more likely to be young and single. Older and married folks shied away from risk. Married women were more eager to invest than single women. Compared to older women, younger women were more likely to invest in fixed deposits, insurance, mutual funds, and stocks. Charles et al., 2014 made an attempt to determine whether or not a person's emotions influence their investment personality. A multi-stage sampling strategy was used to gather data from 742 ordinary investors who visited the Indian stock market for that purpose. AMOS, STATA, SPSS, and SEM models were used to quantitatively examine the data that had been gathered. The results of their study revealed that an investor's investment personality may be influenced by their intuitiveness based on emotions. Umamaheswari et al., 2014 identified the elements that had an absolute influence on the choices and priorities of investments made by the target group of investors while also paying close attention to the investment preferences of the salaried class. The primary elements that impact salaried investors were awareness, attitude, anticipation, and satisfaction. This research used random sampling to plan the relationship between the top group and demographic aspects of the salaried middle class that influence investment criteria such as investment awareness, investment attitude, and investment returns. Parimalakanthi et al., 2015 sought to understand how Coimbatore city residents behaved as individual investors in relation to the various investment opportunities in the Indian financial markets. The safety of the principal amount, liquidity, income stability, and appreciation were the main driving forces behind an investment. The easy sampling method was used to choose 107 clients. Utilizing the Friedman test, Garratt ranking, and factor analysis, the acquired data was evaluated. According to the author, security was also one of the most favoured components in fixed income and investment for safety. The key element in long-term investment was capital approval. The most chosen alternative for investments in liquid assets was additional income.
  • 44.
    44 | Pa g e Singh, 2015 intended to find elements that affect investors when they invest in the stock market, as well as some of the factors that inspire investors to buy shares. The study was empirical in nature, and a convenience sample of 100 individual investors had been taken. Primary and secondary data was used, and data gathered through questionnaires. They concluded that when a person decides to invest, he or she takes into account factors including tax planning, future demands, investment safety, recurring income, etc. The goals of investment have a major impact on investment decisions. The author went on to say that when investing in the market, both men and women are worried about previous dividends. The survey also found that male investors examined financial ratios including the P/E ratio, the D/P ratio, and other liquidity ratios, whereas female investors were less comfortable with financial ratios due to lack of financial knowledge. Thulasipriya, 2016 investigated the evidence that salaried investors' investing behaviour is influenced by other investors, as well as the investment preferences of salaried investors. The research shows that salaried investors seek both long-term and short-term investments to protect their future financial security. The author concluded that salaried individuals prefer investment alternatives that offer long-term benefits and extraordinarily secure cum gratifying pathways, regardless of their age or annual salary, as well as their work and marital situation. Sivaramakrishnan et al., 2017 investigated the impact of elements like financial literacy on a consumer's choice of investments, notably in the stock market. In a mixed-methods study, qualitative research came first and was followed by a quantitative survey-based investigation. In-depth interviews with investors and specialists were conducted. 506 retail investors from four Indian cities responded, and their responses were analyzed. The study's findings showed that real stock market investments were predicted by investment intentions (which represented behaviour). Both subjective and objective financial literacy were discovered to have a considerable impact on intentions, but only objective financial literacy appeared to have an impact on behaviour. A second-order construct called "Attitude to Investment Behaviour" was created by combining the three variables "perception of regulator," "risk avoidance," and "burden factor." The intention to invest in the equity markets
  • 45.
    45 | Pa g e was negatively impacted by this. Financial security appeared to have a positive association with behaviour but a negative effect on intention. Singh et al., 2018 made research on risk perception of bank employees as they possess higher level of financial literacy as compared to other persons in the society. He found that the general risk perception of bank personnel was moderate. Fear psychosis, lack of information, and lack of confidence are three elements that influence total risk perception, and these three characteristics have an impact on employees' investing decisions. The research was the first of its sort, making it unique. Akhtar et al., 2019 explained the investment intention of potential individual investors in a developing nation (in this case, India). A questionnaire-based survey was conducted as part of the study's quantitative and cross-sectional methodology to gather responses from potential individual investors (920 usable responses). The link between the constructs was established using AMOS and SPSS.The study's findings revealed that while financial self-efficacy played a dual role in the interaction between personality traits and investment intention, attitude was partially responsible for mediating the association between financial knowledge and investment intention. On the other hand, subjective norms had a somewhat favourable influence on investment intention Raut, 2020 initiated to understand how prior behaviour and financial literacy affect individual investors' investment decisions. His study looked at the applicability of the planned behaviour theory in this situation. The study used a self-administered questionnaire, convenience sampling, and a snowball sampling method to gather information from individual investors in each of India's four different states. AMOS 20.0 was used to analyse the collected data using two-step structural equation modelling (SEM). Results showed that each predicted predictor had a substantial impact. The investor's purpose was not significantly impacted by past behaviour directly, but it was significantly impacted indirectly through investor attitude. Multiple squared correlation (R2) results revealed that the final model could account for 36% of the variation in investors' intention to invest in stocks, indicating a successful application of the TPB model with the addition of external factors. In
  • 46.
    46 | Pa g e addition, it was discovered that Indian investors were heavily impacted by social pressure, which may be reduced through financial literacy Cecily, 2022 made research that the most popular option among investors is a bank deposit, which they actually believe is the most safe and easy way of investment. This indicates that safety is the major factor influencing the decision of investors. The city of Chennai was chosen for this study because of its distinct and distinctive historical significance. The investors are less aware that investing in mutual funds has a number of benefits, including adaptability, diversification, liquidity, profitability, high-quality collateral, and tax advantages. Alterations in demographic variables like age, income, education, and occupation have an impact on the preferred investment avenue. According to certain studies, the attitude toward risk is more strongly influenced by variables including marital status, the number of dependents, wealth, and income. Hypothesis Statement A hypothesis is a proposed explanation for an observable phenomenon. The term derives from the Greek word – hyposthenia meaning "to put under" or "to suppose”. For the present study it is proposed to have following hypothesis: Null Hypothesis: Most of the investors prefer return as their investment criteria rather than risk, liquidity and safety of principal etc.
  • 47.
    47 | Pa g e RESEARCH METHODOLOGY Data collection method To get the information about the study, a survey has been conducted considering number of respondents. Respondents were selected by using random sampling technique. Selection of Sample To get the information about the study, a survey has been conducted considering number of respondents. Respondents were selected by using random sampling technique. Samples would be chosen as various possible investments or funds under a portfolio. Data has been collected through questionnaire mainly considering various age groups, their risk perception, risk appetite, safety of principal, liquidity etc. Keeping this view in mind we followed a simple method of selecting respondents – following the method of “Simple Random Sampling”. The respondents were selected randomly. Due to the want of time and resources only 50 respondents were selected for the study. Q 1. How do you look into Indian economy? TABLE 3.1: Very Good 10 20 Good 37 74 Bad 3 6 Don’t Know 0 0
  • 48.
    48 | Pa g e CHART 3.1: Interpretation:  74% of the respondents have said Indian economy is good. This means that after the economic meltdown the Indian economy has been faring well.  20% of the respondents have said Indian economy is very good. This means they feel that irrespective of the recession effects, the economy is doing good  6% of the respondents feel Indian economy is bad. This means they still feel the economy has to grow for better means.  Each and every respondent has a fair idea about Indian economy, therefore there were no respondents as such who said that they don’t know about Indian economy. Q2. Being an investor, you must be aware of all investment options available today? TABLE 3.2
  • 49.
    49 | Pa g e YES 32 64% NO 17 34% DIDN’T SAY 1 2% CHART 3.2: Interpretation:  64% of the respondents are aware of all the investment options available. This means they have been tracking the market conditions and have a fair idea of what are the options available for investing wherein they can earn money.  34% of the respondents are not aware of the investment optionsavailable. This means they are least bothered to know about the optionsavailable for investing and rather try to play safe side by not taking too much of risk.
  • 50.
    50 | Pa g e  2% of the respondents didn’t say anything because they may not have any idea of what are the investment avenues and may be they take help of third party for their investments and remain ignorant. Q3. If No, do you take help of an investment advisor? TABLE 3: CHART 3.3:
  • 51.
    51 | Pa g e Interpretation:  Out of total respondents, 34% (17) said they are not aware of all the investment options available and out of this,  65% of 17 respondents take the help of investment advisor because they are not aware of the present market conditions and its volatility and don’t want to take unnecessary risk by investing into various portfolio without understanding its consequences.  35% of 17 respondents don’t take help of investment advisor even if they are not aware of the investment avenues. This shows the ignorance of the investors and their lack of interest towards being educated regarding various investment options. Q4. Is your investment objective for? TABLE 3.4:
  • 52.
    52 | Pa g e Retirement Planning 14 28% To meet major commitments 13 26% Wealth Creation 19 38% Others 4 8% CHART 3.4: Interpretation  28% of the respondents have said their investment objective is for retirement planning. This means they are investing in order to secure their future after their retirement.
  • 53.
    53 | Pa g e  26% of the respondents have said their investment objective is to meet major commitments. Here major commitments mean higher education for their dependents, marriage etc.  38% of the respondents have said their investment objective is for wealth creation. This means majority of the investors invest to create wealth. Their motto is to invest into various avenues and get maximum out of it.  8% of the respondents have said they have some other reasons for investment instead of creating wealth, to meet major commitments and retirement planning. Q5. Do you review your portfolio? TABLE 3.6: CHART 3.5: Interpretation:  74% of the respondents review their portfolio. This means they are concerned about their investment and its consequences. They check frequently whether their
  • 54.
    54 | Pa g e portfolio is giving them the returns they are expecting otherwise they tend to review it. The frequency of review varies from investor to investor.  26% of the respondents do not review thir portfolio. This means once they create their portfolio they are not concerned anymore to check whether the portfolio is giving them the best returns and rather stick to it in the hope that the same portfolio would give them the best returns. It also shows they do not want to take risk of diversifying their investment and may be they do not have much idea of how market conditions are. Q6. If yes, the reason for review and the frequency (How often you review)? TABLE 3.7: Weekly 6 12% Fortnightly 1 2% Quarterly 7 14% Monthly 4 8% Half-yearly 4 8% Yearly 6 12% Didn’t Say 22 44% CHART 3.6:
  • 55.
    55 | Pa g e Interpretation:  12% of the respondents review their portfolio weekly. This shows that these investors have concern for their investment and check every week whether their money is safe or else they need to reconstruct their portfolio.  14% of the respondents review their portfolio fortnightly. These investors review their investments once in two weeks. They keep themselves in track with the market conditions and its volatility. If their portfolio is faring well then they would continue with it.  8% of the respondents review their portfolio monthly. Every month these investors check whether their investment into various securities is giving them the expected returns or not.  14% of the respondents review their portfolio quarterly. These investors don’t review their portfolio frequently rather they review it in every three months. These investors may keep themselves in track with the market conditions and how well the securities are faring in the market.  8% of the respondents review their portfolio for every 6 months. These investors continue with their investments for 6 months in the hope that those would give them the maximum returns. This is a risk which these investors are taking because it is not a long term investment and they are least bothered about their money in the market.  12% of the respondents review their portfolio yearly. These investors are rather very ignorant of how the market and economy is going on and may be they take help of the investment advisors. Due to this they least bother to check whether their money is safe and is getting them the required returns.  44% of the respondents don’t review their portfolio. This shows that how ignorant they are with respect to their money invested. They also don’t keep track of the market conditions and are not well educated about the investment avenues. Most of these investors fully depend upon their investment advisors and are least bothered of what is happening with their money. The only thing is they want their money invested to be safe and in the meantime get maximum returns out of it.
  • 56.
    56 | Pa g e Q7. What proportion of your portfolio would you feel comfortable allocating to equities? TABLE 3.9: 0-30% 9 18% 30-60% 33 66% 60-100% 8 16% CHART 3.7:
  • 57.
    57 | Pa g e Interpretation:  18% of the respondents allocate only 0 – 30% of their investment into equities. This means some of the investors do not want to take risk investing into equities rather they invest into debt or balanced (debt and equity).  66% of the respondents allocate 30 – 60% of their investments into equities. This means they are ready to take risk in the hope that they get maximum returns. These investors invest some of their money into equity like stock market and some into bonds, fixed deposits etc. thus diversifying their investments  16% of the respondents allocate 60-100% of their investment into equities. This means there are very less investors who tend to take maximum risk of investing into equities. These investors are risk – takers and put almost all their money into stock market and hope they make profit out of that. Q8. What is your investment time horizon? TABLE 3.10: 0 – 1 Year 11 22% 1 – 3 Years 27 54% 3 Years and above 12 24%
  • 58.
    58 | Pa g e CHART3. 8: Interpretation:  22% of the respondents invest with a shorter investment horizon i.e. 0 -1 year because they mostly tilt their portfolio in favour of bonds. May be they are more comfortable in investing in non – risky assets and do not want to take more risk in investing into stocks or risky assets.  54% of the respondents invest in a horizon of 1 – 3 years. This shows that the investors with a greater tolerance of risk tilt their portfolio in favour of stocks and with a lesser tolerance of risk tilt their portfolio in favour of bonds. Here if a risky investment performs poorly at the beginning of a short horizon, there little these investors can do to compensate for loss of wealth but over a long horizon, these investors can postpone consumption, and work harder to achieve their financial goals.  24% of the respondents invest in a longer horizon of more than 3 years. This shows there are investors who tend to take much more risk and mostly into stocks. These investors think the risk of stocks diminsh as the investment period lengthens because they feel as the investment period lengthens, the average yearly return over the period
  • 59.
    59 | Pa g e is subject to lesser volatility because low returns in some years may be offset by high returns in other years and vice versa. Q9. Please indicate your risk perception and risk taking abilities? TABLE 3.11: Risk Taker 22 44% Risk Averser 10 20% Risk Neutral 18 36% CHART 3.9:
  • 60.
    60 | Pa g e Interpretation  44% of the respondents are Risk-Takers. This means these investors have an appetite for risk and mostly they invest into risky assets. Their certainty equivalent to the expected monetary value is more than the expected value  20% of the respondents are Risk-Averrers. These investors don’t want to take risk but expect higher returns from their investment. They don’t diversify their investments into risky assets but stick to the portfolio which gives constant returns. Here their certainty equivalent to the expected monetary value is less than the expected value.  36% of the respondents are Risk-Neutral. These investors are indifferent to risk. These investors play safe by diversifying their investments into both risky and non-risky assets. Their certainty equivalent to the expected monetary value is equal to the expected value. Q10. Which would you prefer? TABLE 3.13: Low Return with Low 11 22% Risk Moderate Return with 25 50% Moderate Risk High Return with High 14 28% Risk
  • 61.
    61 | Pa g e CHART 3.11: Interpretation:  50% of the respondents prefer moderate return with moderate risk. These investors are risk neutral investors because they take moderate risk by investing into both equities and debt and other fixed income securities. By this their money invested is secured and get their principal amount back with moderate returns.  28% of the respondents prefer high return with high risk. These investors are risk takers as they largely invest into risky assets in the hope that they maximize their returns.
  • 62.
    62 | Pa g e DATA ANALYSIS As per the primary data collected through questionnaire and its interpretation we found that most of the investors want their money to be safe as their first priority. Thus these investors want be get their money back first then would go for maximizing their returns. Also from the interpretations, most of the investors prefer moderate return with moderate risk thus showing that they diversify their investments into balanced funds like equities as well as bonds and other fixed income securities. By this their investment remains safe and get moderate returns. From the above analysis, we found out that “Most of the investors don’t prefer return as their investment criteria rather go for either risk or liquidity or safety of principal etc.”
  • 63.
    63 | Pa g e CONCLUSIONS From the above study we can conclude that,  Most of them feel that Indian economy is doing good in spite of the economic hit recession.  64% of the respondents are aware of the investment options available today. This shows that remaining number of respondents are not aware and not well educated about the investment options.  Out of 36% (18) who are not aware of investment options, 65% of them take help of investment advisor. This shows most of them are concern of their investment but remaining 35% out of 18 are ignorant of their investments and are least bothered to get educated.  Most of the respondents (38%) investment objective is to create wealth. This shows most of them invest only for wealth creation by investing in for a longer period  32% of the respondents prefer safety of principal as 1st priority as their investment criteria. This shows that the money invested by them has to be safe and their 1st motto is to get back the money invested then would go for maximizing their returns.  74% of the respondents review their portfolio. This shows that most of the investors are concern about their investments and like to keep track of the market conditions and its volatility.  Most of the respondents review their portfolio quarterly but still there are 22% of these investors who don’t know to review their portfolio and are least bothered.  Most of the respondents (46%) prefer balanced type of portfolio. These investors rather play safe by not taking too much of risk but at the same time they prefer to Risk-neutral. They like to diversify their investments into stock, bonds, fixed deposits etc  As these investors prefer balanced type, 66% of these investors invest 30-60% into equities. This clearly shows most of them are aware of the market conditions and want their money invested to be safe.  Most of the respondents (54%) invest in a time horizon of 1-3 years. This shows that they tend to tilt their portfolio according to the market conditions and portfolio
  • 64.
    64 | Pa g e performance. If there is any loss in shorter time horizon, they would try to compensate their wealth loss in a longer horizon.  44% of the respondents are risk takers. This shows that most of them have the tendency to take risk and rather invest into risky assets. There are also 36% of the respondents who are risk neutral. So most of the investors lie in between taking too much of risk and taking some amount of risk.  30% of the respondents allow their existing portfolio to continue. These investors want to invest into the same portfolio for a longer period so as to maximize their returns and also to offset for any loss in shorter period. By this their money invested is safe and almost get their expected returns.  50% of the respondents prefer moderate return with moderate risk. This shows that half of the respondents don’t take much of a risk by investing into risky assets but rather diversify their investments into both risky as well as non-risky assets. So far in India, most of the middle class earners have been risk-averse and therefore park most of their savings in Fixed Deposits and Other Savings Accounts, though the yield from such investment avenues is very low. However, the recent trend has been such that more people have been attracted towards investment in Mutual Funds and Equities. It is in this light that Portfolio Management Companies have been gaining prominence in India. The trend is only set to go upwards in the years to come, as the Indian middle class becomes more risk friendly.
  • 65.
    65 | Pa g e RECOMMENDATIONS We expect that following these recommendations could result in higher abnormal return for the investors:  The investors should have a clear understanding of their investment objectives, tax status and risk tolerances. Only by this the portfolio managers can offer suitable advice or construct appropriate portfolios.  Investment must be with reputed organization. Before investment we should be aware of the standards of the company where we want to invest. Standards of the company means, balance sheet, size, management capability etc. of the company must be excellent  The investment should be carefully done for the previous performance, present market status and future risk properly assessed for better results  Equity should be invested in such a manner that assured return must be guaranteed by regularly watching the market volatility to avoid higher risk.  Where compatible with investor’s objectives we recommend investing in equities on a long-term basis. The reason is that equities tend to offer better returns than alternative investment classes over periods of ten years or more. Although equity prices may be volatile on a day-to-day basis the effects of this are reduced over time if prices are on a rising trend. The effects of volatility are also reduced by holding a portfolio of equities with an appropriate spread of exposures to different sectors and/or countries.  Not all clients can accept the risk of being fully invested in equities and others may require higher levels of income than can be prudently achieved from a pure equity portfolio. In these cases, we will recommend investors setting aside a part of the portfolio for investment in fixed income stocks (bonds)  While managing the investment portfolio, it is important to remember that the riskier strategic investments should always be balanced with more conservative investments. The investment mix should be constantly monitored to assess which investments are on track, and which are the ones that need help and which are the ones that need to be shut down  A huge market downturn: A simpler way to deal is to re-balance the portfolio to whatever the target equity weight is, trimming stocks and adding to fixed income or
  • 66.
    66 | Pa g e money market. This is a good discipline to get into on a regular basis and helps buffer the portfolio against the inevitable volatility we see in equity markets.  Most people need a balance of stocks and bonds in their portfolio, so the question is how much of each. If they are worried about inflation, we would look at using some of the RRB's (Real Return Bonds), high quality corporate bonds to increase the yield and reduce susceptibility to any increases in interest rates and keep their term relatively short. Overall, we believe the risk: reward relationship favours stocks over bonds at this point, so we are overweight stocks and underweight bonds.
  • 67.
    67 | Pa g e Bibliography 1.Stock Investing For Dummies by Paul J. Mladjenovic 2.The Intelligent Investor: The Definitive Book on Value Investing. by Benjamin Graham, Jason Zweig and Warren E. Buffett 3.Managing Investment Portfolios: A Dynamic Process (CFA Institute Investment Series) by John L. 4.Investment Analysis and Portfolio Management (with Thomson ONE - Business School Edition) by Frank K. 5.Indian Stock Market by Bishnupriya Mishra and Sathya Swaroop Debasish 6. www.moneycontrol.com 7. www.nseindia.com 8. www.bseindia.com 9. www.sebi.gov.in 10. http://en.wikipedia.org/wiki/Securities_and_Exchange_Board_of_India