Download to read offline

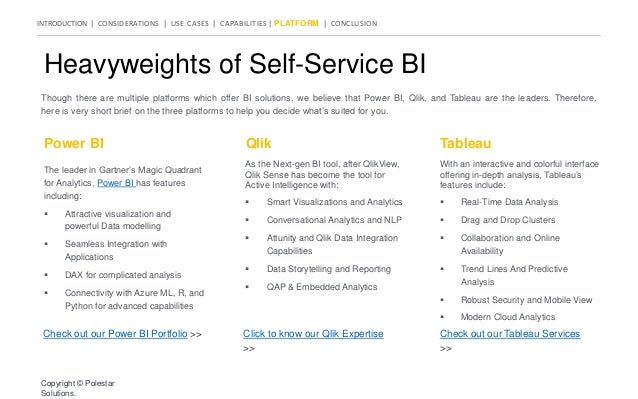
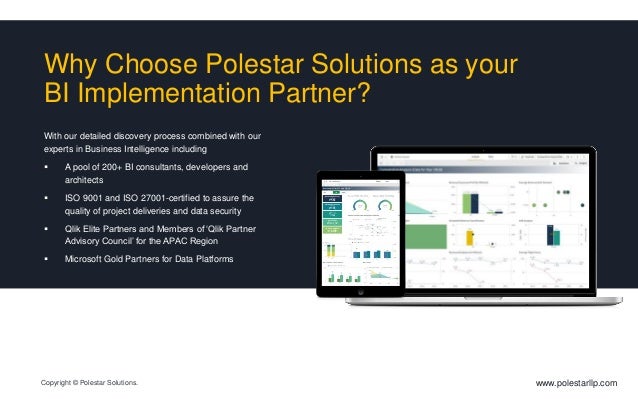

The document outlines critical considerations for selecting a modern Business Intelligence (BI) tool that can handle the complexities of today's data landscape, emphasizing the need for advanced capabilities such as real-time analytics, AI integrations, and user accessibility. It provides a comprehensive analysis of various use cases, platform capabilities, and costs associated with BI tools, encouraging businesses to adopt data-driven decision-making. Additionally, it highlights top BI platforms like Power BI, Qlik, and Tableau, and positions Polestar Solutions as a valuable partner for BI implementation.


![7.__Developing_a_Research_Proposal[1].pptx](https://cdn.slidesharecdn.com/ss_thumbnails/7-260131073037-df92dd7d-thumbnail.jpg?width=640&height=640&fit=bounds)


![제 23회 보아즈(BOAZ) 빅데이터 컨퍼런스 - [MBOAX] : ABSA를 활용한 소비자 반응 분석 기반 운영 효율화 대시보드 설계](https://cdn.slidesharecdn.com/ss_thumbnails/3-1boaz23rdconferencemboax-260203102709-9d519923-thumbnail.jpg?width=640&height=640&fit=bounds)


