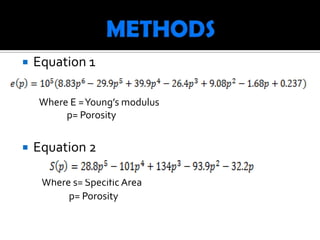
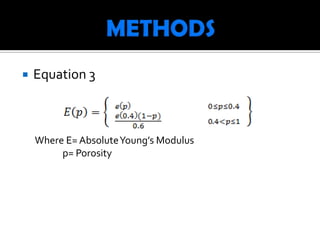
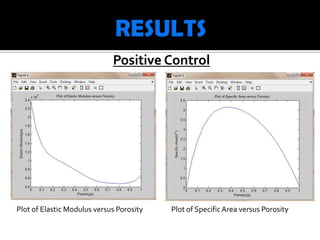
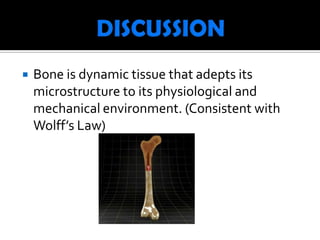
Chun Hoe Ong
 11/12/2012
  BIEN 430
   Mechanical damage fatigue dynamics
    coupled with bone cell activities in creating
    bone remodeling models.

What is being modeled?
 The modulus of elasticity as a function of
  porosity

What is being changed?
 Porosity Function
   Matlab
     Matlab: used as the primary means of recreating
     the positive control model.

   Microsoft Excel
     Excel: used to validate Matlab’s plots and to
     recreate equations.
   Equation 1

    Where E = Young’s modulus
         p= Porosity


   Equation 2

     Where s= Specific Area
          p= Porosity
   Equation 3


    Where E= Absolute Young’s Modulus
         p= Porosity
Positive Control


Plot of Elastic Modulus versus Porosity   Plot of Specific Area versus Porosity
Physiological Change of Positive
    Control


Graph of E(p) versus Specific Area   Graph of E(p) versus Specific Area
(0<p<0.4)                            (0.4<p<1)
   Bone is dynamic tissue that adepts its
    microstructure to its physiological and
    mechanical environment. (Consistent with
    Wolff’s Law)
   The original model allows us to determine the
    optimal porosity to obtain the maximum
    elastic modulus.

   Can be used to study long-term effects of
    mechanical damage on bone recovery.

   Provides a method of predicting when a bone
    might fracture.
 Can be used in combination of finite element
  code to asses strategies for knee
  replacement.
Significance of New Model
 Provides a more accurate method of
  analyzing bone fractures
 Demonstrates the effects of change in
  specific area on the elastic modulus of bone.
 Allows for a better prediction of bone
  recovery rate
Unexpected Results
 The modulus of elasticity began to increase
  as the surface area increased beyond 2.6m-1
  for porosity> 0.4

   The exponential increase of the Young’s
    modulus once the surface area increased
    beyond 2.6m-1 for porosity> 0.4
Biomechanical bone remodeling

Biomechanical bone remodeling

  • 1.
    Chun Hoe Ong 11/12/2012 BIEN 430
  • 2.
    Mechanical damage fatigue dynamics coupled with bone cell activities in creating bone remodeling models. What is being modeled?  The modulus of elasticity as a function of porosity What is being changed?  Porosity Function
  • 3.
    Matlab  Matlab: used as the primary means of recreating the positive control model.  Microsoft Excel  Excel: used to validate Matlab’s plots and to recreate equations.
  • 4.
    Equation 1 Where E = Young’s modulus p= Porosity  Equation 2 Where s= Specific Area p= Porosity
  • 5.
    Equation 3 Where E= Absolute Young’s Modulus p= Porosity
  • 6.
    Positive Control Plot ofElastic Modulus versus Porosity Plot of Specific Area versus Porosity
  • 7.
    Physiological Change ofPositive Control Graph of E(p) versus Specific Area Graph of E(p) versus Specific Area (0<p<0.4) (0.4<p<1)
  • 8.
    Bone is dynamic tissue that adepts its microstructure to its physiological and mechanical environment. (Consistent with Wolff’s Law)
  • 9.
    The original model allows us to determine the optimal porosity to obtain the maximum elastic modulus.  Can be used to study long-term effects of mechanical damage on bone recovery.  Provides a method of predicting when a bone might fracture.
  • 10.
     Can beused in combination of finite element code to asses strategies for knee replacement. Significance of New Model  Provides a more accurate method of analyzing bone fractures  Demonstrates the effects of change in specific area on the elastic modulus of bone.  Allows for a better prediction of bone recovery rate
  • 11.
    Unexpected Results  Themodulus of elasticity began to increase as the surface area increased beyond 2.6m-1 for porosity> 0.4  The exponential increase of the Young’s modulus once the surface area increased beyond 2.6m-1 for porosity> 0.4

Editor's Notes

  • #3 1)The original article proposes that the mechanical damage fatigue dynamics be coupled with bone cell activities in creating bone remodeling models.2) For this project, the modulus of elasticity as a function of surface area is being modeled.
  • #5 Both polynomial equations were obtained from experimental data.Porosity is from 0-1, where 0 is completely solid and 1 is completely hollow