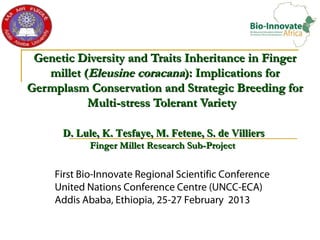
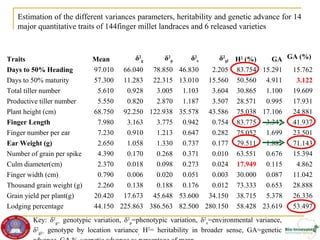
Genetic diversity and traits inheritance in finger millet (Eleusine coracana): Implications for germplasm conservation and strategic breeding for multi-stress tolerant variety
Presented by D. Lule, K. Tesfaye, M. Fetene, S. de Villiers (Finger Millet Research Sub-Project) at the First Bio-Innovate Regional Scientific Conference, Addis Ababa, Ethiopia, 25-27 February 2013
2024: Domino Containers - The Next Step. News from the Domino Container commu...
Genetic diversity and traits inheritance in finger millet (Eleusine coracana): Implications for germplasm conservation and strategic breeding for multi-stress tolerant variety
1. Genetic Diversity and Traits Inheritance in Finger
millet (Eleusine coracana): Implications for
Germplasm Conservation and Strategic Breeding for
Multi-stress Tolerant Variety
D. Lule, K. Tesfaye, M. Fetene, S. de Villiers
Finger Millet Research Sub-Project
First Bio-Innovate Regional Scientific Conference
United Nations Conference Centre (UNCC-ECA)
Addis Ababa, Ethiopia, 25-27 February 2013
2. I. Introduction
Cultivated in the tropical & sub-tropical regions of Africa & India;
Widely cultivated in Northern, NW, and Western Ethiopia;
It is the 6th most important cereal crop both in area & production;
It constitutes 10-20% of total cereal production in some regions;
Can produce better yield than other crops under multiple stress &
marginal soil;
Has high nutritional value & excellent storage qualities;
Area coverage in the major regions (2009-11)
Area coverage &production (1999-11)
3. Introduction .…
Despite is importance as food security crop, its
productivity is suffering from both biotic & abiotic
stresses => needs intervention to improve its
productivity;
Improvement in any crop usually involves;
Exploiting the genetic variability in specific traits;
Nature & degree of association between traits;
Inheritance & genetic transmissibility;
Limited/insufficient data base for finger millet;
Therefore, the current study was initiated to
supplement such pressing needs
4. II. Objectives
Set-I
To assess the extent & pattern of genetic
diversity of finger millet germplasms on the
basis of phenotypic traits;
To estimate the genetic parameters; heritability
& genetic advance for quantitative traits.
5. III. Materials & Methods No. Country/Region Total
1 Amhara 33
Morphological characterization of finger 2 Oromia 33
millet genotypes was conducted at:- 3 Tigray 27
Arsi Negele in the central Rift Valley 4 B/Gumuz 7
Gute in the western Ethiopia 5 SNNP 6
6 Eritrea 8
150 germplasm planted in RCBD with 2 7 Zimbabwe 13
repl. 8 Kenya 7
9 Zambia 10
Sub total 144
6 Qualitative Traits
(growth habit, ear shape, ear (glumes) color, grain coverage Released Varieties 6
by glumes; spikelet density and grain color was collected Grand total 150
following finger millet descriptors (IBPGR, 1985).
14 Quantitative Morphological (days to 50% to
TGW)
6. IV. Data Analysis
Qualitative traits
◘ The percentage freq. distribution of each
phenotypic class (using excel computer) program.
◘ Hierarchal clustering of standardized data (using
MINITAB) software
◘ The amount of genetic variation was determined
using the Shannon-Weaver diversity index as
described by Jain et al. (1975)
Quantitative traits
Analysis of variance computed using Agrobase
software;
Cluster analysis Using SAS software;
Broad sense heritability (H2) & Genetic advance
computed following the standard formula
7. V. Result & Discussion
Qualitative traits
Relatively higher Shannon diversity for:-
●Growth habit was observed for Eritrea &
Ethiopian (Tigray) materials;
● Ear Shape & Grain Color for Kenyan’s;
● Grain covering by glumes & spikelet
density for Ethiopian (Oromia & SNNP
region);
The pooled mean diversity indices for the
six traits showed comparatively higher
Shannon diversity for Kenyan collection
followed Benishangul Gumuz & Oromia
region of Ethiopia.
8. Table _Shannon-Weaver diversity indices (H’) of finger millet accessions collected from
5 regions of Ethiopia and 4 East & South east African countries for 6 qualitative traits
Qualitative characters
Country/region GH ESH EC GCG SPD SC Mean ± SE
Amhara/Ethiopia 0.426 0.245 0.212 0.239 0.238 0.312 0.279 ± 0.033
B/Gumuz/Ethiopia 0.427 0.253 0.159 0.260 0.338 0.377 0.302 ± 0.040
Oromia/Ethiopia 0.329 0.246 0.255 0.335 0.299 0.296 0.294 ± 0.015
SNNP/Ethiopia 0.391 0.279 0.194 0.236 0.289 0.326 0.286 ± 0.043
Tigray/Ethiopia 0.423 0.277 0.157 0.238 0.288 0.325 0.284 ± 0.033
Eritrea 0.458 0.305 0.055 0.111 0.243 0.243 0.236 ± 0.060
Kenya 0.317 0.345 0.291 0.234 0.330 0.403 0.320 ± 0.024
Zambia 0.325 0.297 0.182 0.284 0.312 0.337 0.289+ 0.240
Zimbabwe 0.302 0.293 0.282 0.264 0.283 0.353 0.287 ± 0.012
Mean 0.377 0.282 0.199 0.244 0.291 0.330 0.287±0.045
GH= growth habit, ESH= ear shape, EC=Ear/glumes color, GCG=Grain covering by
glumes, SPD=Spikelet density, SC=seed color
9. Clustering Analysis
Based on regional data, 3 clusters groups were formed.
◘ All the five administrative regions of Ethiopia & Eritrea grouped together
◘ Kenya, Zambia and Zimbabwe grouped in the second cluster
◘ All released varieties share minimum percentage similarity & with finger millet
accessions of all countries & regions.
Fig 2 Similarities for F. millet landraces among regions of Ethiopia, African countries & released varieties evaluated for 6 qualitative traits
40.91
60.60
S ilarity
im
80.30
100.00
) ) ) ) ) 5) 3) 1) 6) 2)
th th th ria th th ya
bw
e
bi
a
(V
4
(E (E (E r it (E (E en m (V (V (V (V (V
a y uz
E ia P K ba Za da et se e a a
ar ra m m NN im re ad es Gut am ney
h ig o Z
Am T Gu
O
r S Be P
Ta
d W Bo
B/
Adminstrative regions of Ethiopia (Eth), released varieties (V1-V6) and other countries
10. Quantitative traits
Analysis of variance for quantitative traits
The combined analysis of variance across locations showed
significant location effects for all quantitative traits.
The genotype mean squares were also significant (P≤0.01) for
all quantitative traits except ear weight.
Genotype by environment mean square was highly significant
(P≤0.01) for most of the traits considered, indicating that the
variation among genotypes for grain yield is more of due to
genetic factor than environmental.
11. Mean squares for 14 quantitative traits of 144 finger millet landraces and 6 released varieties as
obtained from combined ANOVA of the two locations (Gute & Arsi Negele)
Source of
df DH DM TTN PTN PLHT FL FN
variation
Location 1 4066.4** 11102.61** 3199.8** 3087.2** 47638.2** 28.12** 36.66**
Genotype 149 315.4** 89.26** 12.02** 11.48** 491.75** 15.1** 4.85**
GxE 149 51.24 44.13** 8.31** 8.20** 122.75** 2.45** 1.21**
Error 298 46.83 13.01 1.10 1.19 35.58 0.94 0.65
CV (%) 7.05 2.29 18.72 19.55 8.68 12.12 11.09
LSD (5%) 7.98 4.21 1.23 1.27 6.95 1.13 0.94
Mean 97.01 157.73 5.61 5.55 68.75 7.98 7.23
S source of variation df EW NGPS CD FW TGW GYPLN LOG
Location 1 72.45** 134.6** 2129.8** 13.23** 0.02 28912.1** 228150**
Genotype 149 5.32* 1.07** 0.389** 0.08** 0.754** 182.79** 1546.25**
GxE 149 1.09** 0.34 0.32 0.05 0.20 111.90 642.79**
Error 298 0.74 0.37 0.27 0.05 0.17 53.61 82.50
CV (%) 32.44 12.21 22.01 28.72 18.52 35.85 20.57
LSD (5%) 1.00 0.71 0.61 0.26 0.49 8.54 10.59
Mean 2.65 4.39 2.37 0.79 2.26 20.42 44.15
KEY: TTN=Total tiller number, PTN= productive tiller number, FL= finger length, FN= finger number, EW=ear width,
NGPS=number of grain per spikelet, CD=culm diameter, EW= finger weight, GYPLN=grain yield per plant, LOG= lodging
index
12. The result for cluster analysis indicated that neighboring regions, &
countries shared strong similarity
The genetic relatedness of 144 F. millet landraces for 14 quantitative traits among regions
and countries of origin and six released varieties
Fig. 2 T he genetic relatedness of 144 F. millet landraces for 17 quantitative traits among regions & countries of origin & 6 released varieties
46.35
64.23
Similarit y
82.12
100.00
) ) a ) ) ) a e a ) ) ) ) ) )
(E
th
(E
th
it r e (Et h ( Et h a ( v eny bw
m
bi
(E
th
a
(v t (v
e
(v (v (v
y Er z ed K ba Za ey de Gut se a
r a a u ia r m N P n a es am
ha gr um
m Be Zi SN Bo
P d W
Am Ti /G O
ro Ta
B
Regions and count r ies of or igin, and r eleased v ar iet ies ( v )
13. Estimation of the different variances parameters, heritability and genetic advance for 14
major quantitative traits of 144finger millet landraces and 6 released varieties
Traits Mean δ2g δ2p δ2e δ2gl H2 (%) GA GA (%)
Days to 50% Heading 97.010 66.040 78.850 46.830 2.205 83.754 15.291 15.762
Days to 50% maturity 57.300 11.283 22.315 13.010 15.560 50.560 4.911 3.122
Total tiller number 5.610 0.928 3.005 1.103 3.604 30.865 1.100 19.609
Productive tiller number 5.550 0.820 2.870 1.187 3.507 28.571 0.995 17.931
Plant height (cm) 68.750 92.250 122.938 35.578 43.586 75.038 17.106 24.881
Finger Length 7.980 3.163 3.775 0.942 0.754 83.775 3.347 41.937
Finger number per ear 7.230 0.910 1.213 0.647 0.282 75.052 1.699 23.501
Ear Weight (g) 2.650 1.058 1.330 0.737 0.177 79.511 1.885 71.143
Number of grain per spike 4.390 0.170 0.268 0.371 0.010 63.551 0.676 15.394
Culm diameter(cm) 2.370 0.018 0.098 0.273 0.024 17.949 0.115 4.862
Finger width (cm) 0.790 0.006 0.020 0.051 0.003 30.000 0.087 11.042
Thousand grain weight (g) 2.260 0.138 0.188 0.176 0.012 73.333 0.653 28.888
Grain yield per plant(g) 20.420 17.673 45.648 53.600 34.150 38.715 5.378 26.336
Lodging percentage 44.150 225.863 386.563 82.500 280.150 58.428 23.619 53.497
Key: δ2g= genotypic variation, δ2p=phenotypic variation, δ2e=environmental variance,
δ2gl= genotype by location variance, H2= heritability in broader sense, GA=genetic
14. VI. Screening finger millet genotypes for blast
disease
Objective-Set-II
To screen blast tolerant genotypes for further
utilization in breeding program & yield trials.
15. No Region/country
VII. Materials and Methods 1
Sub total
Oromia 65
Treatment No. 225 (including 150 from 2 Amhara 53
Set-I experiment) 3 Tigray 46
4 B/Gumuz
Design: Simple Lattice 15
5 SNNP 7
Experimental Location: Bako ARC 6 Eritrea 3
Checks: Eight improved varieties 7 Kenya 5
8 Zambia 9
Pathogen source:- Artificial inoculation by 9 Zimbabwe 14
developing the inoculums collected from Sub total 217
susceptible genotypes & developed in lab. Released Varieties 8
Grand total 225
Susceptible genotype was planted as spreader
row.
16. VIII. Data Collection & Analysis
10 plants were randomly selected/row for data colle;
Blast severity (1-9), Incidence (%), Lesion length
(cm), along with other yield parameters were
recorded;
Disease assessment was be made every 2 weeks;
Severity score for Leaf, Sheath & Head blast
recorded from 10-selected plants were converted to
disease index/severity index following standard
formula later to calculate the Area Under Disease
Progress Curve (AUDPC) of the subsequent
recording period.
17. VII. Result and Discussion
Analysis of variance
Mean squares due to genotypes were highly
significant (P≤0.01) for
◊ Leaf blast AUDPC & head blast AUDPC;
◊ Neck blast incidence & lesion length;
◊ Grain yield per plant;
18. Result and discussion …….
Mean squares for blast incidence and severity recorded at different assessment period from different
plant parts and grain yield per plant.
Leaf blast incidence -days after planting (DAP) Head blast incidence- (DAP)
Source of df
variation 88 102 117 132 147 102 117 132 147
BLOCK 1 4795.5** 23995.** 5760.2** 24053.5** 364.5** 624.22 22022.01** 893.24 338.0**
Genotype 224 277.71** 881.32** 637.46* 440.38** 67.36** 2897.1** 1480.49** 1059.1* 58.93
Error 224 159.143 434.52 291.14 174.6 24.1 1009.04 624.66 792.5 48.71
CV (%) 29.03 25.59 24.81 16.83 5.15 38.56 31.61 33.11 7.07
LSD (0.05) 19.71 33.44 26.01 21.19 8 52.34 38.31 41.16 11.48
R-squ(%) 74.97 76.4 78.9 81.34 79.3 78 81 65 62.5
Mean 13.22 56.88 63.91 76.86 93.92 45.31 73.33 89.77 98.33
RE (%) 111.9 106.1 115.8 106.1 102.8 100.6 116.3 101.6 100.9
20. Result and discussion …….
The trends of infection and disease epidemiology
Wider ranges of variations were observed among finger millet
accessions for leaf blast, sheath blast, neck blast and head blast
infection level.
Maximum range of variation for head and leaf blast incidence
were observed among genotypes at 117 &132 days after
planting.
The variation among accession gets narrower at later recording
period implying that the infection level reaches climax.
21. Result and discussion …….
As head blast is the major factor in causing yield loss, the accessions
under the study were ranked based on head blast AUDPC value and
hence ranges from:-
975%-days for Acc.BKFM0031 collected from western Ethiopia to
4500%-days for 7 finger millet accessions collected from Northern
Ethiopia.
Among the top 20 tolerant accessions for leaf & head blast, 16 of
them gave grain yield above average (11.29 g/plant).
Acc. BKFM0031 is the most tolerant landrace with the least head
blast AUDPC value (975%-days), but gave lower grain yield per
plant (6.78g/plot).
This urges the need to further confirmation for the consistence of its
resistance & utilize as a parental line in crossing program.
24. Infection pattern with respect to regions/countries of origin
Fig 1. Patterns of leaf blast severity index of 217 finger millet
accessions pooled for regions of origin recorded during the different
assessment periods
Leaf blast infection was relatively linear for different countries and regions of origin
25. Fig. Patterns of head blast severity index recorded from 217 finger millet
accessions pooled for regions of origin recorded during the different assessment
periods
• Finger millet accessions
from W & SW parts of
Ethiopia, and some
introduced from Zambia
showed relatively better
tolerance to leaf blast and
head blast during the
whole growing periods.
• Infections were high for
accessions sampled from
Kenya, Eritrea and two
Ethiopian regions (Tigray
and SNNP).
26. VI. Summary and Future Plan
Higher phenotypic and yield related trait variability observed among
finger millet germplasms studied, which worth to apply conventional
and modern biotechnological tools to improve the productivity of finger
millet;
About 64% of the traits considered in the current study have heritability
percentage greater than 50%;
Relatively higher heritability followed by higher genetic advance were
recorded for Ear Weight, Lodging Index, Finger Length, Thousand
Grain Weight & Grain Yield per Plant.
This in turn offers high chances for improving this traits of finger millet
through selection & hybridization.
Finger length (0.33), finger number (0.21), thousand grain weight (0.23) and
tiller number (0.28) has positive & significant (P≤ 0.01) correlation with Grain
Yield per Plant.
27. Summary and Future Plan….
Clustering goes with geographical proximity indicate the
presence of gene flow/seed flow among the local community;
Selection by farmers in favor of similar traits across location;
Seed from the same sources ;
Adaptive role of the traits in similar agro-ecology.
Materials from Western part of Ethiopia should be targeted for
in-depth blast screening and conservation.
From Set-I and Set-II experiments:-
30 genotypes advanced to next level yields trials and later some 15
genotypes will be advance to multi-location yield trials.
More than 35 blast tolerant lines advanced to the next level.
28. ACKNOWLEDGEMENTS
Bio-Innovate Africa
Microbial, Cellular & Molecular Biology-AAU
Bako Agricultural Research Center
Arsi Negele Agricultural Research sub-center
Melkassa Agricultural Research Center
The Institute of Biodiversity Conservation