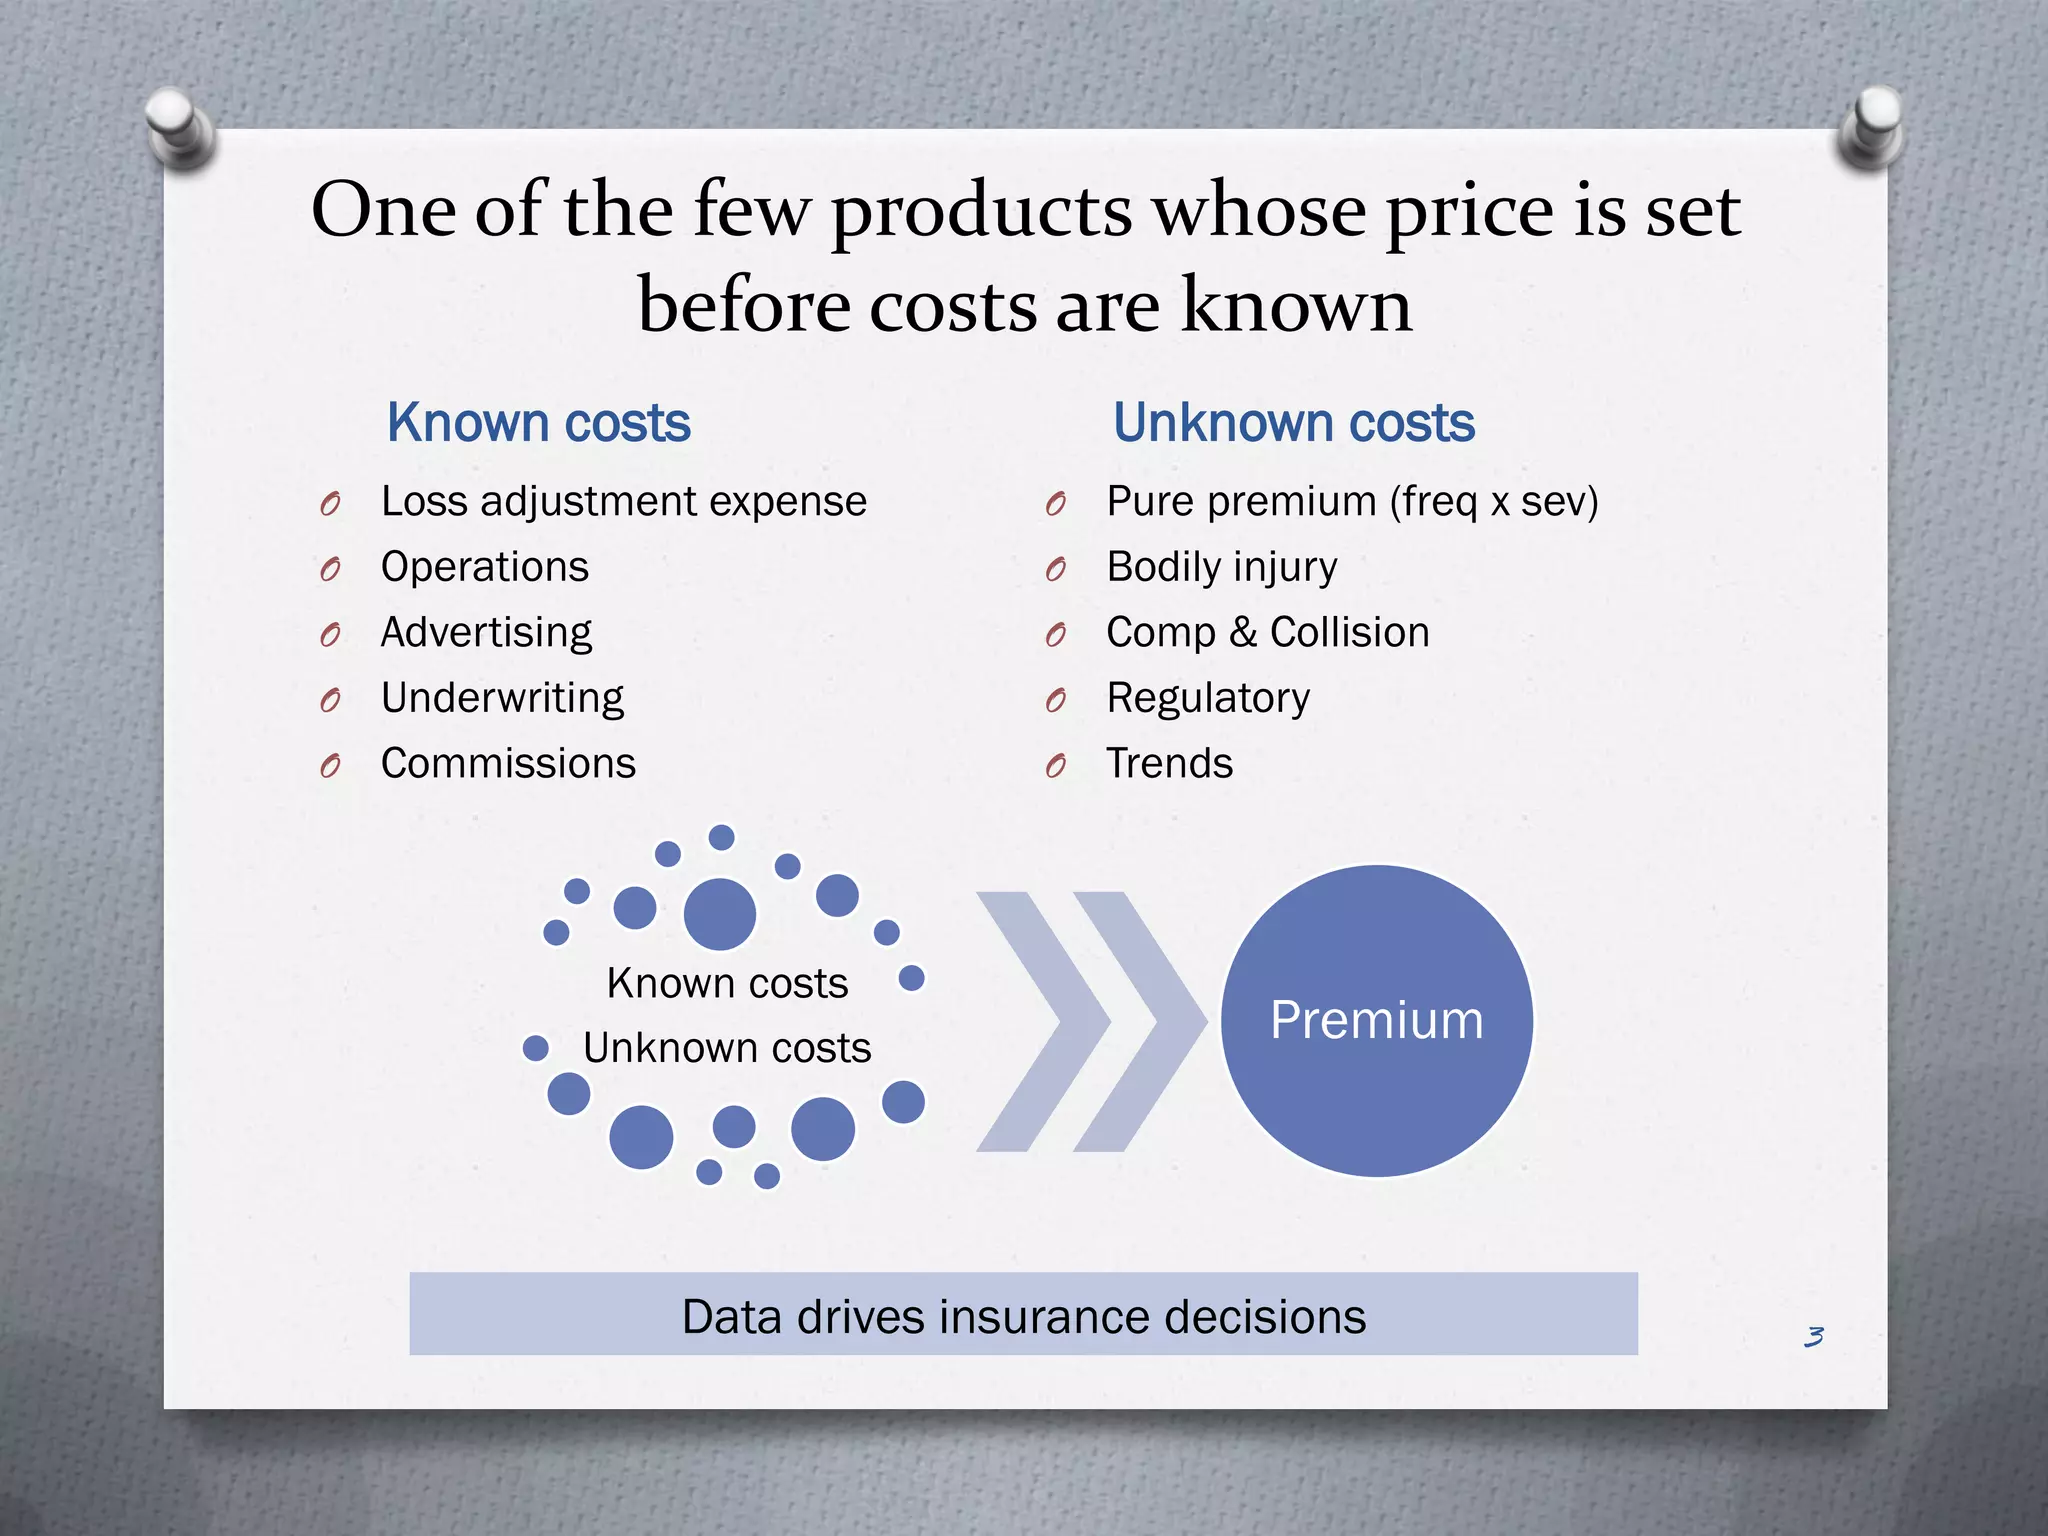
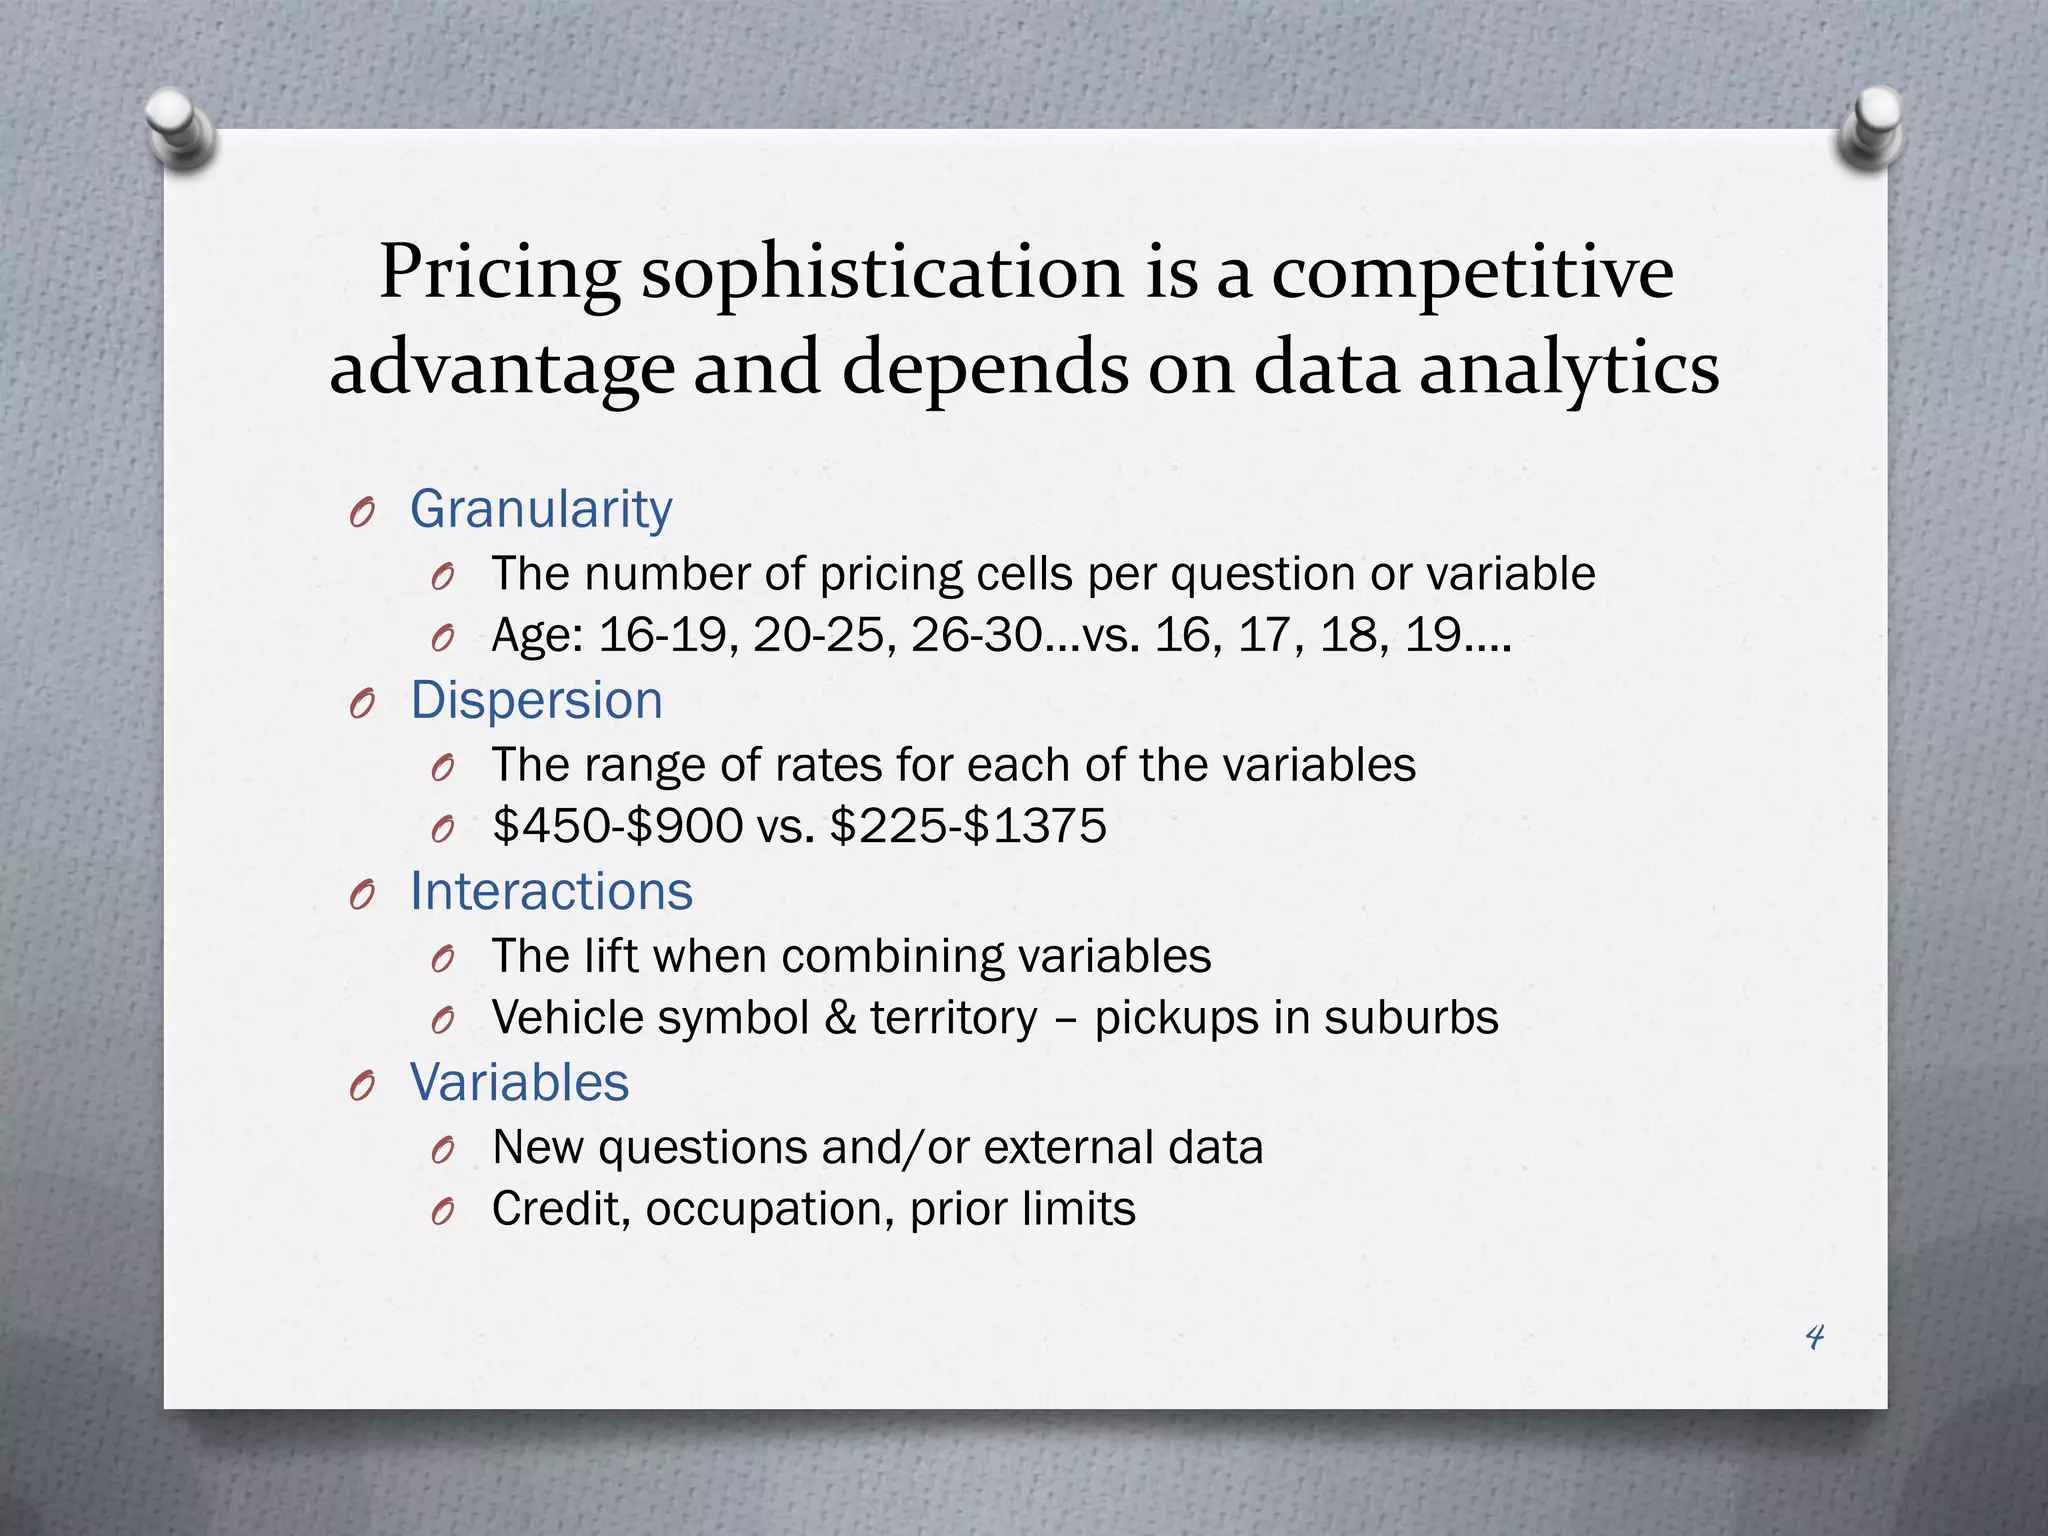
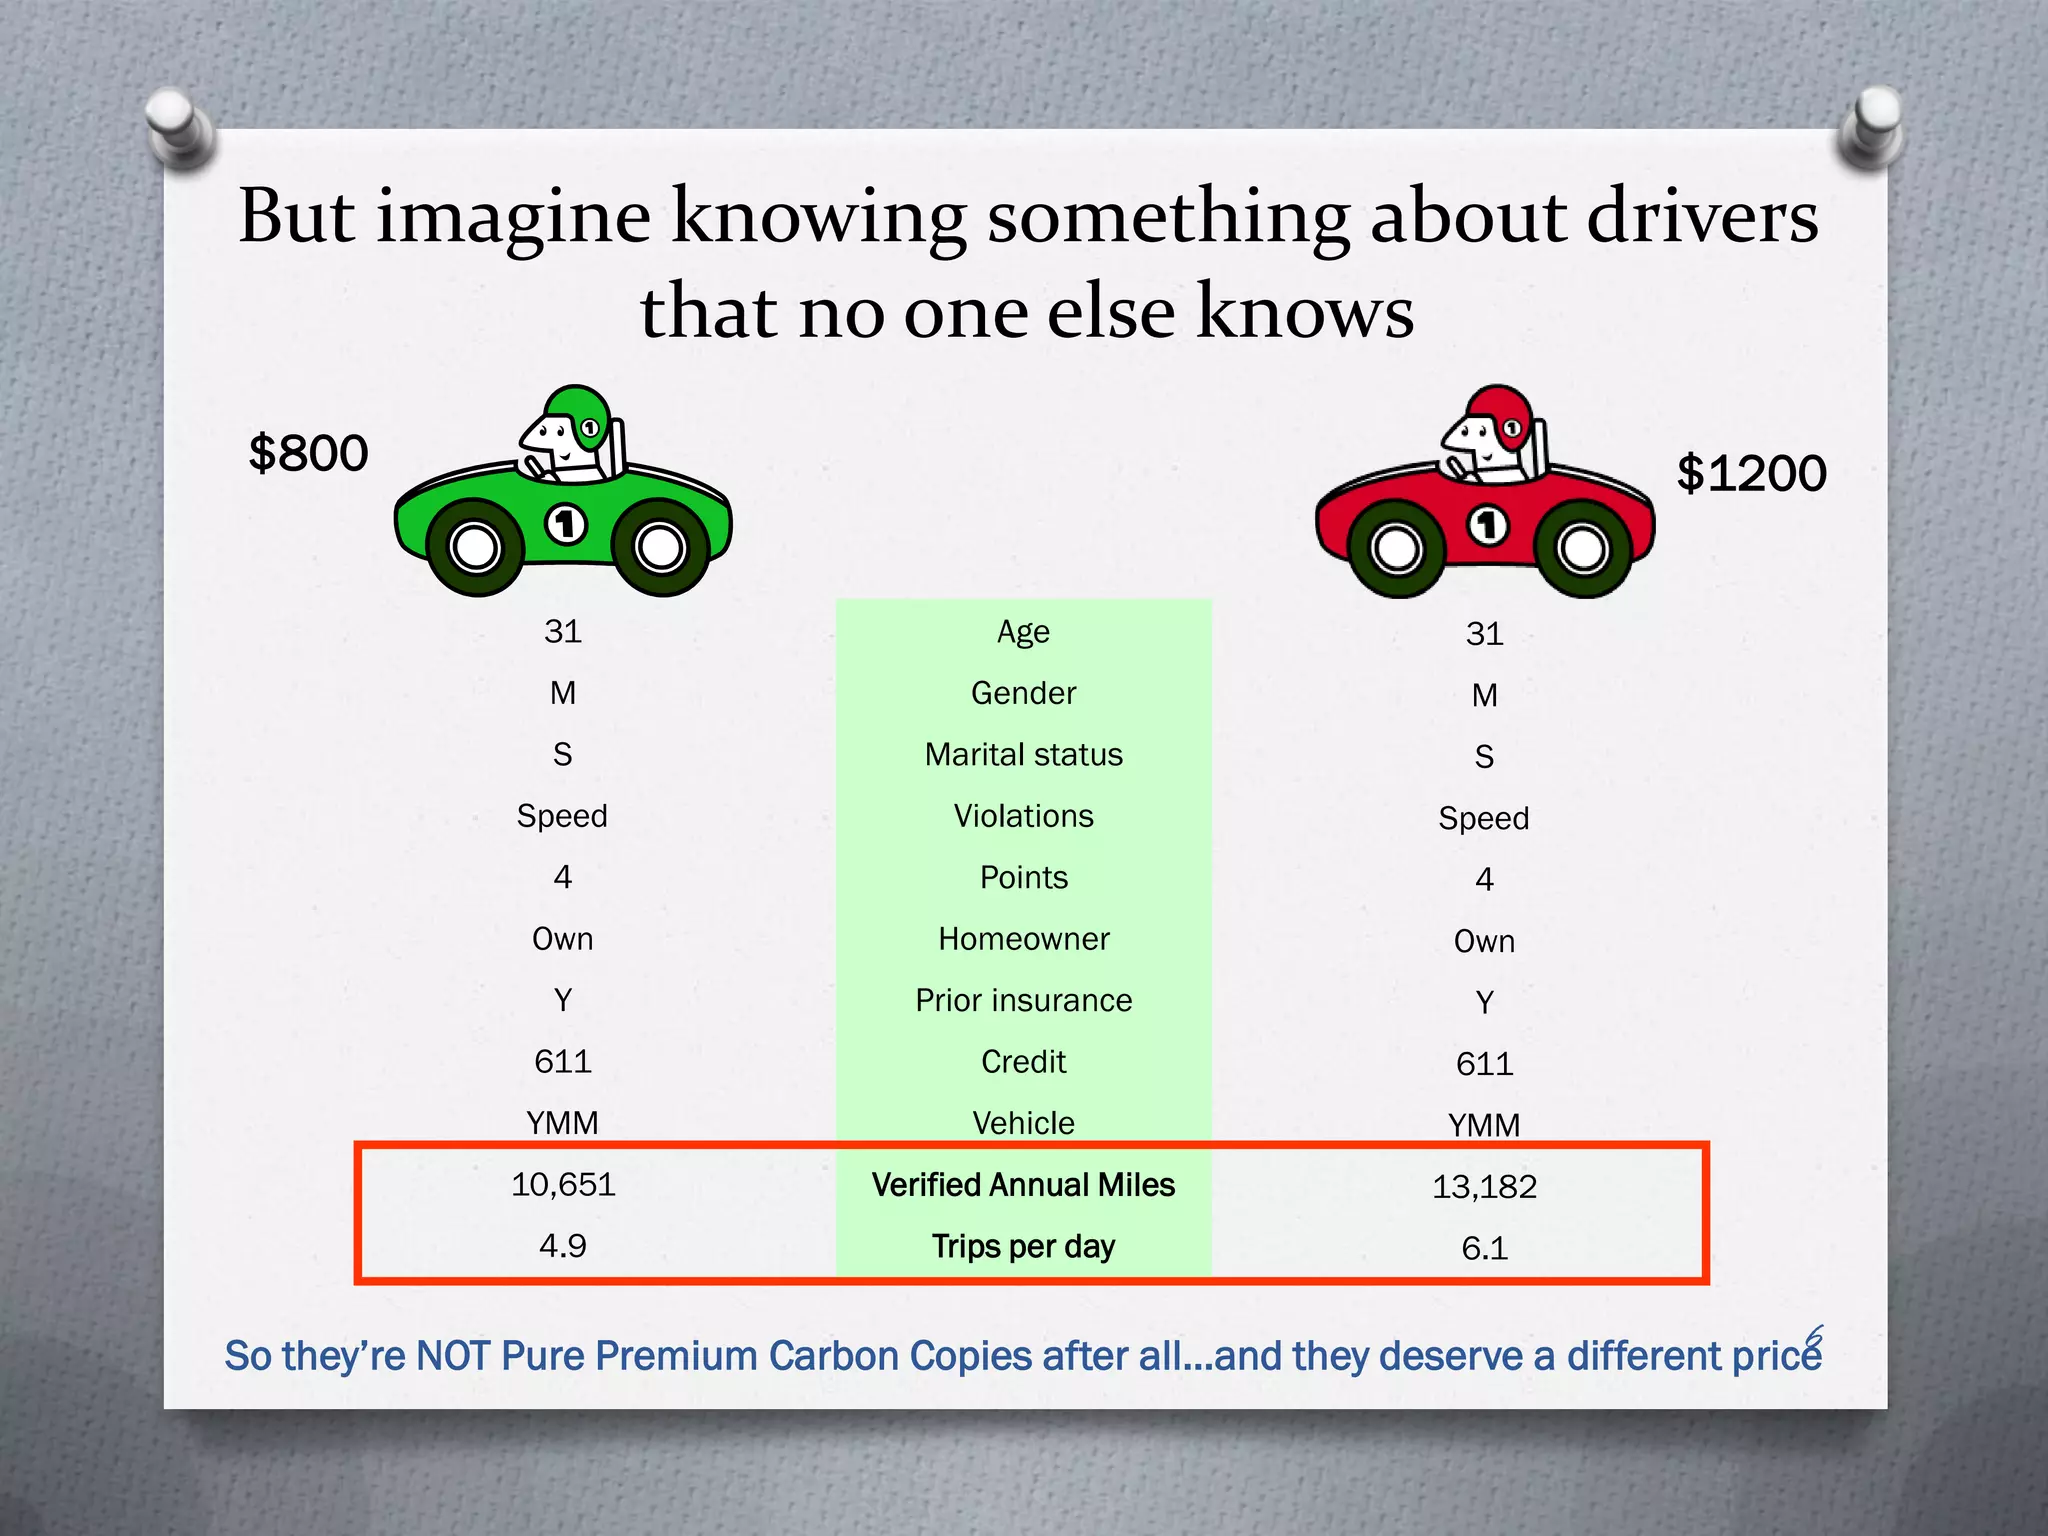
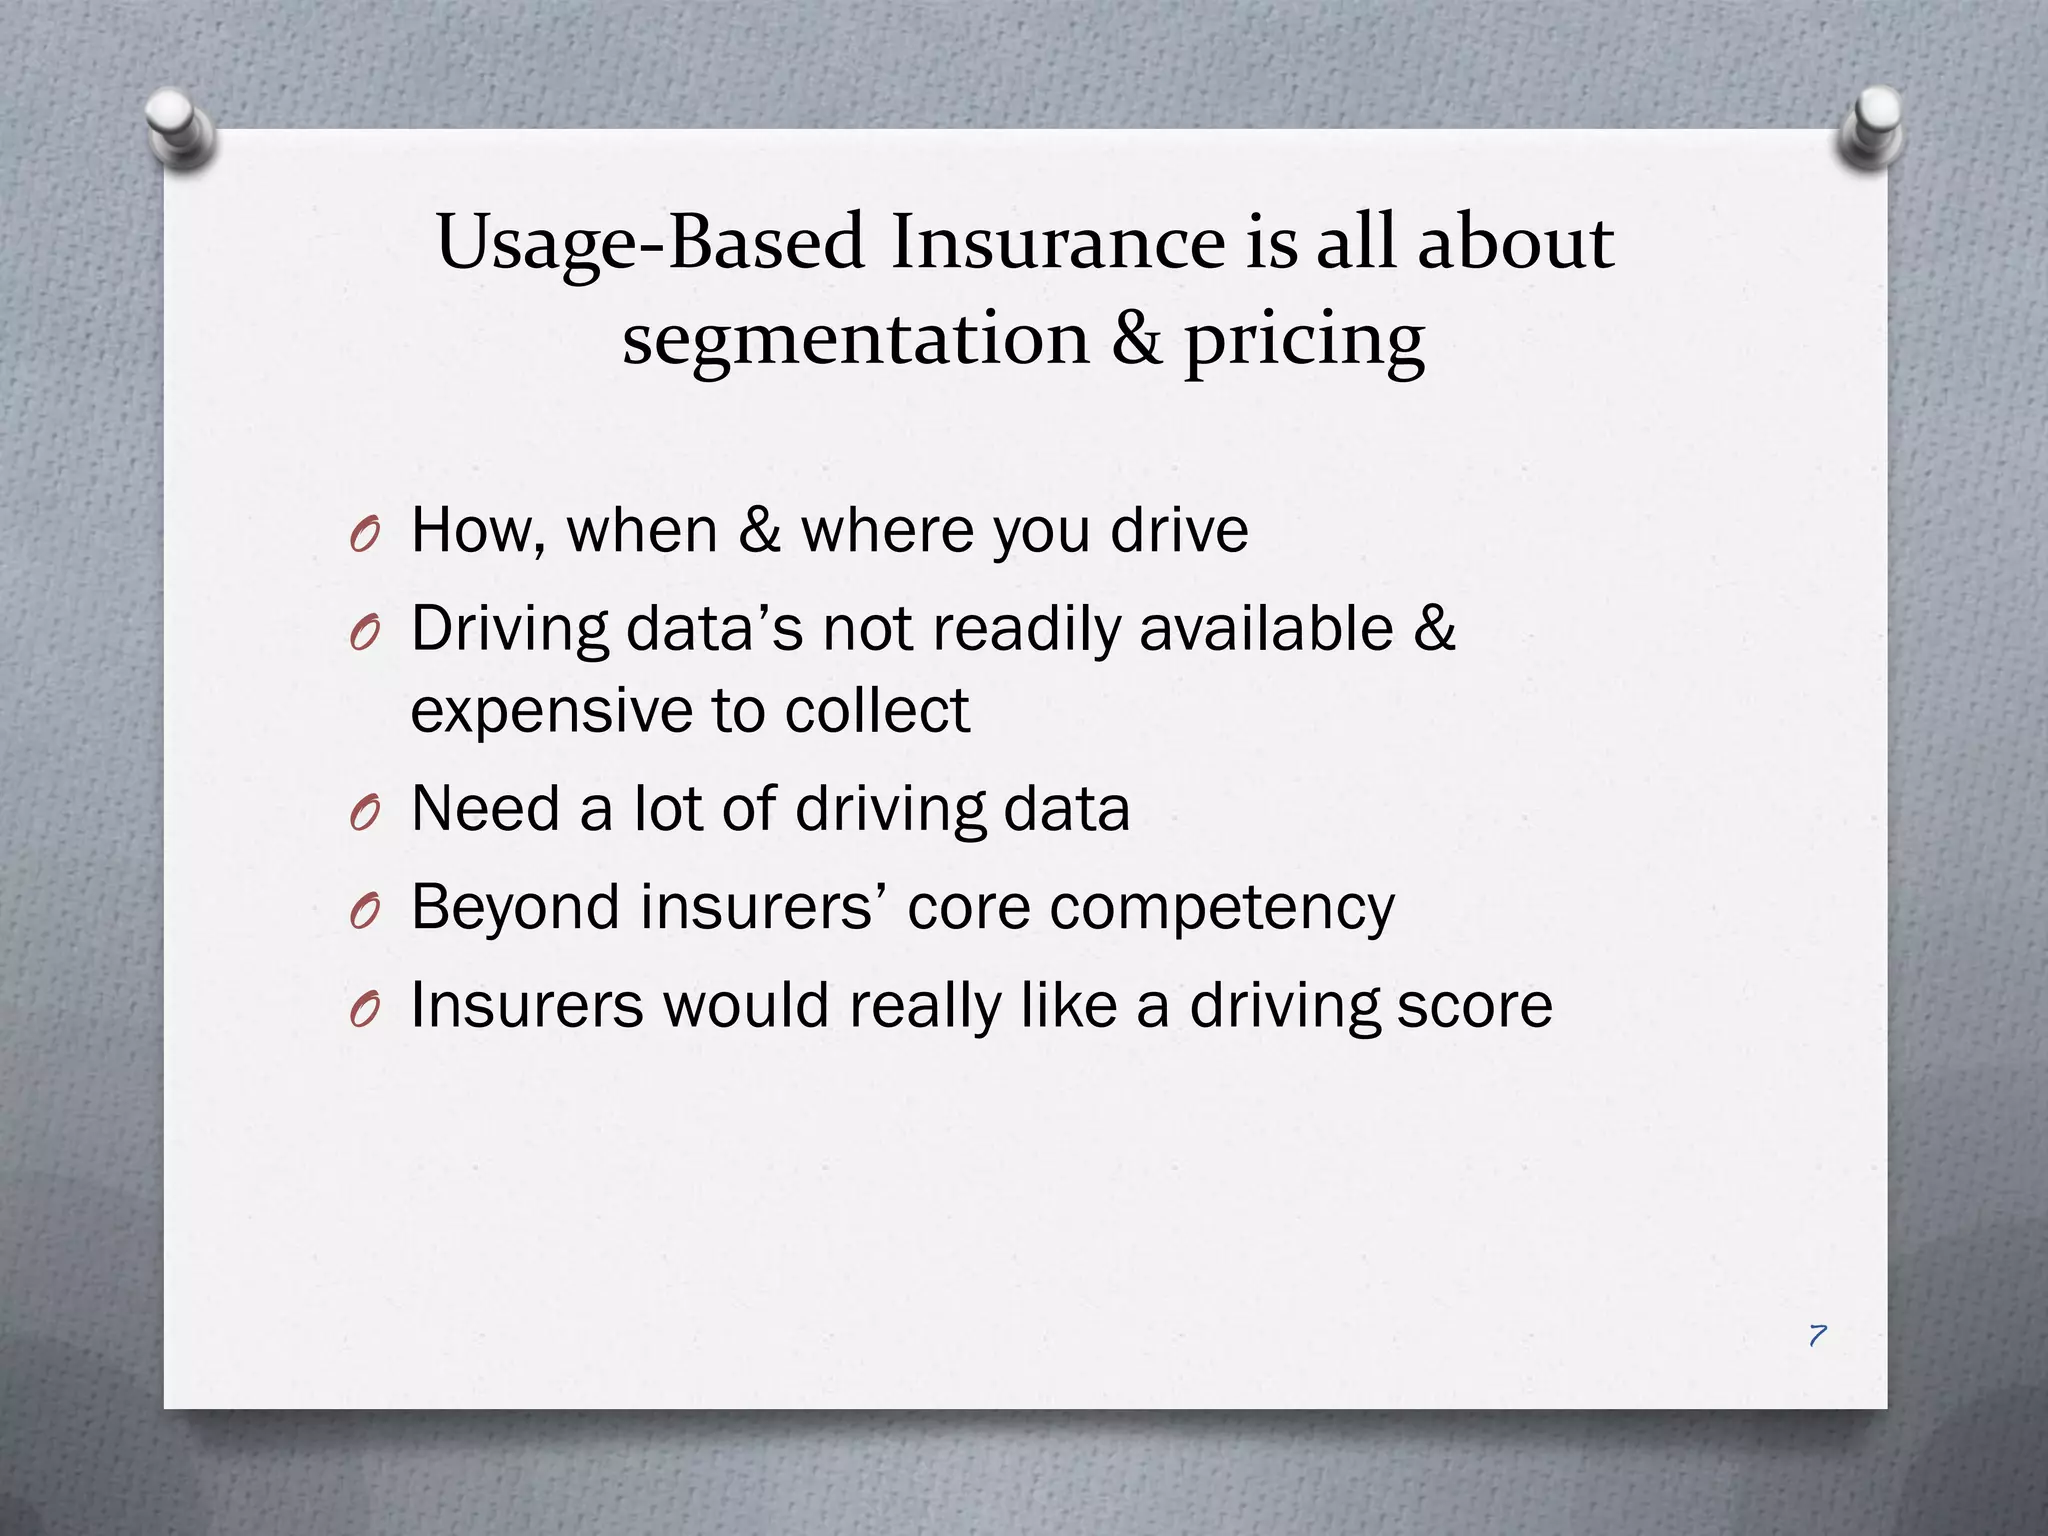
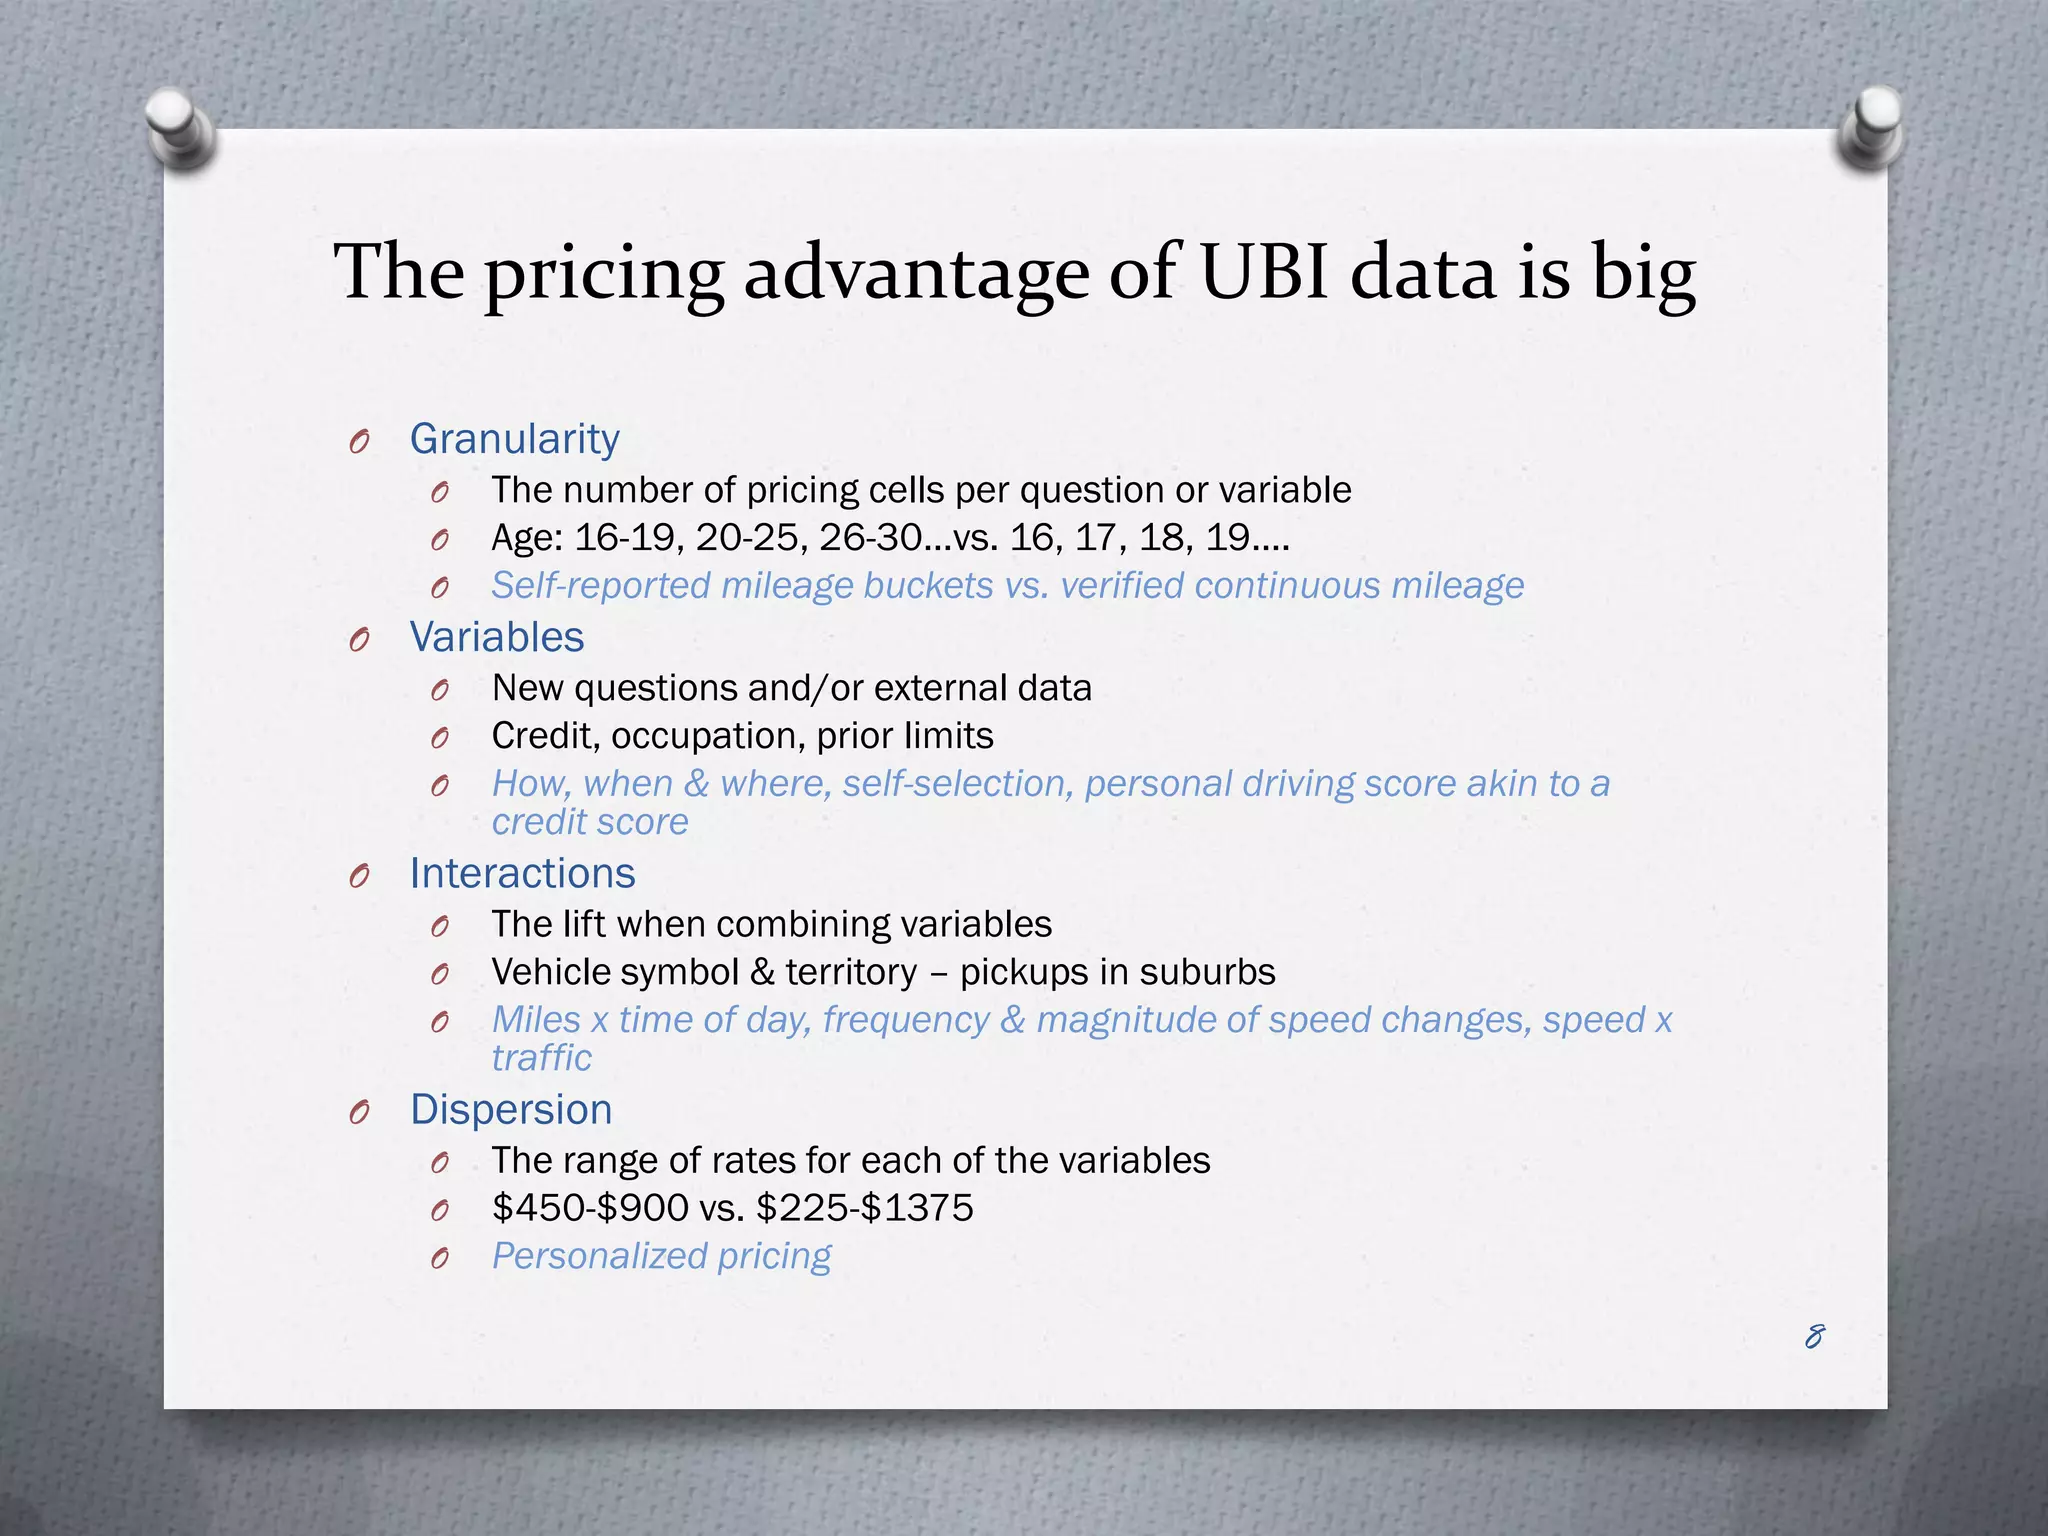
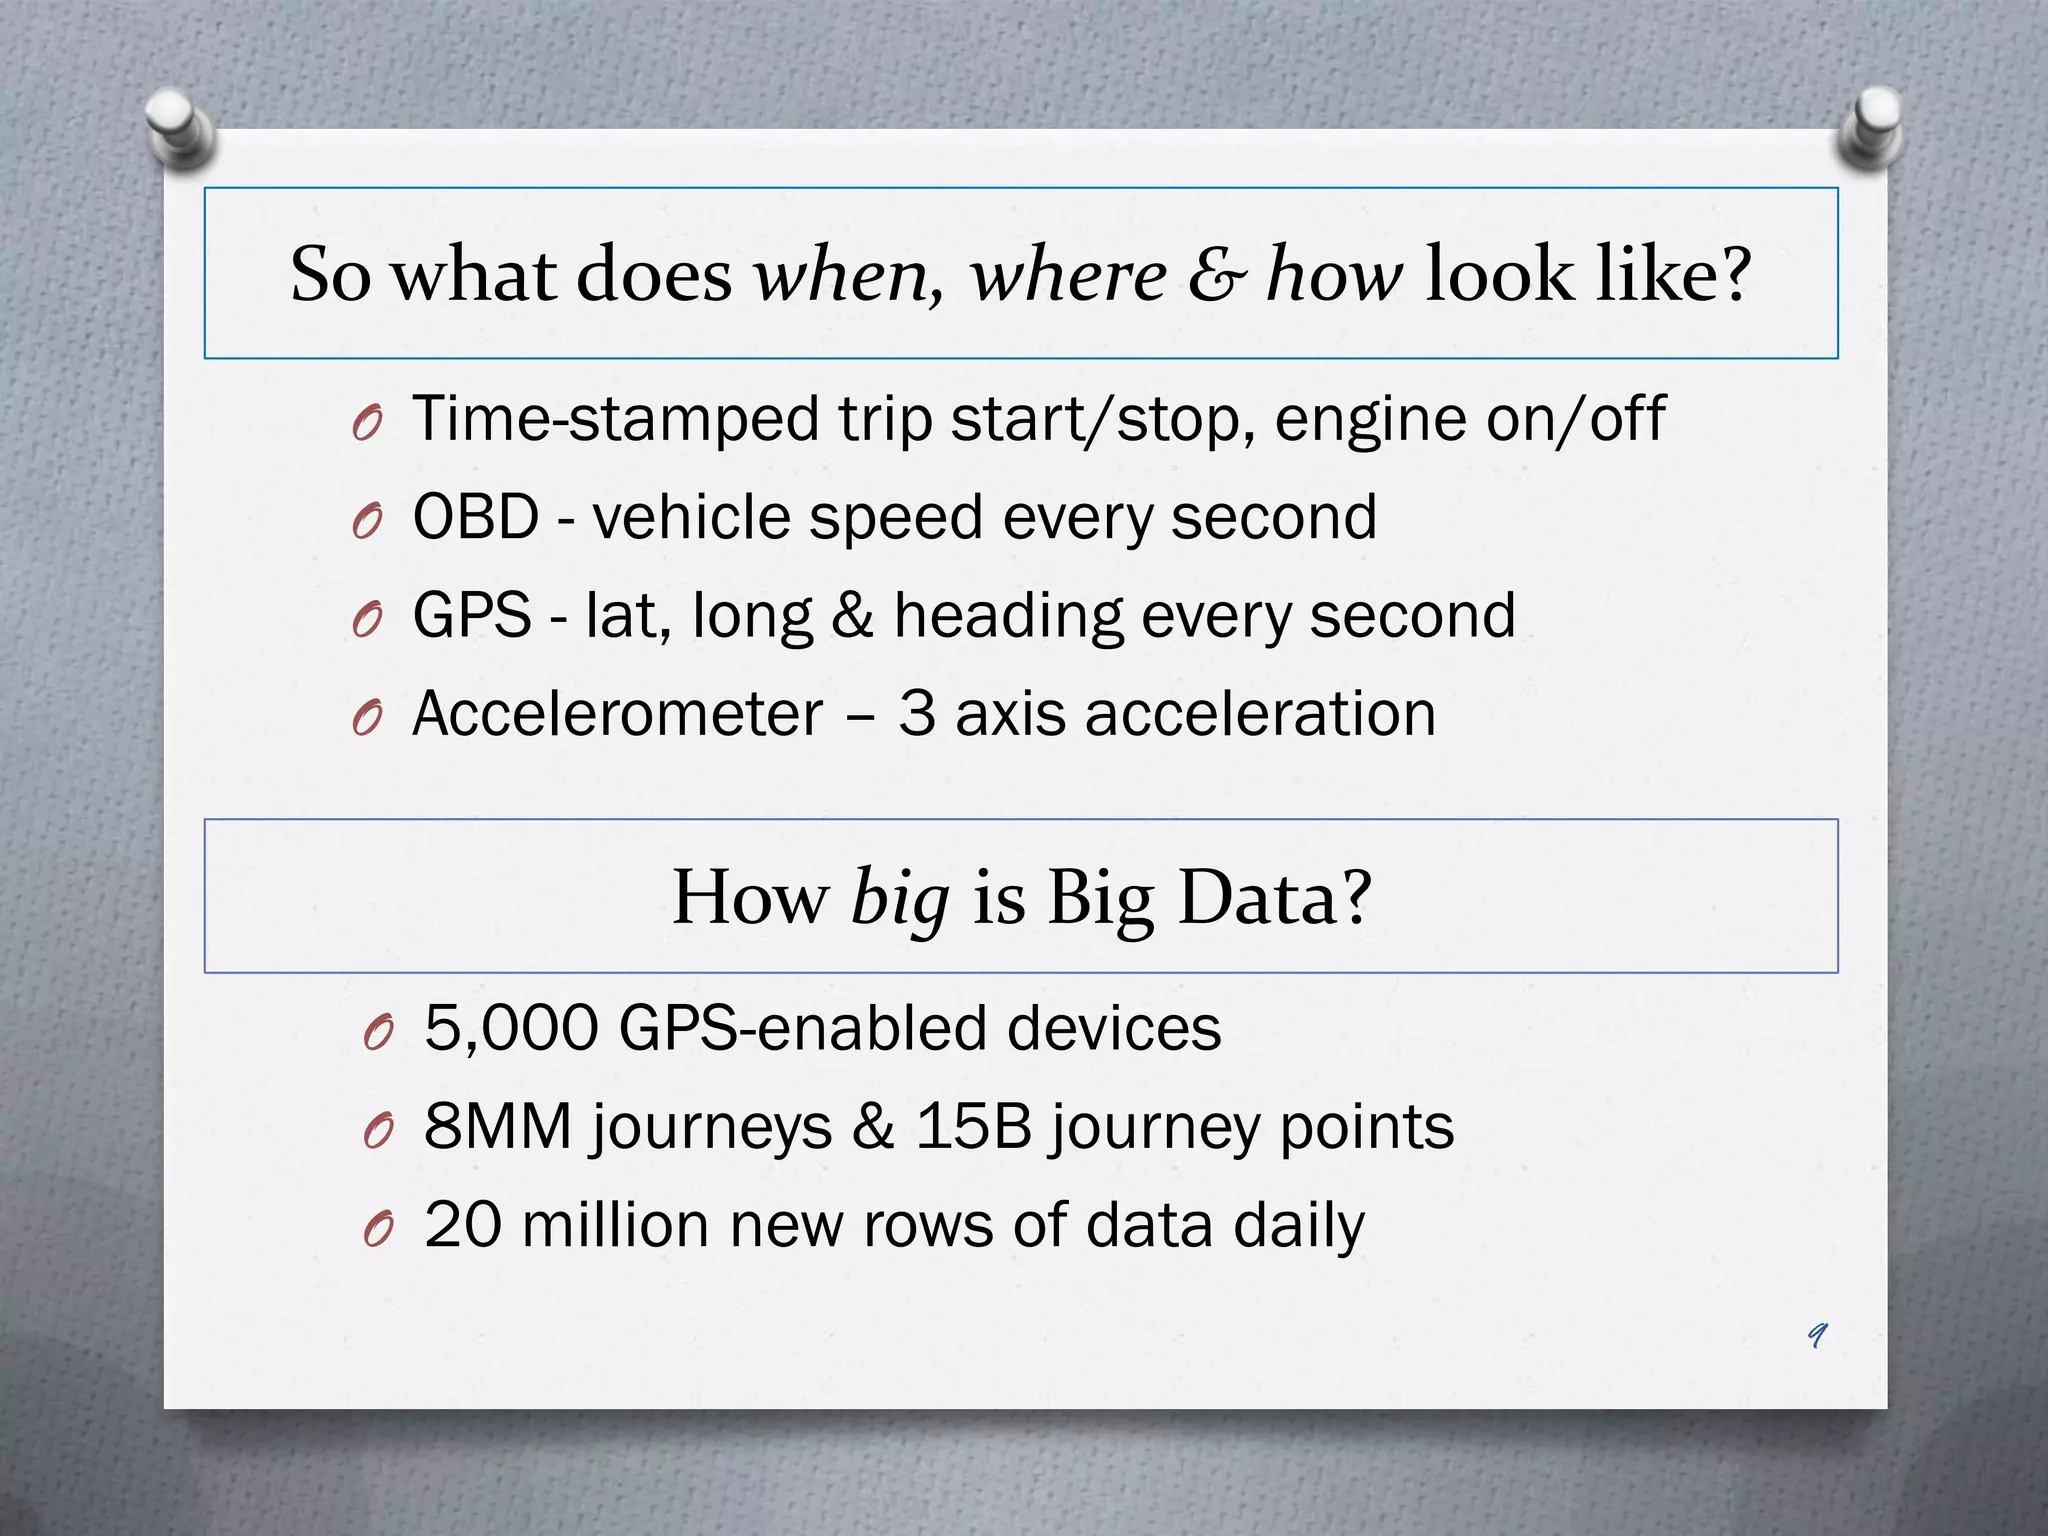
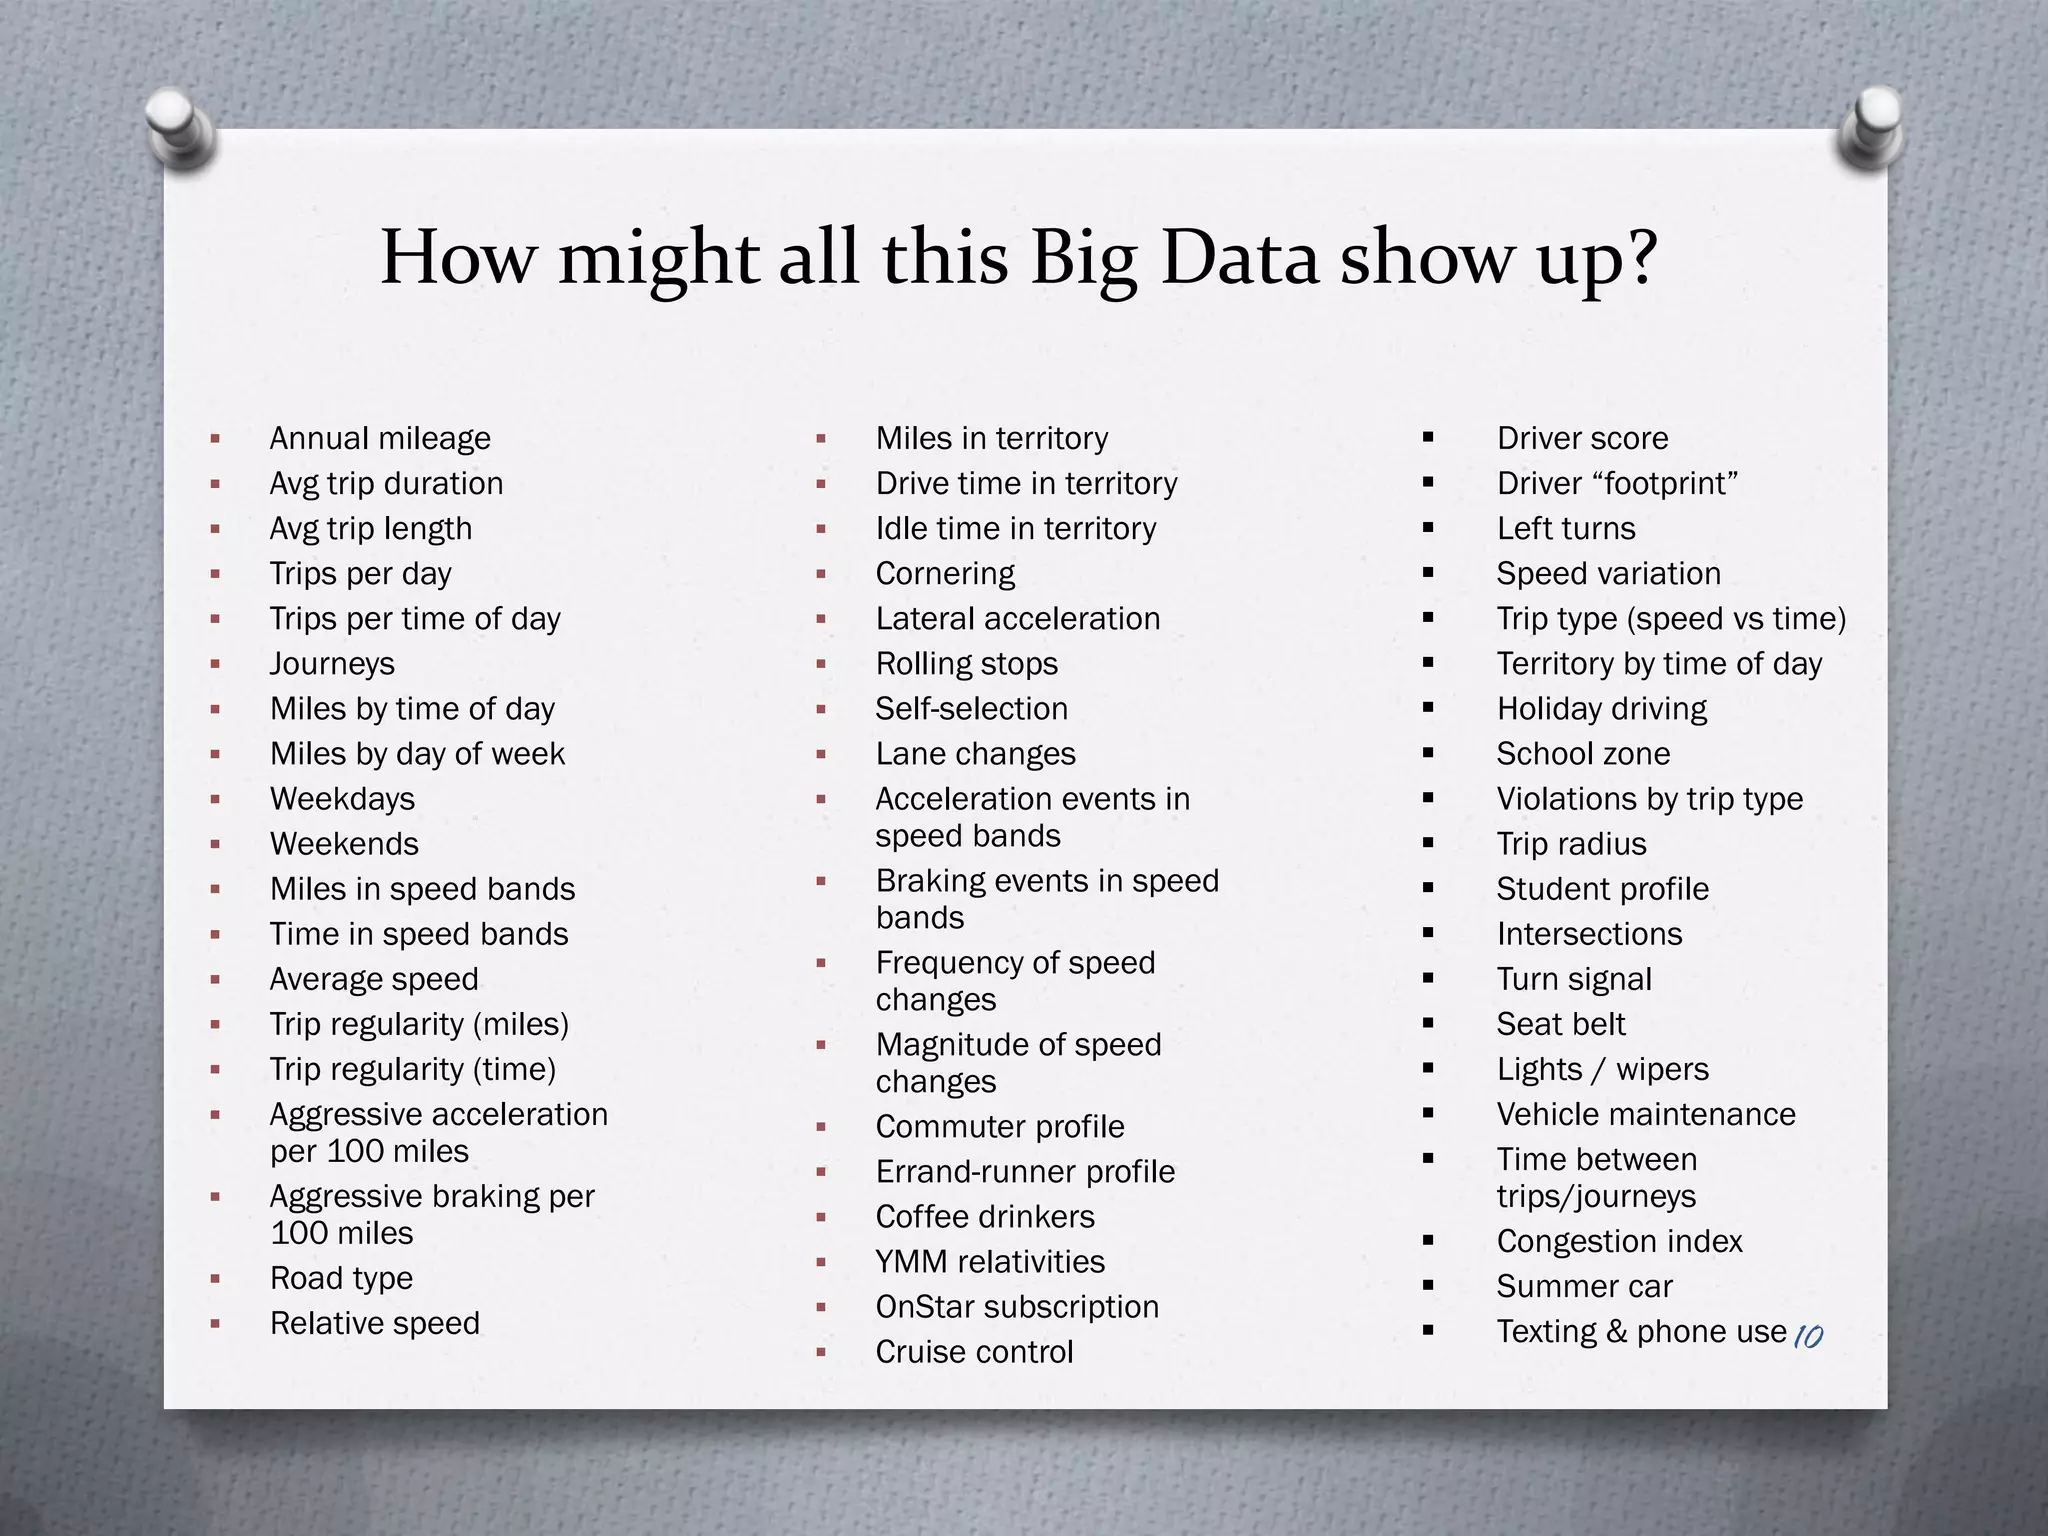
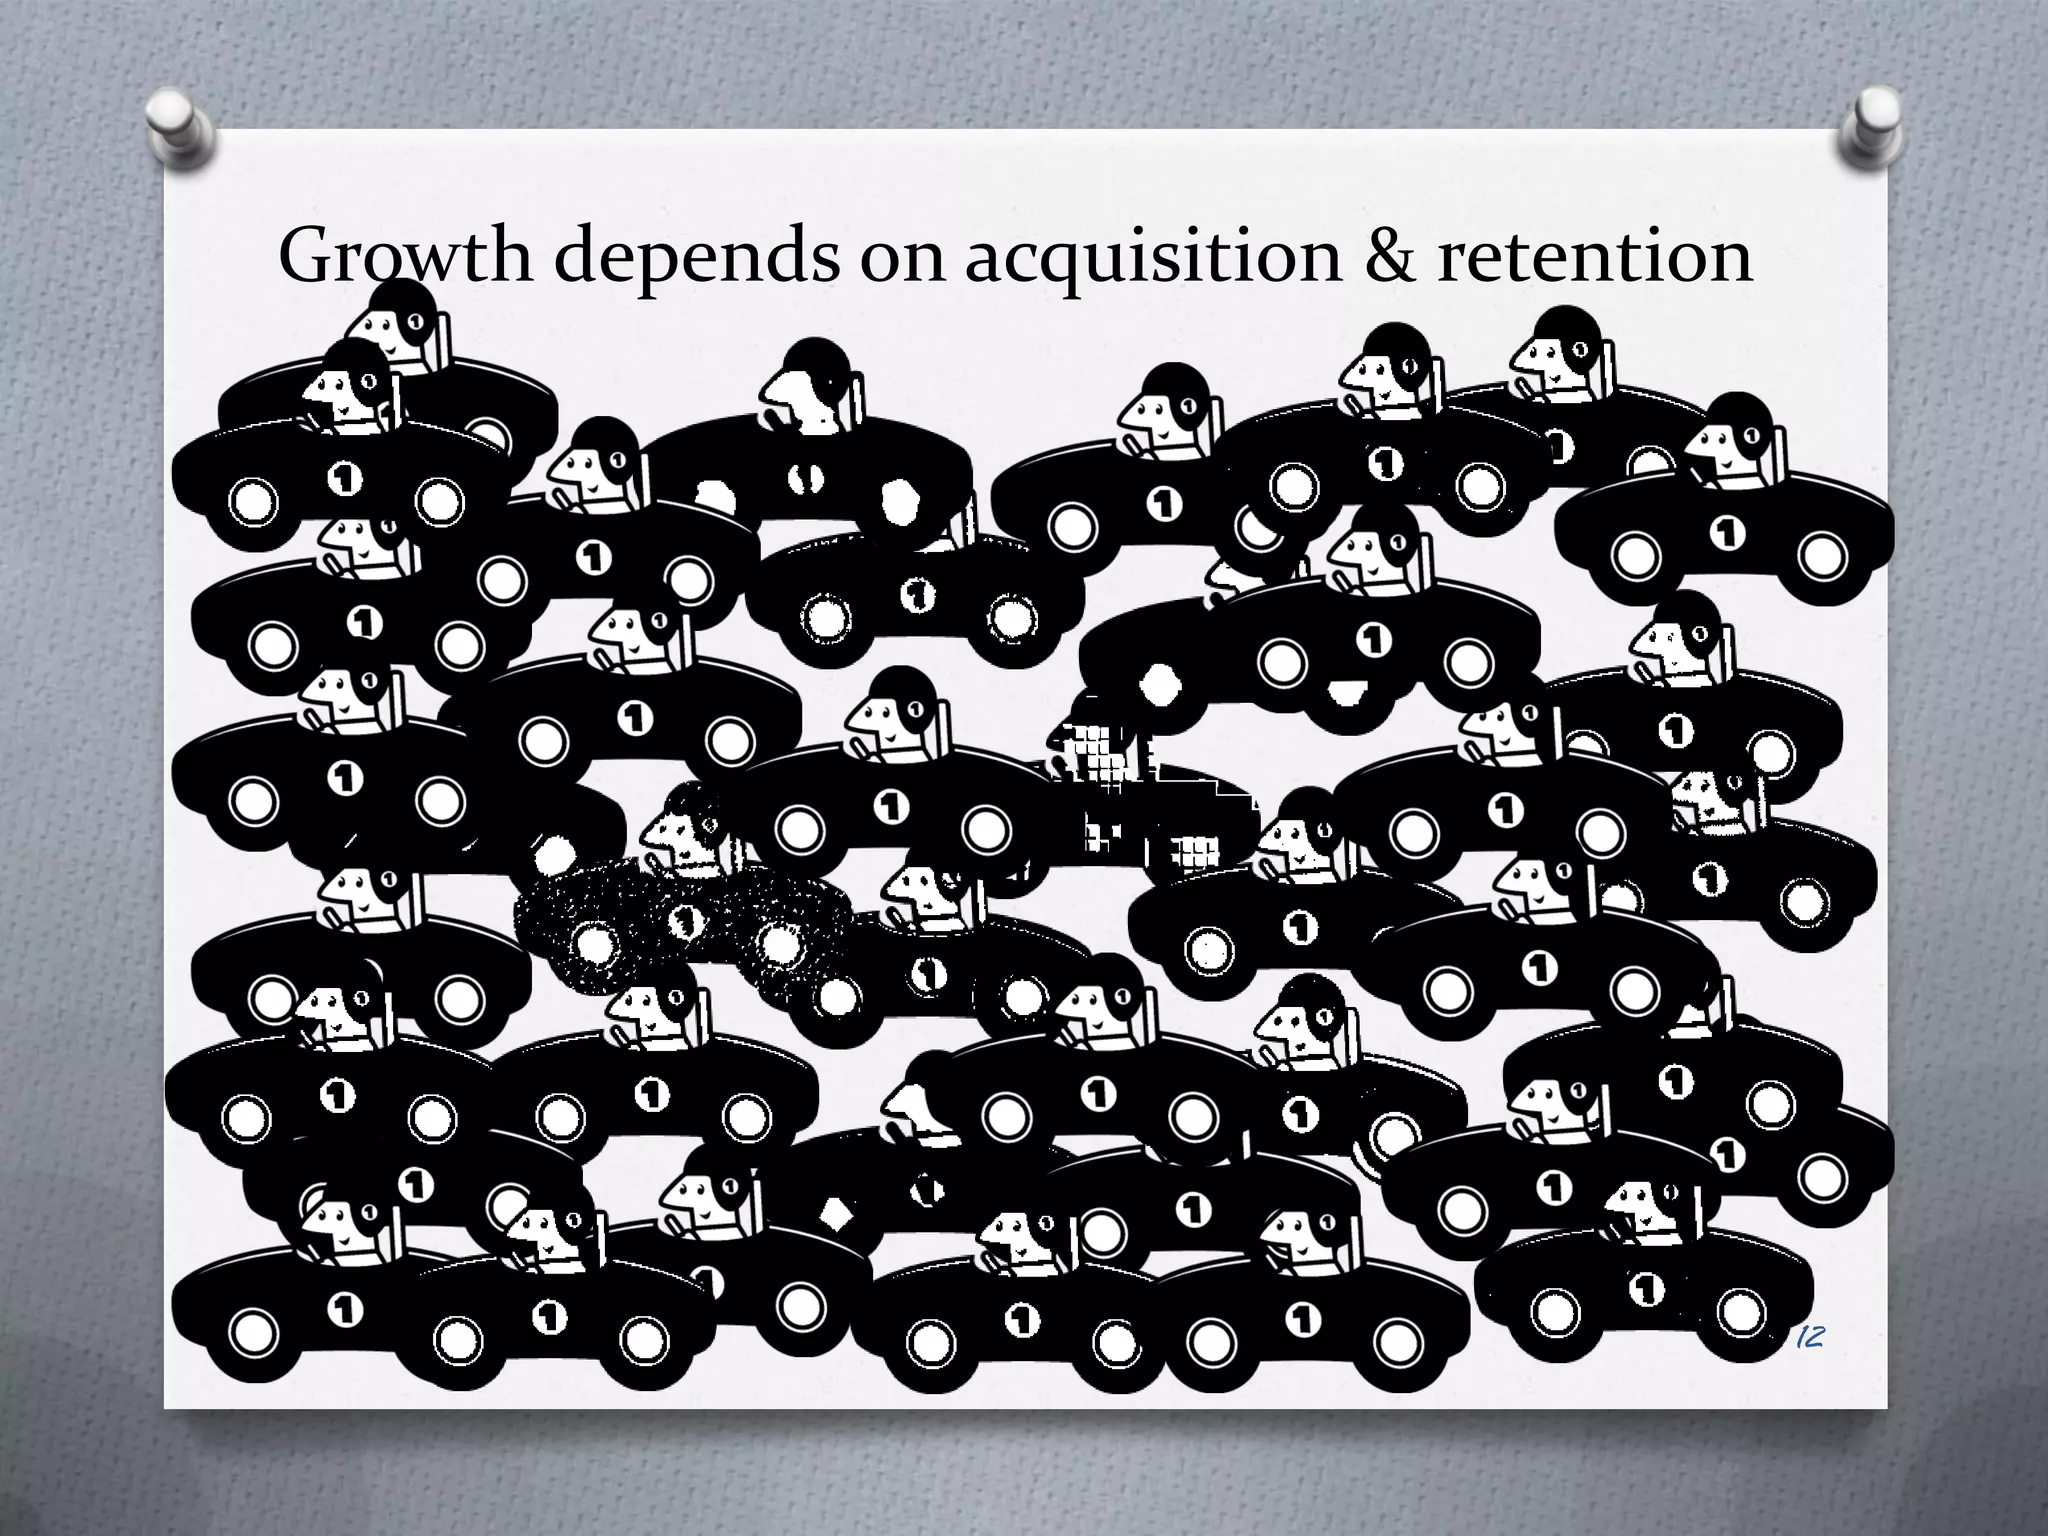
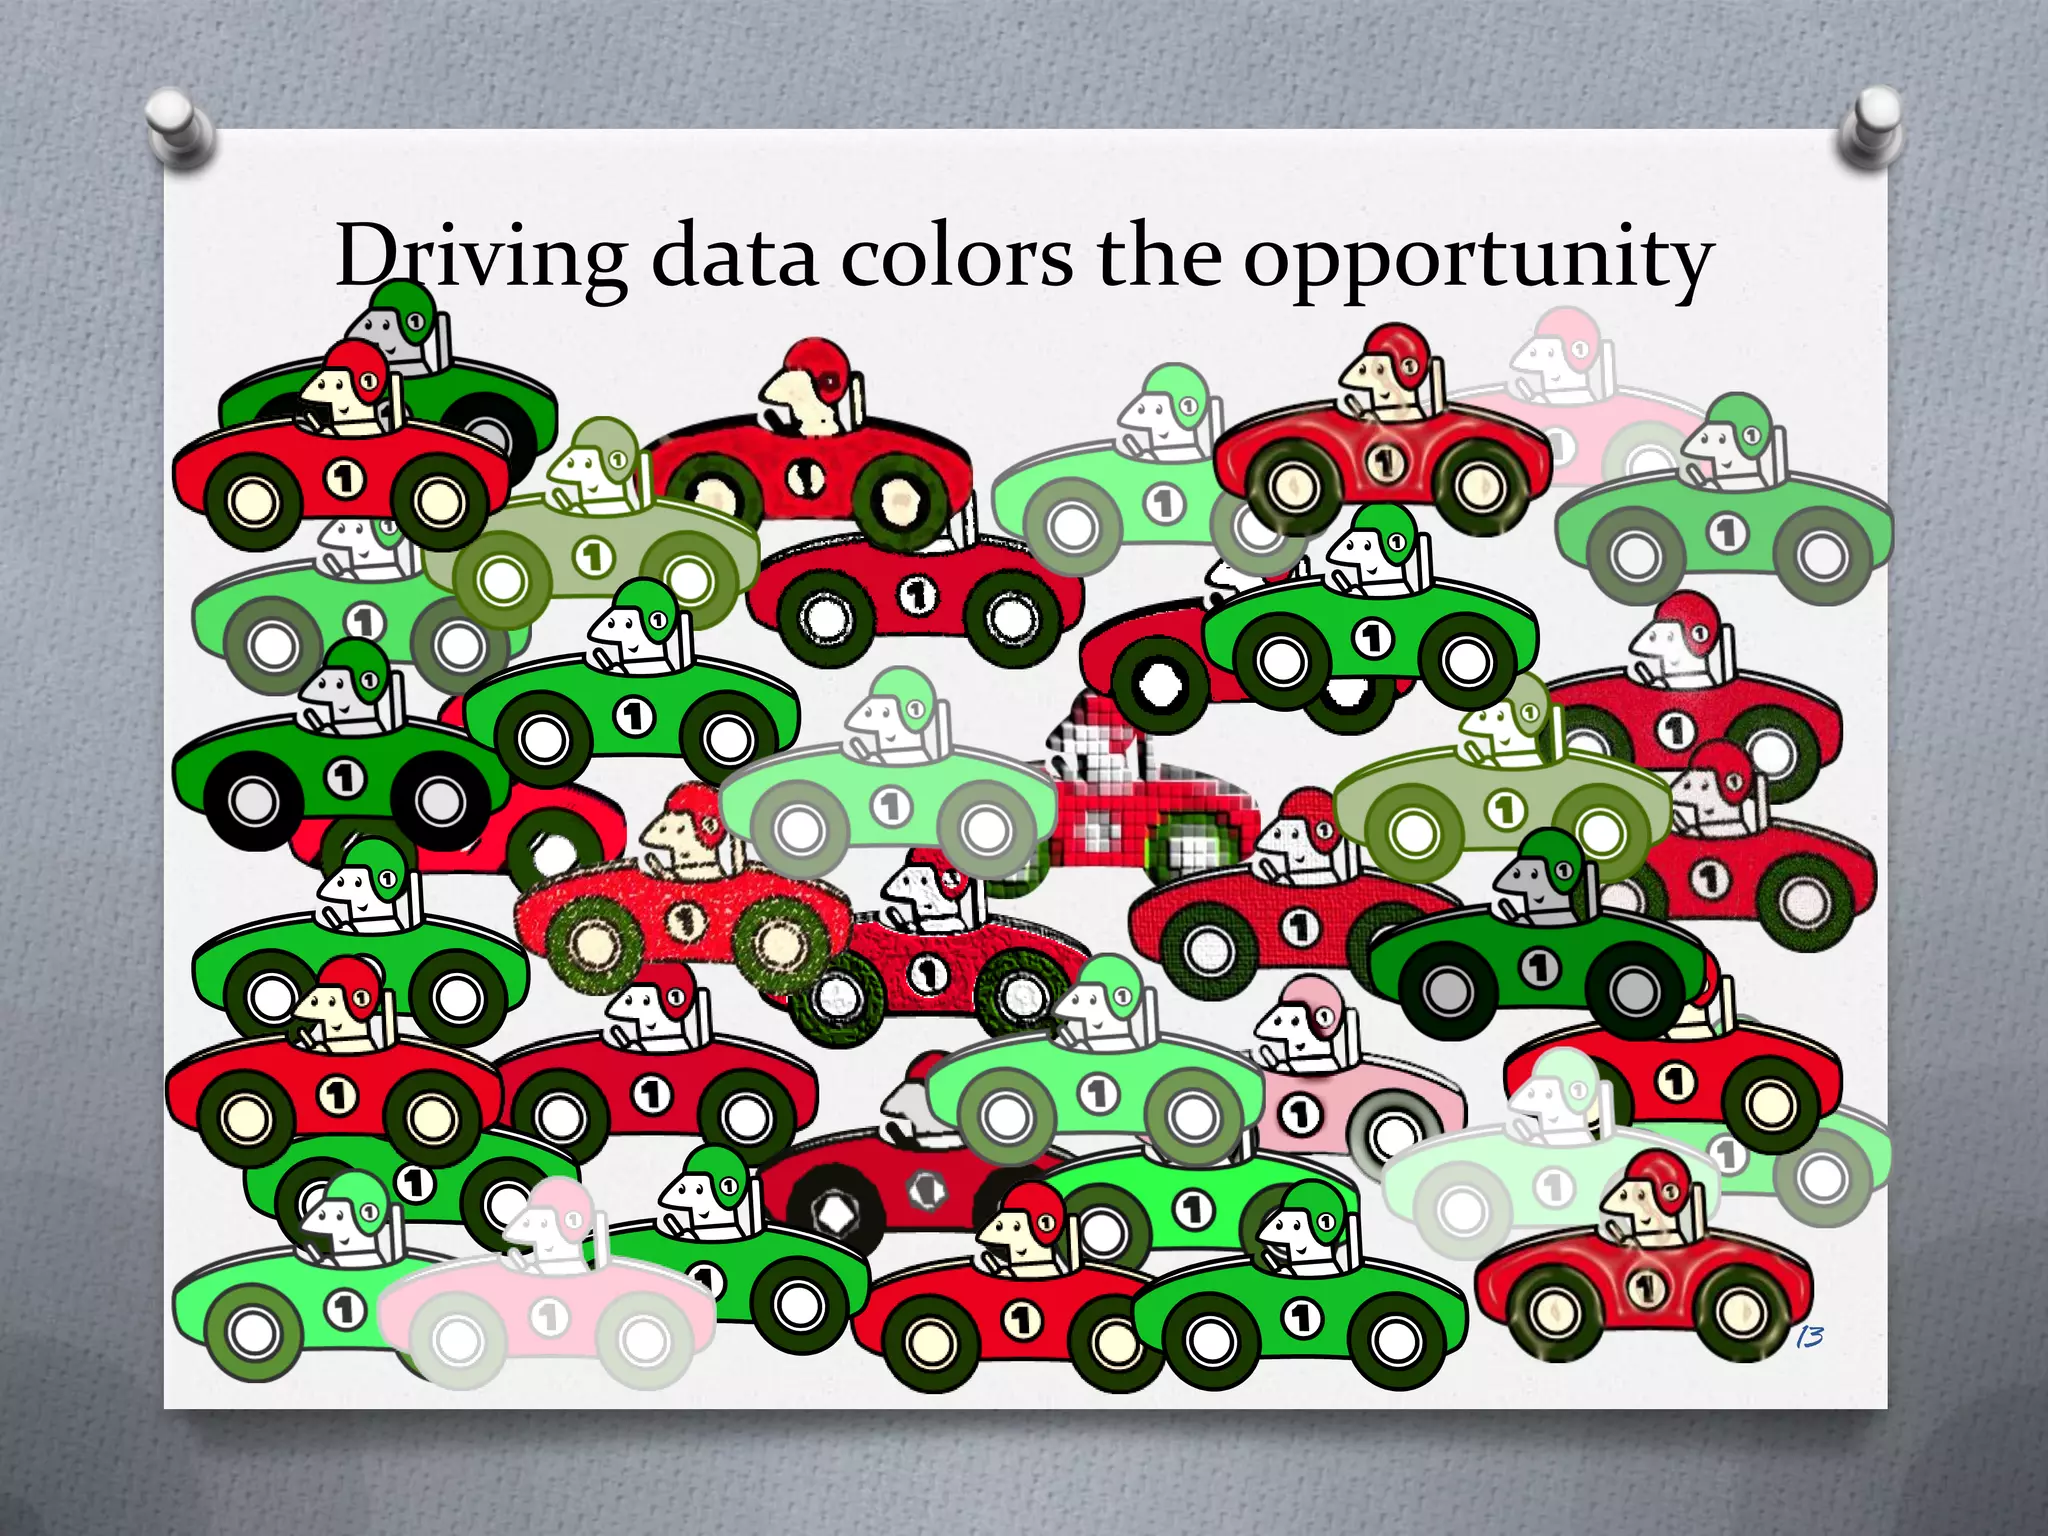
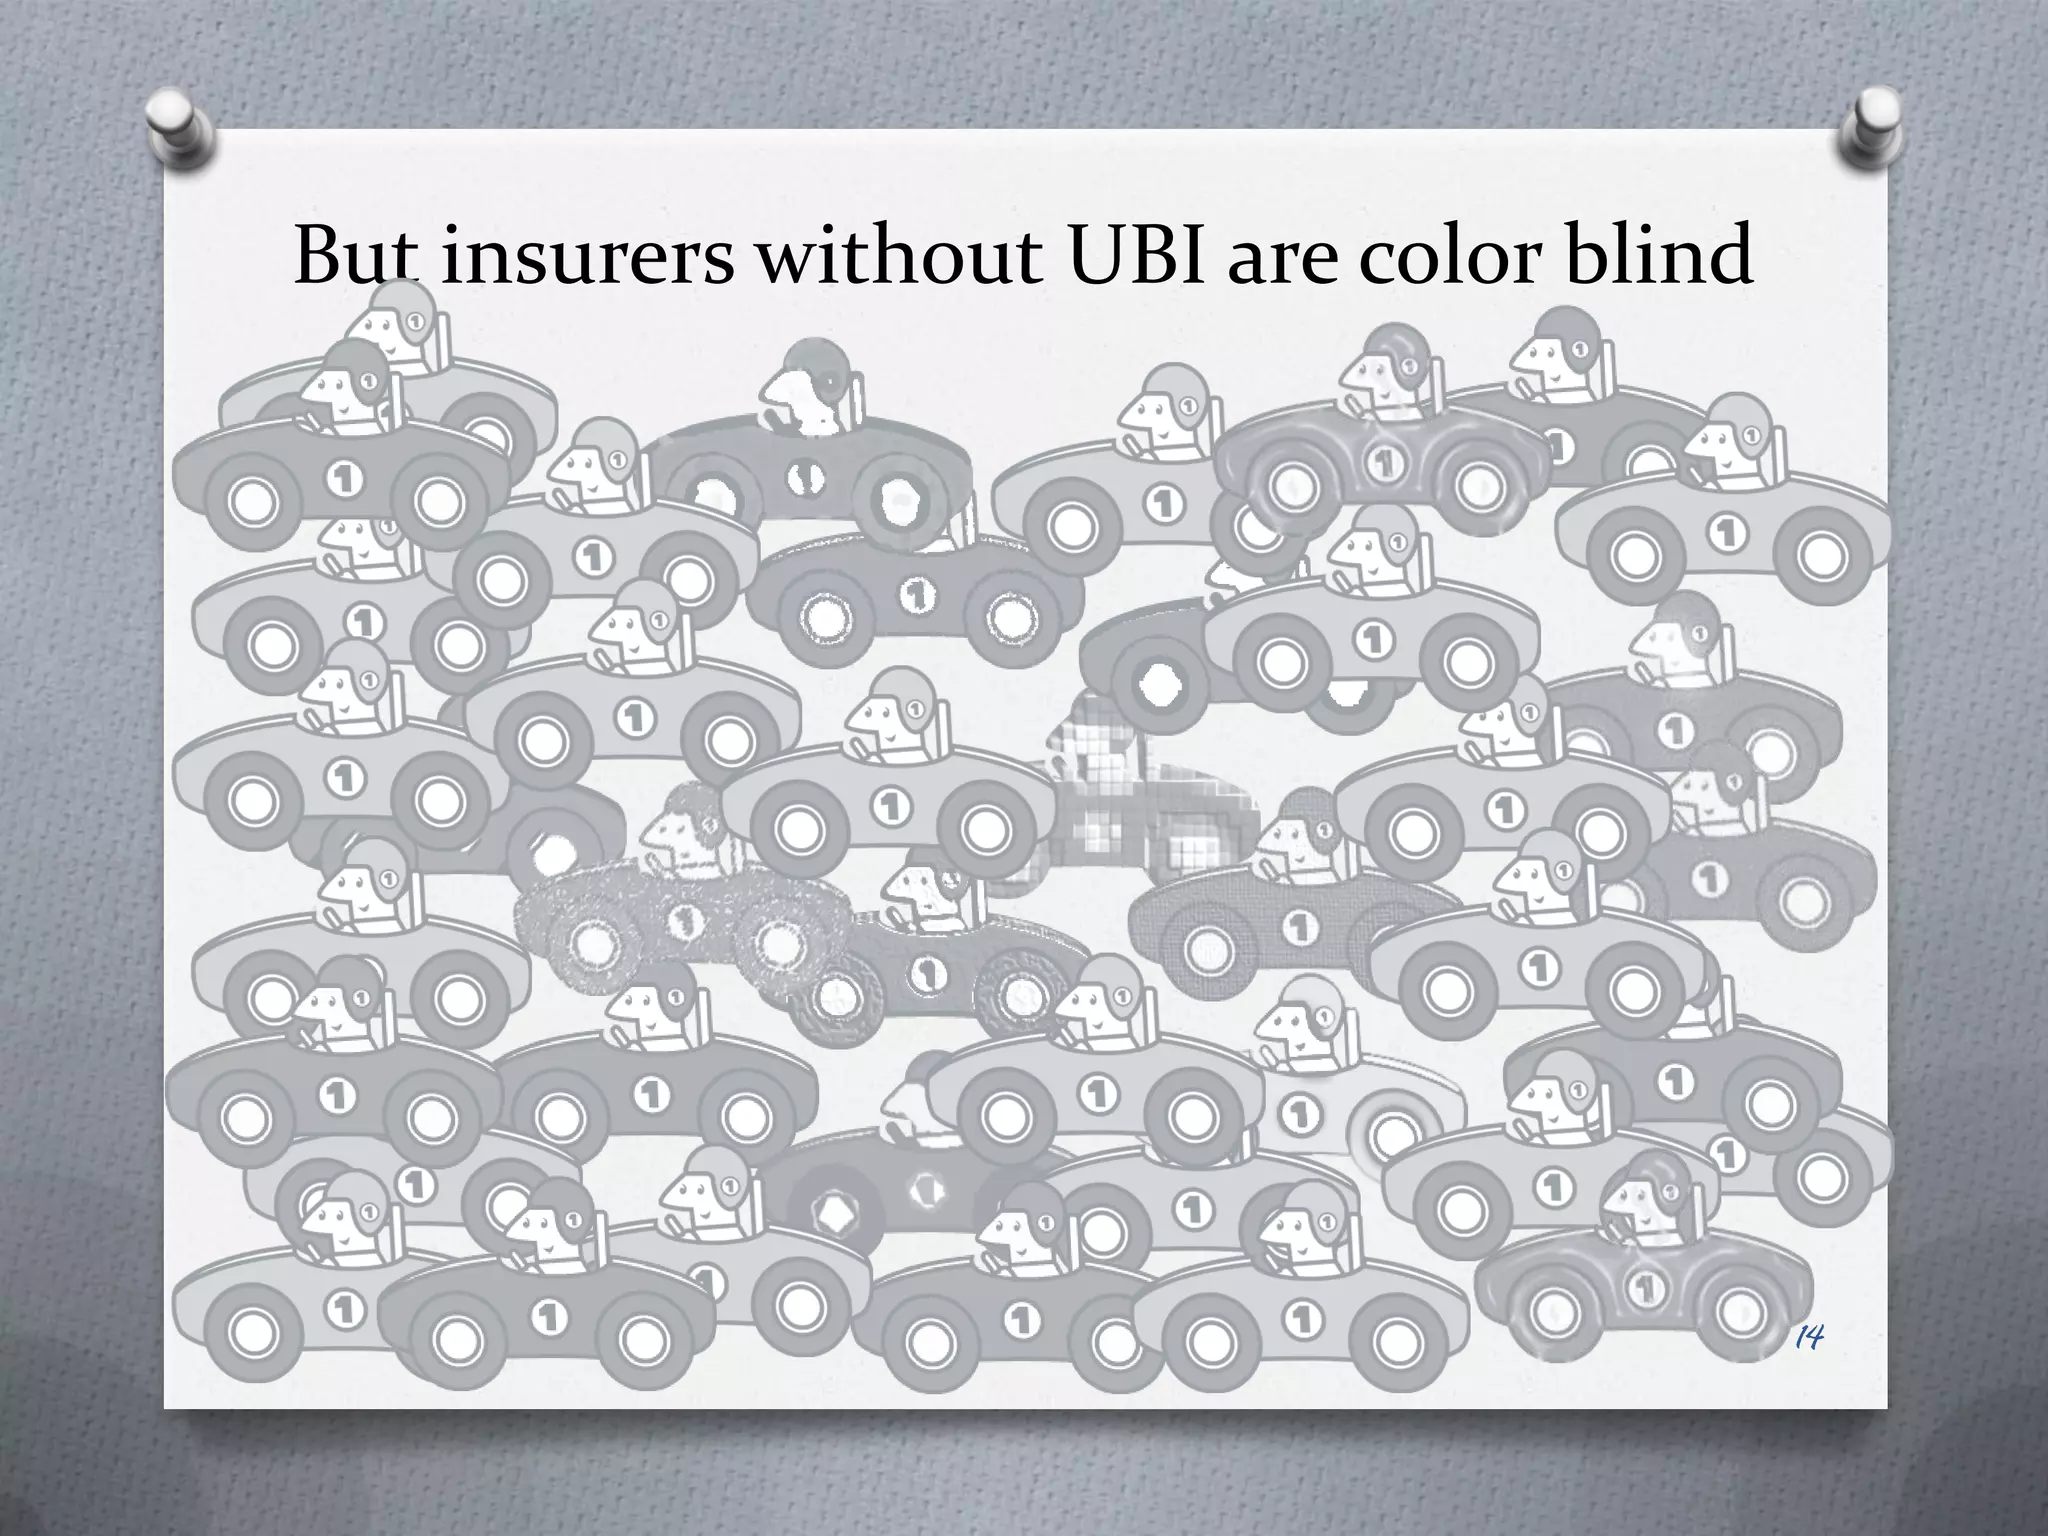
Insurance Telematics:
Big Data, Big Potential, Big Headache


            Dave Huber, President
               Kairos Solutions
             IFSUG March 2012
Big Data


           2
One of the few products whose price is set
         before costs are known
    Known costs                       Unknown costs
O   Loss adjustment expense       O   Pure premium (freq x sev)
O   Operations                    O   Bodily injury
O   Advertising                   O   Comp & Collision
O   Underwriting                  O   Regulatory
O   Commissions                   O   Trends


              Known costs
             Unknown costs
                                              Premium


                  Data drives insurance decisions                 3
Pricing sophistication is a competitive
advantage and depends on data analytics
O Granularity
   O The number of pricing cells per question or variable
   O Age: 16-19, 20-25, 26-30…vs. 16, 17, 18, 19….
O Dispersion
   O The range of rates for each of the variables
   O $450-$900 vs. $225-$1375
O Interactions
   O The lift when combining variables
   O Vehicle symbol & territory – pickups in suburbs
O Variables
   O New questions and/or external data
   O Credit, occupation, prior limits

                                                            4
Insurers generally use the same data to price

$1000                                                                    $1000


               31                       Age                    31
               M                      Gender                   M
                S                  Marital status              S
              Speed                  Violations              Speed
                4                     Points                   4
               Own                 Homeowner                  Own
                Y                 Prior insurance              Y
               611                     Credit                 611
              YMM                     Vehicle                 YMM


These drivers look like Pure Premium Carbon Copies and are priced identically
                                                                                5
But imagine knowing something about drivers
           that no one else knows
 $800                                                                         $1200

                 31                       Age                     31
                 M                      Gender                     M
                 S                   Marital status                S
               Speed                   Violations                Speed
                 4                       Points                    4
                Own                   Homeowner                   Own
                 Y                   Prior insurance               Y
                611                      Credit                   611
                YMM                     Vehicle                  YMM
               10,651             Verified Annual Miles         13,182
                4.9                   Trips per day               6.1

                                                                                     6
So they’re NOT Pure Premium Carbon Copies after all…and they deserve a different price
Usage-Based Insurance is all about
        segmentation & pricing

O How, when & where you drive
O Driving data’s not readily available &
  expensive to collect
O Need a lot of driving data
O Beyond insurers’ core competency
O Insurers would really like a driving score


                                               7
The pricing advantage of UBI data is big
O   Granularity
     O   The number of pricing cells per question or variable
     O   Age: 16-19, 20-25, 26-30…vs. 16, 17, 18, 19….
     O   Self-reported mileage buckets vs. verified continuous mileage
O   Variables
     O   New questions and/or external data
     O   Credit, occupation, prior limits
     O   How, when & where, self-selection, personal driving score akin to a
         credit score
O   Interactions
     O   The lift when combining variables
     O   Vehicle symbol & territory – pickups in suburbs
     O   Miles x time of day, frequency & magnitude of speed changes, speed x
         traffic
O   Dispersion
     O   The range of rates for each of the variables
     O   $450-$900 vs. $225-$1375
     O   Personalized pricing

                                                                                8
So what does when, where & how look like?
 O Time-stamped trip start/stop, engine on/off
 O OBD - vehicle speed every second
 O GPS - lat, long & heading every second
 O Accelerometer – 3 axis acceleration


            How big is Big Data?
  O 5,000 GPS-enabled devices
  O 8MM journeys & 15B journey points
  O 20 million new rows of data daily
                                                 9
How might all this Big Data show up?

   Annual mileage               Miles in territory           Driver score
   Avg trip duration            Drive time in territory      Driver “footprint”
   Avg trip length              Idle time in territory       Left turns
   Trips per day                Cornering                    Speed variation
   Trips per time of day        Lateral acceleration         Trip type (speed vs time)
   Journeys                     Rolling stops                Territory by time of day
   Miles by time of day         Self-selection               Holiday driving
   Miles by day of week         Lane changes                 School zone
   Weekdays                     Acceleration events in       Violations by trip type
   Weekends                      speed bands                  Trip radius
   Miles in speed bands         Braking events in speed      Student profile
   Time in speed bands           bands                        Intersections
   Average speed                Frequency of speed           Turn signal
                                  changes
   Trip regularity (miles)                                    Seat belt
                                 Magnitude of speed
   Trip regularity (time)        changes                      Lights / wipers
   Aggressive acceleration      Commuter profile             Vehicle maintenance
    per 100 miles                                              Time between
                                 Errand-runner profile
   Aggressive braking per                                      trips/journeys
    100 miles                    Coffee drinkers
                                                               Congestion index
   Road type                    YMM relativities
                                                               Summer car
   Relative speed               OnStar subscription
                                                               Texting & phone use 10
                                 Cruise control
Big Potential


                11
Growth depends on acquisition & retention


                                            12
Driving data colors the opportunity


                                      13
But insurers without UBI are color blind


                                           14
UBI book attracts preferred drivers who
       are accurately priced…


                                          15
Insurers without UBI are left with a book
      that looks like this to them…


                                            16
But in reality behaves like this…


                                    17

Big Data @ SAS IFSUG

  • 1.
    Insurance Telematics: Big Data,Big Potential, Big Headache Dave Huber, President Kairos Solutions IFSUG March 2012
  • 2.
  • 3.
    One of thefew products whose price is set before costs are known Known costs Unknown costs O Loss adjustment expense O Pure premium (freq x sev) O Operations O Bodily injury O Advertising O Comp & Collision O Underwriting O Regulatory O Commissions O Trends Known costs Unknown costs Premium Data drives insurance decisions 3
  • 4.
    Pricing sophistication isa competitive advantage and depends on data analytics O Granularity O The number of pricing cells per question or variable O Age: 16-19, 20-25, 26-30…vs. 16, 17, 18, 19…. O Dispersion O The range of rates for each of the variables O $450-$900 vs. $225-$1375 O Interactions O The lift when combining variables O Vehicle symbol & territory – pickups in suburbs O Variables O New questions and/or external data O Credit, occupation, prior limits 4
  • 5.
    Insurers generally usethe same data to price $1000 $1000 31 Age 31 M Gender M S Marital status S Speed Violations Speed 4 Points 4 Own Homeowner Own Y Prior insurance Y 611 Credit 611 YMM Vehicle YMM These drivers look like Pure Premium Carbon Copies and are priced identically 5
  • 6.
    But imagine knowingsomething about drivers that no one else knows $800 $1200 31 Age 31 M Gender M S Marital status S Speed Violations Speed 4 Points 4 Own Homeowner Own Y Prior insurance Y 611 Credit 611 YMM Vehicle YMM 10,651 Verified Annual Miles 13,182 4.9 Trips per day 6.1 6 So they’re NOT Pure Premium Carbon Copies after all…and they deserve a different price
  • 7.
    Usage-Based Insurance isall about segmentation & pricing O How, when & where you drive O Driving data’s not readily available & expensive to collect O Need a lot of driving data O Beyond insurers’ core competency O Insurers would really like a driving score 7
  • 8.
    The pricing advantageof UBI data is big O Granularity O The number of pricing cells per question or variable O Age: 16-19, 20-25, 26-30…vs. 16, 17, 18, 19…. O Self-reported mileage buckets vs. verified continuous mileage O Variables O New questions and/or external data O Credit, occupation, prior limits O How, when & where, self-selection, personal driving score akin to a credit score O Interactions O The lift when combining variables O Vehicle symbol & territory – pickups in suburbs O Miles x time of day, frequency & magnitude of speed changes, speed x traffic O Dispersion O The range of rates for each of the variables O $450-$900 vs. $225-$1375 O Personalized pricing 8
  • 9.
    So what doeswhen, where & how look like? O Time-stamped trip start/stop, engine on/off O OBD - vehicle speed every second O GPS - lat, long & heading every second O Accelerometer – 3 axis acceleration How big is Big Data? O 5,000 GPS-enabled devices O 8MM journeys & 15B journey points O 20 million new rows of data daily 9
  • 10.
    How might allthis Big Data show up?  Annual mileage  Miles in territory  Driver score  Avg trip duration  Drive time in territory  Driver “footprint”  Avg trip length  Idle time in territory  Left turns  Trips per day  Cornering  Speed variation  Trips per time of day  Lateral acceleration  Trip type (speed vs time)  Journeys  Rolling stops  Territory by time of day  Miles by time of day  Self-selection  Holiday driving  Miles by day of week  Lane changes  School zone  Weekdays  Acceleration events in  Violations by trip type  Weekends speed bands  Trip radius  Miles in speed bands  Braking events in speed  Student profile  Time in speed bands bands  Intersections  Average speed  Frequency of speed  Turn signal changes  Trip regularity (miles)  Seat belt  Magnitude of speed  Trip regularity (time) changes  Lights / wipers  Aggressive acceleration  Commuter profile  Vehicle maintenance per 100 miles  Time between  Errand-runner profile  Aggressive braking per trips/journeys 100 miles  Coffee drinkers  Congestion index  Road type  YMM relativities  Summer car  Relative speed  OnStar subscription  Texting & phone use 10  Cruise control
  • 11.
  • 12.
    Growth depends onacquisition & retention 12
  • 13.
    Driving data colorsthe opportunity 13
  • 14.
    But insurers withoutUBI are color blind 14
  • 15.
    UBI book attractspreferred drivers who are accurately priced… 15
  • 16.
    Insurers without UBIare left with a book that looks like this to them… 16
  • 17.
    But in realitybehaves like this… 17