Download to read offline
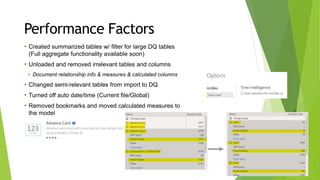
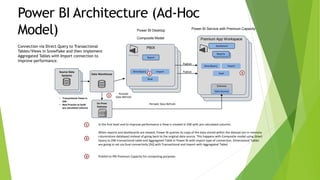
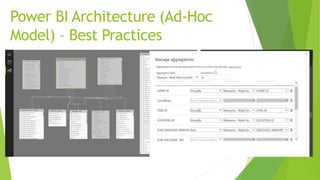
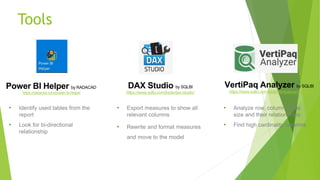
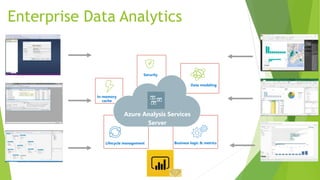

Gaston Cruz, a data analytics architect, outlines best practices for Power BI with emphasis on optimizing data models and performance via composite models. He details strategies such as creating summarized tables, utilizing dual connections, and employing tools like DAX Studio and the VertiPaq Analyzer. The document highlights the infrastructure and processes necessary for efficient reporting and data management in a data warehouse environment.