2. 168 ACI Structural Journal/March-April 2011
are therefore not discussed any further. The following two
sections outline the instrumentation layouts and evaluation
techniques for determining the shear and flexural displacement
components from the wall tests.
Typical instrumentation layouts for determining
displacement components
Possible layouts for determining the different displacement
components are discussed, using the instrumentation of the
U-shaped walls that were tested by the authors under quasi-
static cyclic loading7
as an example. The main objective of
these tests was to compare the behavior of the U-shaped
walls for different directions of loading. Because the results
of these tests are also used in the following sections, a brief
description of the test setup and the loading history is given
herein; for further details, refer to Beyer et al.7
The cross
sections, aspect ratios, and axial load ratios of the two test
units TUA and TUB are given in Table 1. By means of three
actuators (Fig. 1(a)), the walls were subjected to a complex
bidirectional loading history (Fig. 1(b)) in which five
different directions of loading were distinguished and
labeled with different letters: 1) parallel to the web
(Positions A and B); 2) parallel to the flanges so that the
flange ends are in compression (Position C); 3) parallel to the
flanges so that the web is in compression (Position D); 4) in
a diagonal direction so that one flange end is in compression
(Positions E and H); and 5) in a diagonal direction so that one
corner is in compression (Positions F and G). At each
ductility level, the wall was first subjected to a cycle parallel
to the web, a cycle parallel to the flanges, a cycle in a
diagonal direction, and a “sweep.”
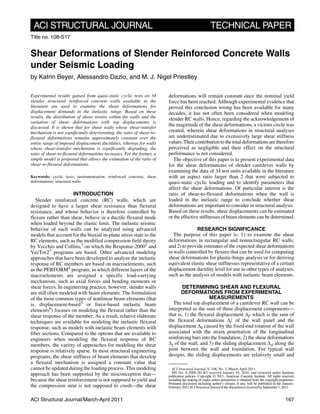
The instrumentation of the U-shaped walls was such that
the displacement components of the web and the two flanges
could be separately determined. Figure 2 shows the continuous
chains of linear variable differential transformers (LVDT)
measurements, which were taken along the four outer edges
of the U-shaped wall. Such LVDT chains are used in most
wall tests for determining average curvatures along the wall
height; for walls tested under unidirectional loading, two
chains instead of four are sufficient. When designing the
instrumentation for a test unit, the researcher typically
strives for as many detailed measurements as possible, while
at the same time limiting the number of instruments needed.
For this reason, it is common to choose LVDTs with smaller
base lengths for regions where inelastic deformations are
expected to cause large curvature gradients and LVDTs with
larger base lengths for regions that remain largely elastic
where the curvature gradient is smaller. For good estimates
of the flexural top displacement, it is typically advisable to
determine the displacement due to the fixed-end rotation Δθ
independently of the displacement due to the flexural
deformation of the wall Δf′. The base length of the lowest
member of the LVDT chain should therefore be so short that
the instrument only extends over the base crack between the
wall and foundation and does not cross any other large cracks.
For determining the shear deformations, diagonal measure-
ments are taken (Fig. 2(a)). To cover approximately the height of
one inclined flexure-shear crack, values in the order of the wall
length are often chosen for the height of the shear panel, but
smaller heights have also been used in the past.8,9 When the
lowest points of the diagonal measurements are fixed to the wall
rather than the foundation, the measured shear deformation does
not include any sliding movement Δsl along the construction joint
between the foundation and the wall; in this case, the sliding
movement has to be separately measured using additional
LVDTs7 (Fig. 2).
Computation of displacement components from
experimental measurements
Due to the presence of “cracking, plane sections not
remaining plane, and the existence of a moment gradient
across the element,”8
as well as the fact that the subdivision
of deformations of inelastic RC wall members into shear and
flexural deformations is—to some extent—artificial, the
displacement components determined from experimental
measurements are only approximate values. Although they
are not exact, however, they provide a useful link between
the experiments and numerical models, particularly if beam
models are used. Average curvatures can be derived from the
chains of LVDTs along the edges of the walls, and the
flexural deformations Δf′ can be computed by integrating the
curvatures twice. The total flexural displacement Δf′ is
computed as the sum of Δf′ plus the wall displacement due to
the fixed-end rotation Δθ, which is associated with strain
penetration into the foundation. Unlike for the experimental
flexural deformations, which are mostly determined by the
method described previously, and where differences
between test series on RC walls chiefly originate from
different base lengths of the LVDT measurements rather
than the evaluation method, the evaluation of shear
deformation is less homogenous between different research
groups. For many test series, the shear displacements of a
shear panel have been evaluated using one of the following
two equations
(1a)
(1b)
where b is the width of the shear panel, d is the original
length of the diagonal, and δi is the change in length of one
of the two diagonals. Equation (1(b)) corresponds to the zero
and first order terms of the Taylor series of Eq. (1(a)).
Hiraishi10 showed that these approaches are only correct if
the curvature is constant over the height of the panel for
which the shear displacements are determined and, therefore,
any difference in the lengths of the diagonals is associated
Δs
1
4b
------ d δ2+( )
2
d δ1+( )
2
–( )=
Δs
d
2b
------ δ2 δ1–( )=
ACI member Katrin Beyer is an Assistant Professor of Earthquake Engineering at
the Ecole Polytechnqiue Fédérale de Lausanne (EPFL) in Lausanne, Switzerland. She
received her PhD from the Rose School, Pavia, Italy. Her research interests include
large-scale structural tests, the seismic behavior of nonrectangular reinforced
concrete (RC) walls and unreinforced masonry structures, and the torsional response
of asymmetric buildings when subjected to seismic excitation.
ACI member Alessandro Dazio is Deputy-Director of the Rose School and
Coordinator of the Reinforced Concrete research section of the EUCENTRE
Foundation in Pavia, Italy. His research interests include the seismic design and
assessment of RC and masonry structures through large-scale structural testing,
numerical simulation, and analytical models.
M. J. Nigel Priestley, FACI, is a Professor Emeritus at the University of California at
San Diego, San Diego, CA, and Co-Director Emeritus of the Rose School. He received
the ACI Raymond C. Reese Structural Research Award in 1984 and 1989, the ACI
Wason Award for Most Meritorious Paper in 1997, and the ACI Arthur R. Anderson
Award in 1997. His research interests include the seismic design, assessment, and retrofit
of RC bridges and buildings; seismic design philosophy for precast concrete structures;
and development of realistic dynamic testing methods to simulate inelastic response
under seismic loading.
3. ACI Structural Journal/March-April 2011 169
with shear deformations only. If the curvature is not constant
over the height of the shear panel—as is the case for cantilever
walls—part of the difference in the lengths of the diagonals
has to be attributed to flexural deformations. This is illustrated
in Fig. 3. Consequently, Eq. (1(a)) and (1(b)) overestimate
the actual shear deformation if the curvature is not constant
over the height of the shear panel. Hiraishi10
also showed
that a term needs to be subtracted to account for the variation
of curvature over the height of the panel
(2)
where θ(hsh) is the difference of rotations at the top and bottom of
the panel of height hsh for which the shear deformations are
determined, and α is a measure for the variation of the curvature
overtheheightofthepanel.Thevaluesofαvarybetween0.5and
1 if the point of contraflexure is above the panel for which the
shear deformations are determined
(3)Δs
1
4b
------ d δ2+( )(
2
d δ1+( )
2
) α 0.5–( )θ hsh( )hsh––= α
θ z( ) zd
0
hsh
∫
θ hsh( )hsh
-----------------------=
Table 1—Cross sections of isolated cantilever walls tested under quasi-static cyclic loading that were
included in this study (all dimensions in mm; 1 mm = 0.0394 in.)
4. 170 ACI Structural Journal/March-April 2011
For a constant curvature, α is 0.5 and Eq. (2) yields the
original Eq. (1(a)) and (1(b)). If the curvature distribution is
triangular, α equates to 2/3; and if the deformations are
concentrated near the base, α tends toward unity. Provided
that the base lengths of the LVDTs measuring the elongations
of the wall edges are shorter than the height of the shear
panel, the value of α can be computed from these LVDT
measurements. Massone and Wallace19
studied a hypothetical
case and judged that four to six LVDTs with equal base
lengths over the height of one shear panel would be sufficient
to yield good estimates of α. The authors use LVDT base
lengths that vary over the wall height (Fig. 2). The base
lengths are chosen to yield good estimates of the flexural
deformations Δf, which yields generally sufficient accurate
values of α because α is a direct measure of Δf. For slender
walls, the wall is typically divided into several shear panels
over its height (Fig. 2). The shear deformations of each panel
are computed from a pair of diagonal measurements. The
shear deformation of the wall over its entire height is the sum
of the shear deformations of all panels.
EXPERIMENTAL EVIDENCE OF SHEAR
DEFORMATIONS
Distribution of shear strains within RC wall
Although the shear force in a cantilever wall subjected to
a point load at the top is constant over the height, the shear
strains are far from being evenly distributed over the height
and section once the wall has cracked and the longitudinal
reinforcement yields. This is illustrated by the results
obtained from the Demec measurements (Whitmore gauge
measurements) taken during the U-shaped wall tests, which
allow the visualization of the strain distribution over the wall
face. At each Demec measurement point, the strain state is
determined from its relative movement to its surrounding
measurement points. Demec measurements were taken on
the inside faces of the wall, whereas the outer faces were
Fig. 1—Quasi-static cyclic tests on U-shaped walls7
: (a)
test setup; and (b) loading history with cardinal points.
Fig. 2—Instrumentation of U-shaped walls7
: (a) instrumentation
suitable for determining different displacement components Δf′,
Δθ, and Δs (photo); and (b) sketch of instrumentation of one
flange. (Note: all dimensions are in mm; 1 in. = 25.4 mm.)
Fig. 3—Variation of length of shear panel diagonals: (a) for
shear; (b) for flexural deformations with constant curvature
over height; and (c) with variable curvature over height.
Fig. 4—Distribution of shear and axial strains for U-shaped
wall TUA7
at μΔ = 3.0 for Position A: (a) shear strains
obtained from Demec measurements (thin lines illustrate
Demec measurement grid, whereas thick lines represent
shear strains and grey shaded areas represent axial strains);
and (b) comparison of shear strains obtained from Demec
measurements to shear panel measurements (dashed line
represents shear strain corresponding to shear stiffness GcAw).
5. ACI Structural Journal/March-April 2011 171
used for LVDT chains and shear-panel measurements, as
described in the previous section. For example, the shear and
axial strain distribution of the U-shaped wall TUA at a
displacement ductility μΔ = 3.0 when the wall is orthogonally
loaded to its symmetry axis (Position A) is plotted in Fig. 4(a).
The figure shows that the shear strains are concentrated in
the plastic zone, particularly in areas where large tensile
longitudinal steel strains were encountered. Hence, the
results suggest that the magnitude of the shear strains is
directly linked to the magnitude of the tensile strains in the
vertical reinforcing bars. The link has also been observed,
for example, by Vallenas et al.,20
Oesterle et al.,21
and
Thomson and Wallace.14
Figure 4(b) shows a comparison of
the shear strains obtained from Demec measurements to the
shear strains obtained from the shear-panel instrumentation.
For the comparison, the Demec measurements of each wall
section (that is, the two flanges and the web) were averaged
at the heights of the Demec measurement points. The resolution
of the Demec measurements is, of course, significantly
higher over the height than the distribution of the shear
strains obtained by the shear-panel measurements; however,
the figure shows a good agreement between the two methods
of determining the shear deformations. Also included in Fig. 4
is a vertical dashed line, which corresponds to the shear
strains obtained for a shear stiffness value of 0.4EcAw, which
is recommended by FEMA 35622
for the elastic analysis of
RC walls. In this equation, Aw is the wall area between the
extreme compression fiber and the center of the tension
reinforcement, which shall be typically assumed as
0.8bwlw,23
where bw and lw are the width and length of the
wall, respectively. Assuming that the shear modulus Gc of
concrete can be estimated as 40% of the elastic modulus Ec,
the suggested shear stiffness corresponds to GcAw, which is
for Aw = 0.8Ag only approximately 7% smaller than the shear
stiffness of an elastic homogenous uncracked member. The
effective shear area of an elastic homogenous uncracked
member with a slender section is Aw = (5 + 5ν)/(6 + 5ν)Ag
24
and equates to Aw = 0.86Ag for ν = 0.2, which is a typical
Poisson’s ratio of concrete. The comparison with the shear
deformations derived from measurements underlines that
computing the shear deformation based on elastic properties
significantly underestimates the shear deformations of
members with shear cracking.19
Shear force-shear displacement hysteresis
In many analyses of RC structural walls controlled by
flexure, it is assumed that the shear stiffness of the wall
remains approximately constant after the shear crack pattern
has fully developed and the wall is loaded in the inelastic
range. Because the shear force carried by a wall only marginally
increases once the nominal yield force has been reached, this
modeling approach predicts that for displacements beyond
the yield displacement, the shear displacement remains
approximately constant, whereas the flexural displacement
increases. Experimental results show that this is not the case.
Although the behavior of the wall is dominated by flexure,
the shear displacement-shear force hysteresis in Fig. 5 is
highly nonlinear and the shear deformations increase with
increasing top displacement. The hysteresis also shows that
the shear displacement varies the most when the lateral load
is close to 0: at this point, the cracks are open along their
entire length and therefore the resistance against relative
movements of the crack interfaces is small. As a result, the
shear stiffness is very low and leads to the “pinching” of the
force-deformation hysteresis.25
To give an idea of the
difference between the two methods of evaluating the shear
displacements that were discussed in the previous section,
results for both methods—Eq. (1(a)) and (2))—are included
in Fig. 5. For the results presented herein, the difference in
peak shear displacements is between 5 and 12%. Massone and
Wallace,19
however, reported differences as large as 31% for
the two methods of evaluating the shear deformations. The
obtained difference depends on the curvature profile over the
height of the shear panel, the magnitude of the α factor, and
the ratio of shear-to-flexural deformations of the shear panel.
Variation of Δs/Δf ratio with ductility demand
The shear strain distribution (Fig. 4) and the hysteresis
curve (Fig. 5) suggest that the magnitude of the shear
deformations does not only depend on the shear force but also
depends on the inelastic flexural deformations. Experimental
evidence for the continuous growth of the shear deformations
with top displacements when the wall is loaded in the inelastic
range was presented in the 1970s by Wang et al.,26
Vallenas et
al.,20
and Oesterle et al.8,9
Vallenas et al.,20
for example,
observed that yielding of the shear and flexural mechanism
simultaneously occurs, and that even if the shear stresses were
constant over the height of the wall, shear yielding is only
observed in regions where the flexural mechanism yields.
Vallenas et al.20
also stated that for the monotonic loading, the
shear deformations “were almost a constant factor of the
flexural deformations,” whereas for specimens subjected to
cyclic loading, the ratio of shear-to-flexural deformations
“increases with the number of load reversals and intensity of
the deformation.” Vallenas et al.’s20
findings are revisited in
the following section using the results from different series of
quasi-static cyclic wall tests as evidence.
The considered test series are the following: 1) Phases I and II
of the PCA tests conducted by Oesterle et al.8,9; 2) the tests
conducted by Dazio et al.11
on rectangular walls; 3) the tests on
walls with highly confined boundary elements conducted by
Hines et al.12,13; and 4) the aforementioned tests on U-shaped
walls conducted by Beyer et al.7
The cross sections, aspect ratios,
and axial load ratios of these walls are given in Table 1. For the
walls tested by Dazio et al.11 and Beyer et al.,7 the experimental
measurements were available in electronic format and the shear
deformations were evaluated according to the method
developed by Hiraishi10
(Eq. (2)). For the tests conducted
Fig. 5—Shear displacement-shear force hysteresis for U-
shaped wall TUA7 for cycles parallel to web and restrained
wall head rotation. Plot includes shear displacements
according to Eq. (1a) and (2).
6. ACI Structural Journal/March-April 2011172
by Oesterle et al.8,9
and Hines et al.,12,13
the data were only
available in the form of plots presented in the test reports,
where the shear deformations had been evaluated
according to Eq. (1(b)); this, of course, impairs the quality
of the available results. The shear displacements reported
in these test reports, however, are considered of sufficient
accuracy for the following discussion.
Unlike Vallenas et al.,20 Dazio11 found that the ratio of shear-
to-flexural displacements of the six capacity-designed RC walls
with rectangular sections that were tested under quasi-static
cyclic loading11 remained approximately constant for the peak
displacements of all cycles in the inelastic range; this is shown
in Fig. 6(c). The ratios of shear-to-flexural displacements for the
six walls vary between approximately 0.05 and 0.13. The walls
tested by Dazio et al.11
were all capacity-designed; therefore,
their behavior was always controlled by flexure. To illustrate
the difference for walls with shear-controlled behavior, the
walls of Phase I of the PCA test series are discussed in the
following. In this test series, Oesterle et al.8
tested seven walls
with different cross sections under unidirectional cyclic loading.
No axial load was applied during these tests. Figure 6(a) shows
the ratio of shear-to-flexural displacements as a function of the
top drift. The Δs/Δf ratios in Fig. 6(a) are plotted for inelastic
cycles only—small amplitude cycles at the beginning of the test
and cycles at the end of the test when either bar fracture or web
crushing had occurred and the capacity of the wall had
significantly decreased are omitted. In the following, the
variation of the Δs/Δf ratios for top displacements corresponding
to a drift ratio of δtop ≥ 1% is discussed. For these walls, a drift
ratio of δtop ≥ 1% corresponds to a displacement ductility
between μΔ = 1.6 and 3.6, according to the yield displacements
determined by Oesterle et al.8
; hence, for δtop ≥ 1%, all walls are
undergoing inelastic deformations. Figure 6(a) shows that for
Walls R1 and B1, the Δs/Δf ratio is approximately constant over
the entire ductility range. For the other four walls (Walls R2,
B2, B3, and B5; Wall F1 is excluded because only two data
points were available), the Δs/Δf ratio tended to increase with
displacement demand for δtop ≥ 1%—that is, with increasing
top displacement, the shear deformations contributed an
increasing proportion of the total displacement. Differences
between the two groups of specimens exist not only regarding
the variation of the Δs/Δf ratio with ductility demand, but can
also be found in their failure mechanisms: The first group—
Specimens R1 and B1—failed in flexure and the shear transfer
mechanism as such did not significantly deteriorate in both
specimens. In the second group, the picture is less homogenous;
but in all specimens, the shear-transfer mechanism significantly
degraded before failure occurred. Specimens B2, B3, and B5
experienced abrasive rubbing of concrete and spalling of the
concrete along inclined cracks through the web, which was
most likely assisted by the absence of an axial force in the wall.
As a result, the cracks were not properly closed upon load
reversal and facilitated a deterioration of the crack interfaces.
From the onset of the deterioration of the web concrete, the
contribution of the shear deformations to the overall
deformations significantly increased. Specimens B2 and B5
finally failed due to web crushing, whereas Specimen B3 failed
due to fracture of the longitudinal reinforcing bars. Shortly
before the bar fracture, however, the boundary element had
sheared through. Specimen R2 was subjected to concrete
crushing and also experienced large out-of-plane deformations
due to instabilities of the wall under cyclic loading, which might
have contributed to the deterioration of the compression struts
and other parts of the shear-transfer mechanism.
Unlike the walls in the first phase, the walls that were
tested in the second phase of the PCA tests were subjected to
a constant axial load and all walls failed due to the sudden
crushing of the compression struts.9
The variation of Δs/Δf
ratios with drift demand for these walls is shown in Fig. 6(b).
Up to failure, the shear-transfer mechanism was not significantly
degrading, and the ratio of shear-to-flexural displacements
remained relatively constant (note that the cycles in which
Fig. 6—Variation of Δs/Δf ratios with top drift for cantilever RC walls tested under quasi-static cyclic loading.
7. ACI Structural Journal/March-April 2011 173
the compression strut failure occurred are not included in
Fig. 6(b) because for these cycles, the displacement components
were not evaluated in the test report9
). The same failure
mechanism was observed for Test Units 3A, 3B, and 3C by
Hines et al.12,13
(Fig. 6(d)). The remaining test units in the
study conducted by Hines et al.12,13—except for Unit 2B—
failed due to buckling and fracture of the flexural reinforce-
ment. The behavior of these test units was therefore flexure-
controlled, and the Δs/Δf ratios of these walls were also
approximately independent from the displacement demand.
Test Unit 2B failed due to yielding of the shear reinforcement.
As a result, the Δs/Δf ratios were very large (varying between
1.15 and 2.3 for drifts larger than 1%), and the corresponding
results could not be plotted in Fig. 6(d). The behavior of the
two U-shaped walls TUA and TUB (Fig. 6(e) and 6(f)) was
also flexure-controlled and again the Δs/Δf ratios did not
increase with ductility demand. Due to the bidirectional
loading of these walls, however, the demand on the web and
flanges varied considerably and led to a large variation of
Δs/Δf ratios for the different loading directions; this will be
discussed in more detail in the following section.
Although the shear-to-flexural displacement ratios vary
considerably between the walls, for all the walls whose shear
capacity did not significantly degrade, the shear-to-flexural
displacement ratios remained approximately constant. For
walls in which the shear-transfer mechanism was signifi-
cantly degrading, the Δs/Δf ratio increases as the top displace-
ment increases. One comes to the same conclusion if the stress
state due to axial load, shear force, and moment of a cracked
RC panel with parallel compression struts is considered.
Figure 7(b) shows the Mohr’s circle, representing the average
strain state of the wall panel in Fig. 7(a). The variable εd
refers to the axial strain in the compression strut (hence, εd <
0), εm refers to the mean axial strain, εh refers to the hori-
zontal strain, γ refers to the shear strain, and β refers to the
cracking angle measured against the element axis. Using the
geometric relationships within Mohr’s circle, the shear strain
γ can be expressed as follows.
(4)
The same equation is quoted in Oesterle et al.,21
but it
originates from Rabbat and Collins,28 where it was given in
a slightly different form. Although Eq. (4) only applies—
strictly speaking—to a section of the wall that is small
enough that the strain state is approximately homogenous, it
can be used for visualizing the three different contributions
to the shear strain γ. The first term represents the contribution
of the mean axial strain εm. In structural walls subjected to
seismic loading, the axial strains are chiefly caused by flexural
deformations. Given that the depth c of the compression
zone remains approximately constant once the section has
yielded, εm is directly related to the curvature φ, which
determines the flexural deformations. Therefore, the first
term of Eq. (4) shows that the shear strains are directly
related to the flexural strains. Hence, if the second and third
terms are small, the shear displacements are proportional to
the flexural displacements—this was, for example, the case
for Dazio et al.’s11
capacity-designed walls. The second
term represents the contribution of the horizontal strains in
the shear reinforcement to the shear strain and the third term
represents the contribution of the strain in the compression
γ
εm
βtan
----------- εh βtan
2εd
2βsin
--------------–+=
diagonal to the shear strain. Thus, if the behavior of the wall is
controlled by shear, and if plastic strains are accumulating in
the shear reinforcement or the compression struts are
softening considerably, the shear strains disproportionately
increase to the flexural strains. Consequently, the Δs/Δf ratio
increases with the top displacement demand. This was
observed for some of the PCA test units of Phase I and Test
Unit 2B tested by Hines et al.12,13
Variation of Δs/Δf ratio for U-shaped walls under
bidirectional loading
The previous section showed that for walls controlled by
flexure under unidirectional cyclic loading, the ratio of
shear-to-flexural displacements remains approximately
independent of the top displacement demand. This also holds
approximately true for nonrectangular walls controlled by
flexure if a specific loading direction is considered (Fig. 6(e)
and 6(f)). For different directions of loading, however, the
Δs/Δf ratios can vary significantly. This was shown by
Thomson and Wallace14 for a T-shaped wall loaded along its
symmetry axis and it is illustrated herein by means of the
U-shaped wall TUA tested under bidirectional loading.7
Figure 8(a) shows the Δs/Δf ratios of the web and flanges for
the five different directions of loading that were applied
(Fig. 1). These ratios were computed as the average ratios of
the approximately constant branches between δ ≈ 0.6% and
the ultimate drift (Fig. 6(e)). Figure 8(b) shows the forces in
the flanges and the web at peak displacements for the
different directions of loading. Note that the rotation of the
wall head about the vertical axis was restrained throughout
the loading history (exceptions are outlined in Beyer et al.7
);
as a result, the flange forces are non-zero when the wall is
loaded parallel to the web and unequally distributed when
the wall is loaded in the diagonal direction.
Although the shear forces carried by the different wall
sections (web and flanges) certainly influence the Δs/Δf
ratios, they are not the only parameter. Figure 8(a) also
shows that the Δs/Δf ratios tend to be larger if the wall section
is under net axial tension. This applies, for example, to the
web section (Δs/Δf = 0.30) when the wall is loaded to
Position E or to the flange opposite the corner that is in
compression (Δs/Δf = 0.53) when the wall is loaded to
Position F. Out of the Δs/Δf ratios shown in Fig. 8(a), the
negative ratio of the East flange (Δs/Δf = –0.09) at Position E
Fig. 7—(a) Truss analogy model for RC element with parallel
compression struts; (b) Mohr’s circle, representing strain
state at center line of wall; and (c) strain profile showing εm
and φ. Plots (a) and (b) are taken from Rabbat and Collins.28
8. 174 ACI Structural Journal/March-April 2011
is most peculiar. When loading in the diagonal direction to
Position E, the force in the East flange did not reach its peak
at the maximum displacement but dropped from the force at
zero displacement—which was required to restrain the rotation
of the wall head—to the final value at Position E. This drop
in force probably led to a reversal of the shear displacements
in the East flange. Note that the same observation was made
for the second U-shaped wall (TUB) tested by Beyer et al.7
and also for the U-shaped walls tested by Pégon et al.15-18
EMPIRICAL MODEL FOR ESTIMATING RATIO OF
SHEAR-TO-FLEXURAL DEFORMATIONS FOR
WALLS CONTROLLED BY FLEXURE
To the authors’ knowledge, there are only two equations at
present for estimating the ratio of shear-to-flexural
displacements, which are based on the observation that the
ratio of shear-to-flexural displacement is approximately
independent of the imposed ductility demand. The first is by
Hines et al.29
and the second is by Priestley et al.,30
which is
based on the work by Miranda et al.31
Neither of the two
accounts for the effect of the mean axial strain on the shear
deformations. To complement their work, a new empirical
equation is proposed for walls whose behavior is dominated
by flexure. It is based on the assumption that the ratio of shear-
to-flexural deformations in a wall whose shear-transfer
mechanism is not significantly degrading depends on the
geometry of the wall, the axial strain level within the wall,
and the cracking angle. The proposed model is based on Eq.
(4) in conjunction with the plastic hinge model (Fig. 9(c)).
Over the height of the plastic hinge length Lph, the curvature
and the mean axial strain εm are assumed as constant.
Therefore, for a given cracking angle, the shear strain γ over
Lph is also approximately constant (Eq. (4)). If it is further
assumed that the contributions of the second and third term
of Eq. (4) can be neglected and that the shear deformations
outside the plastic hinge length are negligible, then the shear
deformations can be estimated as
(5)
where β is a cracking angle representative of the fanned
crack pattern (Fig. 9(a)). The flexural deformations, on the
other hand, are computed assuming that all inelastic flexural
deformations can be ascribed to the plastic hinge mechanism.
(6)
The ratio of shear-to-flexural deformations can therefore
be written as
(7)
where the quantities εm and φ are the axial strain at the center
of the wall sections and the curvature, respectively, and are
derived from the moment-curvature analysis. In this study,
εm and φ were evaluated for the walls described in Table 1
for a maximum steel strain of 1.5%. The ratio εm-φ, however,
remains typically quite stable along the inelastic branch of
the moment-curvature relationship. For the U-shaped walls,
moment-curvature analyses were carried out in the five
different directions of loading that were applied during
testing. For each direction of loading, the εm-φ ratios
corresponding to the three wall sections of the U-shaped
wall (web and two flanges) were determined by extracting
the axial strain at the center of the wall section and dividing
it by the curvature component associated with the in-plane
bending moment of this wall. For a given ratio εm-φ (that is,
for a given ratio of the compression zone c to the wall length
lw; refer to Fig. 7(c)), Eq. (7) yields that Δs/Δf is proportional
to lw/Hn. Equation (7) is therefore mainly a geometric
relationship. It also accounts, however, for the fact that for
the same wall subjected to different loading conditions, the
εm-φ ratio might be different, as it was observed for U-shaped
walls under bidirectional loading.
Δs γLph
εm
βtan
-----------Lph≈ ≈
Δf θ Hn φ Lph Hn⋅ ⋅≈⋅≈
Δs
Δf
-----
εm
φ βtan⋅
-------------------
1
Hn
------≈
Fig. 8—For U-shaped wall TUA7
: (a) average Δs/Δf ratios;
and (b) actuator forces loading web and flanges at μΔ = 4.0.
(Note: actuator forces are in kN; 1 kip = 4.448 kN.)
Fig. 9—Plastic hinge method: (a) crack pattern; (b) true
curvature profile; and (c) plastic curvature profile assumed
in plastic hinge method.
9. ACI Structural Journal/March-April 2011 175
Because Eq. (7) is the result of a very simple concept
regarding the shear deformations in conjunction with the
plastic hinge model, it cannot capture the exact real behavior
but only the main parameters that influence Δs/Δf. In particular,
the following approximations are expected to affect the
accuracy of Eq. (7):
• The plastic hinge length is calibrated to provide the best
estimate of the top displacement Δf for a given curvature φ.
The area underneath the curvature profile associated with
the plastic hinge mechanism (Fig. 9(c)) is typically smaller
than the area underneath the true curvature profile
(Fig. 9(b)). Based on the observation that curvature
and axial strain are directly proportional, the shear
deformations are proportional to the area underneath
the curvature profile. Hence, by approximating the
structure with the plastic hinge mechanism in Fig. 9(c),
the shear deformations are underestimated.
• Neglecting the second and third terms of Eq. (4), which
represent the shear deformations due to strain in the
horizontal reinforcement and strain in the compression
strut, also underestimates the shear deformations.
• On the other hand, Eq. (7) will overestimate the Δs/Δf
ratios because Eq. (6) is likely to underestimate the
flexural deformations for a given curvature φ due to the
fact that the elastic flexural displacement is also estimated
on the basis of the plastic hinge model. Because Lph is
smaller than Hn/3 for slender walls, the curvature profile
associated with elastic deformations leads to a larger
top displacement Δf for the same base curvature than
the plastic hinge mechanism.
• Equation (7) is written as a function of a cracking angle
β, which is representative of the plastic zone where the
crack pattern is like a fan and the cracking angles vary
between 90 degrees and β (Fig. 9(a)). It is desirable to
express Eq. (7) as a function of the cracking angle β,
which is the cracking angle outside the fan where
cracks are approximately parallel. Hence, a correction
factor should also account for the fact that the quotient
1/tan β is smaller than 1/tan β.
These approximations increase the scatter of the
predicted-to-experimental Δs/Δf ratios but also bias the
predicted Δs/Δf ratios. From the analysis of the walls
considered in this study, it was found that a good estimate of
a correction factor C1 is 1.5. With C1 = 1.5, Eq. (7) can be
written as a function of 1/tan β as
(8)
Equation (8) is applied to a database of walls that includes
the walls tested by Oesterle et al.,8,9
Dazio et al.,11
Hines et
al.,12,13 and Beyer et al.,7 which were already discussed in
previous sections of this paper. Only those walls are included
for which the experimentally determined Δs/Δf ratios were
found to be approximately constant for top displacements
corresponding to displacement ductilities larger than
approximately 2. In addition, the U-shaped walls tested by
Pégon et al.15-18
and the tests on rectangular and T-shaped
walls by Thomson and Wallace14
are considered (Table 1).
The data for the U-shaped wall tests by Pégon et al.15-18 were
available in electronic format and the shear deformations
were evaluated according to the method developed by
Hiraishi10
(Eq. (2)). For the tests conducted by Thomson and
Δs
Δf
----- 1.5
εm
φ βtan
---------------
1
Hn
------=
Wallace,14
the flexural deformations were computed as Δf =
Δ – Δs because the variation of curvature over the height of
the wall was not measured. The shear deformations were
computed by Thomson and Wallace14
according to the
method developed by Hiraishi,10
assuming a value of 2/3 for α.
Figure 10 shows the comparison of the Δs/Δf ratios
predicted with Eq. (8) and the experimentally determined
ratios. These predictions were obtained using the cracking
angles observed during the experiments. For design
purposes, the cracking angle needs to be estimated. As an
approximate estimate, a cracking angle of 45 degrees can be
assumed. A better estimate is obtained with the following
equation by Collins and Mitchell32
(9)
where jd is the lever arm between the compression and
tensile resultant; V is the shear force; f1 is the tensile strength
orthogonal to the crack, which can be estimated as a function
of the cracking stress and the strain orthogonal to the
crack32
; bw is the wall thickness; and Asw, fyw, and s are the
area, yield strength, and spacing of the shear reinforcement,
respectively. For most of the considered walls, the agreement
between the predicted and experimentally determined Δs/Δf
ratios in Fig. 10 is satisfactory. The exceptions are the
negative ratios of the U-shaped walls, which cannot be
captured (refer to the previous section). It is emphasized that
the variety of methods for measuring and evaluating the
shear deformations causes an inter-test series variability of
the Δs/Δf ratios, which adds to the generally known scatter of
shear-related quantities. The error can be assessed by
comparing the sum of the displacement components to the
total measured displacements. For example, for Test Units R1
and B1 of Phase I of the PCA tests, the sum of the shear and
flexural displacements is approximately 15% larger than the
measured total displacement. Part of the discrepancy can be
attributed to evaluating the shear displacements according to
Eq. (1(b)), which overestimates the shear displacements,
rather than using Eq. (2). As an alternative, the shear
deformations could be evaluated as the difference between the
total and flexural deformations—that is, Δs = Δ – Δf. With this
approach, the average Δs/Δf ratios of Test Units R1 and B1
would decrease from 0.33 and 0.36 to 0.15 and 0.21,
respectively, which would agree significantly better with the
β tan
1– jd
V
----- f1bw
Aswfyw
s
---------------+
⎝ ⎠
⎛ ⎞
⎝ ⎠
⎛ ⎞ 90°<=
Fig. 10—Comparison of predicted Δs/Δf ratios to ones
determined from experimental measurements.
10. ACI Structural Journal/March-April 2011176
predicted Δs/Δf ratios. This example illustrates the large
sensitivity of the Δs/Δf ratios to the selected evaluation method.
Despite these uncertainties, Fig. 10 shows that Eq. (8) is able to
capture the general trend in the variation of the Δs/Δf ratios.
SUMMARY AND CONCLUSIONS
At present, when slender RC structural walls controlled by
flexure are modeled by means of beam elements and
analyzed for their seismic behavior in the inelastic range, it
is often assumed that the shear stiffness remains constant
throughout the loading process and that the shear deformations—
once the nominal strength is reached—do not increase. The
purpose of this paper was to show by means of experimental
results from quasi-static tests on RC structural walls that
these assumptions do not hold true. Many of the observations
are not new but have already been made as early as the 1970s
by Wang et al.,26 Vallenas et al.,20 and Oesterle et al.,8,9,21
who all observed that for increasing top displacements, the
ratio of shear-to-flexural displacements remained either
approximately constant or even grew with increasing
displacement demand. Based on their findings and the
evaluation of other quasi-static cyclic tests, the following
observations were made:
• For RC walls forming a flexural hinge and a stable
shear-transfer mechanism, the ratio of shear-to-flexural
displacement remains approximately constant over the
entire ductility range once the walls have reached their
nominal strength. A stable shear-transfer mechanism
requires that the shear reinforcement remain largely
elastic, the concrete diagonal does not crush, and other
mechanisms—such as the abrasive rubbing of concrete
along inclined cracks—are limited. For these walls, the
shear stiffness at peak displacements decreases in a
similar proportion as the flexural stiffness of the structural
wall. This behavior was observed for walls whose behavior
was controlled by flexure. It seems also applicable for
the cycles before the onset of crushing to walls that
failed due to sudden crushing of the concrete diagonal.
• If the shear-transfer mechanism is significantly degrading,
the shear deformations increase in larger proportion
than the flexural deformations. For these walls, the ratio
of shear-to-flexural displacements tends to increase
with ductility demand. In these cases, the Δs/Δf ratios
are also strongly dependent on the loading history. This
behavior was observed for walls whose behavior was
controlled by shear.
• The shear strain distribution over a wall is not even.
Demec measurements showed that shear strains concentrate
in regions where the axial strains are large—that is, in
regions where the wall undergoes inelastic deformations.
This was also confirmed by the experimental results of
U-shaped walls, which showed that the Δs/Δf ratios
were particularly large for those wall sections and loading
directions that led to large tensile strains in the considered
wall section.
• For nearly half of the considered cantilever walls (the
different loading directions and wall sections of the U-
shaped walls were separately counted), the shear
deformations constituted more than 20% of the flexural
deformations when the walls responded in the inelastic
range. Hence, the shear deformations of RC walls—even
if they are controlled by flexure—should be considered
when analyzing the seismic behavior of such walls. The
contribution of the shear deformations to the total
deformation is larger for shorter walls. Even in very
slender walls, however, the shear flexibility of walls
might need to be considered when assessing interstory
drifts at the level where the flexural deformations
concentrate. Due to shear deformations, the interstory
drifts at this level will be appreciably larger than
anticipated if only flexural deformations are considered.
Therefore, deformation demands on other structural and
nonstructural elements at this level will also be larger.
• The results were summarized in a simple model for
estimating the Δs/Δf ratios for walls controlled by flexure.
Such estimates allow the engineer to evaluate the
expected shear deformations based on the flexural
displacement or to compute approximate shear stiffnesses
for a given top displacement level that can be used in
conjunction with beam models. An example in which
this method has been applied is given in Beyer et al.33
The analysis of the different walls has also shown that—
unlike for flexural displacements—different evaluation
techniques have been used for evaluating the experimental
shear displacements. Some of these methods have been
found erroneous10
and should not be used when computing
the shear displacement component from structural wall tests.
This will also contribute to a more homogenous set of
experimental data for shear deformations and help to reduce
the inter-serial scatter between test series.
ACKNOWLEDGMENTS
The authors would like to thank P. Pégon from the Joint Research Centre
(JRC) in Ispra, Italy, for sharing the test data and reports of the U-shaped
wall tests that were carried out at the JRC. The authors would also like to
thank J. W. Wallace from the University of California, Los Angeles, CA, for
making the report on the tests he performed at Clarkson University available.
REFERENCES
1. Vecchio, F. J., and Collins, M. P., “The Modified Compression-Field Theory
for Reinforced Concrete Elements Subjected to Shear,” ACI JOURNAL,
Proceedings V. 83, No. 2, Mar.-Apr. 1986, pp. 219-231.
2. Bentz, E., Response-2000, Shell-2000, Triax-2000, Membrane-2000 User
Manual, University of Toronto, ON, Canada, 2001, 85 pp.
3. Wong, P. S., and Vecchio, F. J., VecTor2 and Formworks User’s Manual,
University of Toronto, ON, Canada, 2002, 213 pp.
4. CSI, “PERFORM 3Dv4—Nonlinear Analysis and Performance
Assessment for 3D Structures,” Computer and Structures, Inc., Berkeley, CA,
2006, 328 pp.
5. Bathe, K.-J., Finite Element Procedures, Prentice Hall, Upper Saddle River,
NJ, 1996, 1037 pp.
6. Taucer, F. F.; Spacone, E.; and Filippou, F. C., “A Fiber Beam-Column
Element for Seismic Response Analysis of Reinforced Concrete Structures,”
Report No. UCB/EERC-91-17, University of California, Berkeley, Berkeley,
CA, 1991, 139 pp.
7. Beyer, K.; Dazio, A.; and Priestley, M. J. N., “Quasi-Static Cyclic Tests of
Two U-Shaped Reinforced Concrete Walls,” Journal of Earthquake
Engineering, V. 12, No. 7, 2008, pp. 1023-1053.
8. Oesterle, R. G.; Fiorato, A. E.; Johal, L. S.; Carpenter, J. E.; Russell, H. G.;
and Corley, W. G., “Earthquake Resistant Structural Walls—Tests of Isolated
Walls,” Report to National Science Foundation, PCA Construction Technology
Laboratories, Skokie, IL, 1976, 317 pp.
9. Oesterle, R. G.; Aristizabal-Ochoa, J. D.; Fiorato, A. E.; Russell, H. G.;
and Corley, W. G., “Earthquake Resistant Structural Walls—Tests of Isolated
Walls—Phase II,” Report to National Science Foundation, PCA Construction
Technology Laboratories, Skokie, IL, 1979, 332 pp.
10. Hiraishi, H., “Evaluation of Shear and Flexural Deformations of Flexural
Type Shear Walls,” Bulletin of the New Zealand Society for Earthquake
Engineering, V. 17, No. 2, 1984, pp. 135-144.
11. Dazio, A.; Wenk, T.; and Bachmann, H., “Versuche an
Stahlbetontragwänden unter Zyklisch-Statischer Einwirkung (Quasi-Static
Cyclic Tests on RC Structural Walls),” Report No. 239, ETH, Zurich,
Switzerland, 1999, 160 pp.
12. Hines, E. M.; Seible, F.; and Priestley, M. J. N., “Cyclic Tests of Structural
Walls with Highly-Confined Boundary Elements,” Report No. SSRP-99/15,
University of California, San Diego, San Diego, CA, Aug. 1999, 266 pp.
11. ACI Structural Journal/March-April 2011 177
13. Hines, E. M.; Dazio, A.; and Seible, F., “Seismic Performance of Hollow
Rectangular Reinforced Concrete Piers with Highly-Confined Boundary
Elements Phase III: Web Crushing Tests,” Report No. SSRP-2001/27, University
of California, San Diego, San Diego, CA, June 2002, 239 pp.
14. Thomson IV, J. H., and Wallace, J. W., “Displacement-Based Design of
RC Structural Walls: An Experimental Investigation of Walls with
Rectangular and T-Shaped Cross Sections,” Report No. CU/CEE-95/06,
Clarkson University, New York, 1995, 373 pp.
15. Pégon, P.; Plumier, C.; Pinto, A.; Molina, J.; Gonzalez, P.; Colombo, A.;
Tognoli, P.; Hubert, O.; and Tirelli, D., “U-Shaped Walls: Description of the
Experimental Set-Up,” TMR-ICONS-TOPIC5, JRC Special Publication No.
I.00.141, JRC Ispra, Italy, 2000, 40 pp.
16. Pégon, P.; Plumier, C.; Pinto, A.; Molina, J.; Gonzalez, P.; Tognoli, P.; and
Hubert, O., “U-Shaped Walls: Quasi-Static Test in the X and Y Directions—Test
Report,” TMR-ICONS-TOPIC5, JRC Ispra, Italy, 2000, 25 pp.
17. Pégon, P.; Plumier, C.; Pinto, A.; Molina, J.; Gonzalez, P.; Tognoli, P.; and
Hubert, O., “U-Shaped Walls: Quasi-Static Test in the Y Direction—Test
Report,” TMR-ICONS-TOPIC5, JRC Ispra, Italy, 2000, 19 pp.
18. Pégon, P.; Plumier, C.; Pinto, A.; Molina, J.; Gonzalez, P.; Tognoli, P.; and
Hubert, O., “U-Shaped Walls: Quasi-Static Test in the X Direction—Test
Report,” TMR-ICONS-TOPIC5, JRC Ispra, Italy, 2000, 25 pp.
19. Massone, L. M., and Wallace, J. W., “Load-Deformation Response of
Slender Reinforced Concrete Walls,” ACI Structural Journal, V. 101, No. 1, Jan.-
Feb. 2004, pp. 103-113.
20. Vallenas, J. M.; Bertero, V. V.; and Popov, E. P., “Hysteretic Behaviour
of Reinforced Concrete Structural Walls,” Report No. UBC/EERC-79/20,
University of California, Berkeley, Berkeley, CA, 1979, 234 pp.
21. Oesterle, R. G.; Aristizabal-Ochoa, J. D.; Shiu, K. N.; and Corley, W. G.,
“Web Crushing of Reinforced Concrete Structural Walls,” ACI JOURNAL,
Proceedings V. 81, No. 3, May-June 1984, pp. 231-241.
22. FEMA 356, “Prestandard and Commentary for the Seismic
Rehabilitation of Buildings,” Federal Emergency Management Agency,
Washington, DC, 2000, 518 pp.
23. ACI Committee 318, “Building Code Requirements for Structural
Concrete (ACI 318-08) and Commentary,” American Concrete Institute,
Farmington Hills, MI, 2008, 473 pp.
24. Timoshenko, S. P., Theory of Elasticity, McGraw-Hill, New York, 1934.
25. Park, R., and Paulay, T., Reinforced Concrete Structures, John Wiley &
Sons, Inc., New York, 1975, 800 pp.
26. Wang, T. Y.; Bertero, V. V.; and Popov, E. P., “Hysteretic Behaviour of
Reinforced Concrete Framed Walls,” Report No. UBC/EERC-75/23, University
of California, Berkeley, Berkeley, CA, 1975, 367 pp.
27. Dazio, A., “Entwurf und Bemessung von Tragwandgebäuden unter
Erdbebeneinwirkung (Seismic Design of Buildings with Structural Walls),” PhD
thesis No. 13739, ETH, Zurich, Switzerland, 2000, 229 pp.
28. Rabbat, B. G., and Collins, M. P., “A Variable Angle Space Truss Model
for Structural Concrete Members Subjected to Complex Loading,” Proceedings
of the Douglas McHenry International Symposium on Concrete and Concrete
Structures, SP-55, American Concrete Institute, Farmington Hills, MI,
1978, pp. 547-587.
29. Hines, E. M.; Restrepo, J. I.; and Seible, F., “Force-Displacement
Characterization of Well-Confined Bridge Piers,” ACI Structural Journal, V. 101,
No. 4, July-Aug. 2004, pp. 537-548.
30. Priestley, M. J. N.; Calvi, G. M.; and Kowalsky, M. J., Displacement-
Based Seismic Design of Structures, IUSS Press, Pavia, Italy, 2007, 721 pp.
31. Miranda, P. A.; Calvi, G. M.; Pinho, R.; and Priestley, M. J. N.,
“Displacement-Based Assessment of RC Columns with Limited Shear
Resistance,” Report ROSE-2005/04, IUSS Press, Pavia, Italy, 176 pp.
32. Collins, M. P., and Mitchell, D., Prestressed Concrete Structures,
Response Publications, Toronto, ON, Canada, 1997, 766 pp.
33. Beyer, K.; Dazio, A.; and Priestley, M. J. N., “Inelastic Wide-Column
Models for U-Shaped Reinforced Concrete Walls,” Journal of Earthquake
Engineering, V. 12, No. SP1, 2008, pp. 1-33.