Download as PDF, PPTX


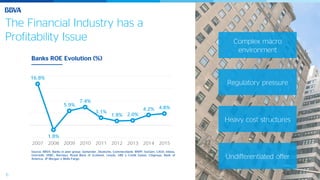


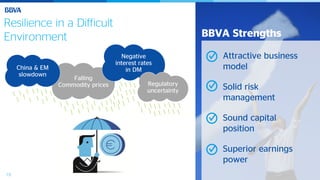

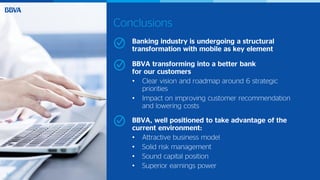


The document outlines BBVA's strategies and projections presented at the Morgan Stanley European Financials Conference 2016, emphasizing the challenges and transformations within the financial industry. It discusses BBVA's customer-centric model, digital advancements, and strong risk management in the context of macroeconomic pressures and regulatory changes. The aim is to enhance customer experience and operational efficiency while maintaining robust capital and risk profiles.


