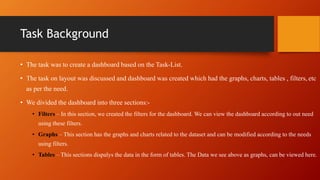
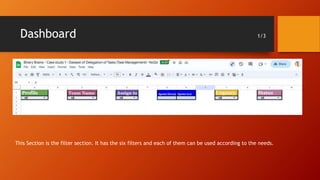
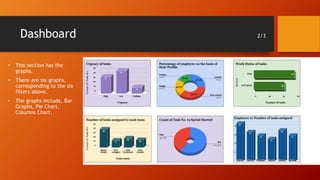
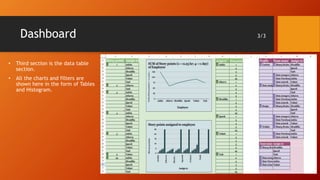
Binary Brains
Introduction
• We are Binary Brains, a team of 5 ,out of the world , like-minded,
curious mates who came as a team and worked on the task given
to us an Analyst.
• Vaishnavi : Created the dashboard.
• Shipra & Abhay : Worked on the Powerpoint.
• Roshan & Ankit : Presenters
Task Background
• The task was to create a dashboard based on the Task-List.
• The task on layout was discussed and dashboard was created which had the graphs, charts, tables , filters, etc
as per the need.
• We divided the dashboard into three sections:-
• Filters – In this section, we created the filters for the dashboard. We can view the dashboard according to out need
using these filters.
• Graphs – This section has the graphs and charts related to the dataset and can be modified according to the needs
using filters.
• Tables – This sections dispalys the data in the form of tables. The Data we see above as graphs, can be viewed here.
Dashboard 1/3
This Section is the filter section. It has the six filters and each of them can be used according to the needs.
Dashboard 2/3
• This section has the
graphs.
• There are six graphs,
corresponding to the six
filters above.
• The graphs include, Bar
Graphs, Pie Chart,
Columns Chart.
Dashboard 3/3
• Third section is the data table
section.
• All the charts and filters are
shown here in the form of Tables
and Histogram.
Key-Finding
Data Trend
• Through data analysis, we identified the
urgency of the tasks.
• We can also identify the percentage of the
employee on the basis of their profile.
• We can also see the work status of the task
set.
Team Trend
• We can see the number of tasks
assigned to each team.
• We also have the Employee vs Task
graph.
Conclusion
• This dashboard will provide all the insights which are can be used to
describe the dataset.
• It has all the necessary graphs, charts, and tables and is well mentioned for
the analysis.
Thank You
You were a great audience. Your feedback is appreciated.

BB- PPt.pptx

  • 1.
  • 2.
    Introduction • We areBinary Brains, a team of 5 ,out of the world , like-minded, curious mates who came as a team and worked on the task given to us an Analyst. • Vaishnavi : Created the dashboard. • Shipra & Abhay : Worked on the Powerpoint. • Roshan & Ankit : Presenters
  • 3.
    Task Background • Thetask was to create a dashboard based on the Task-List. • The task on layout was discussed and dashboard was created which had the graphs, charts, tables , filters, etc as per the need. • We divided the dashboard into three sections:- • Filters – In this section, we created the filters for the dashboard. We can view the dashboard according to out need using these filters. • Graphs – This section has the graphs and charts related to the dataset and can be modified according to the needs using filters. • Tables – This sections dispalys the data in the form of tables. The Data we see above as graphs, can be viewed here.
  • 4.
    Dashboard 1/3 This Sectionis the filter section. It has the six filters and each of them can be used according to the needs.
  • 5.
    Dashboard 2/3 • Thissection has the graphs. • There are six graphs, corresponding to the six filters above. • The graphs include, Bar Graphs, Pie Chart, Columns Chart.
  • 6.
    Dashboard 3/3 • Thirdsection is the data table section. • All the charts and filters are shown here in the form of Tables and Histogram.
  • 7.
    Key-Finding Data Trend • Throughdata analysis, we identified the urgency of the tasks. • We can also identify the percentage of the employee on the basis of their profile. • We can also see the work status of the task set. Team Trend • We can see the number of tasks assigned to each team. • We also have the Employee vs Task graph.
  • 8.
    Conclusion • This dashboardwill provide all the insights which are can be used to describe the dataset. • It has all the necessary graphs, charts, and tables and is well mentioned for the analysis.
  • 9.
    Thank You You werea great audience. Your feedback is appreciated.