
Recommended
More Related Content
Viewers also liked
Similar to How Big Data Dominated My Fantasy Baseball Leagues
Similar to How Big Data Dominated My Fantasy Baseball Leagues (20)
How Big Data Dominated My Fantasy Baseball Leagues
- 1. How I Used Big Data to Dominate My Fantasy Baseball Leagues – And What You Can Get From It With Zero Stats Expertise I started playing fantasy baseball over a decade ago, but I was never all that successful. I had research to do, classes to take and then classes to teach. Working 50 or more hours a week and juggling the various jobs of graduate school didn’t leave much time to adjust my lineups every day. On the other hand, I had developed some big data skills while working on my dissertation. Last year I decided it was time to turn the tables. This is the story of how I used big data to go from one championship with my first 30 fantasy baseball teams to winning four of my five leagues last year. It wasn’t because I got lucky on draft day. My teams that finished in the 99th percentile of ESPN’s leagues turned over half the original rosters. Once I finished my dissertation I decided to celebrate by doing a little side project to help figure out which players to add and drop in the middle of a season. My goal was a little different than a professional general manager or even someone playing daily fantasy sports on a professional basis. I already knew that the day-to-day performance of baseball players was highly volatile. A large bankroll to afford hundreds of entries today was more valuable for daily fantasy sports than my skill set. I just finished graduate school, so I didn’t exactly have that kind of bankroll! (I also realized DFS would be highly vulnerable to insider trading because knowing others’ roster choices was extremely valuable, and months later the industry fell under heavy scrutiny for this behavior.) I posted a lot of this on my blog after last season – it probably helped me get my current internship with Baseball Prospectus – but I wanted to revise that posting for a broader audience that may not be as familiar with statistics. You won’t need any special information to use my strategy to help you win your fantasy leagues this year. I designed my study to help people without advanced stats training make good decisions quickly by testing whether ESPN and Yahoo’s default “player rater” was the most useful information. The short answer is no for hitters and yes for pitchers. ESPN defaults to giving one aggregate metric of player value and their ranking compared to other players over the last 15 days. For Yahoo it’s the last two weeks. Inexperienced fantasy baseball owners rely solely on this heuristic to make decisions. In 2016 ESPN redesigned their app to shove these ratings in your face and make it harder to get the full range of data that ESPN provides. This is fine for pitchers, who tend to be streaky when it comes to allowing home runs. However, a hitter’s hot streak isn’t very sustainable. Switching from the 15 day player rater to the 30 day or full season player rater for hitters let me win four of my five leagues while spending less than 10 minutes a day on fantasy baseball. Our Eyes Can Deceive Us Baseball is notorious for streaky home run hitters. Lucas Duda hit three home runs in his first 41 games last year. He hit six in his next 7 games, then went another 35 games with only one home run. Duda eventually hit 27 home runs. Daniel Murphy hit five home runs
- 2. before the All Star break last year then homered in six straight playoff games. As humans, we tend to remember these hot and cold streaks. We’re not very good at comparing Duda’s hot and cold 27 home run season to Curtis Granderson’s more consistent 26 home run season. Home runs are rare events. Most players do not hit a home run in a particular game. The number of home runs a player hits in a season does not follow a bell curve. Many players would hit 12-15 homers over a full season, while Chris Davis hit 47 last year. Abnormal distributions are actually pretty common when we are counting how often a person or organization does something. How many books have you read this year? How many employees have you hired? Some people or organizations will be unusually active and stretch the distribution. Most of my dissertation focused on statistical models for counts (like the volume of news coverage after a media event) and rare events (how often was a particular phrase used online in a particular 15 minute window). I had the perfect skills to create a regression model for hitting home runs. Building a Big Data Model At the beginning of a fantasy baseball season it is fine to look at a player’s performance over the last season or last few seasons to make initial evaluations for the current season. However, baseball players fluctuate from these projections during the season. ESPN and Yahoo player raters try to assign one number to these fluctuations. How much should we worry about those ebbs and flows? To find out, I needed to get play-by-play information on a daily basis. I went to Retrosheet, which provides this information for free, and downloaded the 2010-14 play-by-play databases (remember I did all the stats a year ago). The first thing I needed to do with this data was create some measure of how good a particular player was at hitting home runs, driving in runs, and so on over a particular period of time. I had to create my own kind of player rater. To keep this posting a manageable length, I will just focus on home runs, because they are the play with the largest impact. I started by counting the number of home runs a player hit over a certain number of games. This helped me evaluate players like Nelson Cruz or Troy Tulowitzki, who can be very productive when healthy but because injuries have limited their playing time. As any baseball fan knows, it is much easier to hit home runs in certain ballparks than others. So the next thing I did was calculate how many home runs (and singles, strikeouts, etc.) occurred at a particular park in a particular year. All pitcher hitting was excluded, to make the National and American League stats directly comparable. I divided the number of home runs, singles and so on by the number of plate appearances to create a metric for an average player’s expected performance when they played in that stadium. Then I matched a players’ actual performance to the expected performance. This is more detailed than just looking at which team someone plays for. A player who plays half their games in San Francisco (a notoriously difficult park for home runs) also visits Colorado and Arizona (home run havens).
- 3. My first measure of “home run skill” was the actual number of home runs hit minus the expected number of home runs for an average player taking the same plate appearances in those ballparks. A player who does “as expected” would get a 0. The lowest value over a full season of 162 starts was 23 home runs below expected. The highest value was 36.775. Unlike other metrics, this carries skill over from year-to-year. I also measured skill over other time periods. If we look at a player’s last fifteen starts, home run skill ranges from - 2.589 to 8.268, because fifteen games isn’t as much time for Chris Davis to differentiate himself from Ben Revere. Standardized Skill Player raters on ESPN and Yahoo do not give raw counts. These sites are sophisticated enough to know that home runs are rarer than runs scored. That’s why players are measured in how many standard deviations they are away from the mean on a particular statistic. Measuring skill in standard deviations also lets them but performance over the last 15 days and over the same season on the same scale. This is a very wise move, and something I need to do for myself. Thankfully it is very easy to standardize variables. This has one important side effect: really hot players will be further away from the mean over short time periods like 15 games, but over 162 games we will see some regression to the mean. Choosing Regression Models Choosing the best form of regression for looking at home runs is more difficult than it would appear. [As a warning, the following two paragraphs will refer to regression models that were not taught in the required statistics classes in my PhD program. I give a technical explanation for how I did the best I could with freely available information, but someone looking to make decisions on a professional basis would want to invest in better data.] Basic ordinary least squares regression could work, but it is unlikely to be the best option. Like I explained earlier, the number of home runs someone hits in a game does not follow a normal bell curve distribution. The most common outcome is someone hitting zero home runs. Negative binomial regressions seem ideally suited to this kind of rare outcome. I used them throughout my dissertation. Unfortunately, none of the negative binomial regressions I have tried so far have converged successfully, for any hitting outcome. (Negative binomial regression models are notorious for this.) I also tried zero-inflated negative binomial regression, a complex two-stage process that assumes certain parks will enable or suppress home runs and then looks at players’ skill, but they also failed to converge. As a result, the best model that actually converges on some kind of prediction equation is a Poisson model. Poisson models are designed for counting things that are specific units and don’t quite have a bell curve distribution because a few people have unusually large counts. Home runs hit in a season is a perfect example. The number of languages someone speaks is another good example. Poisson would make a lot of sense for hits per game, but wasn’t my first choice for looking at home runs. I felt confident enough to use these results to use them in my fantasy leagues, but I’m not sure I’d use them if I was a real life general
- 4. manager. Teams should have better proprietary data – all of my work here is based on publicly available information. Regression Model 1: A Baseline of Long Term Skill To start off, let’s see if a player’s long-term track record predicts whether they are more likely to hit a home run today. If players who hit more home runs over a 162 game season are not more likely to hit more home runs today, then hitting a home run today would be almost completely random. The outcome is the number of home runs a player hits in a particular game. To make sure I am comparing apples to apples, I am limiting this to players who start. Because fantasy baseball rewards home runs per game and not per plate appearance, I did not include any other controls for plate appearances per game. In the regression model I only use one independent variable: home run skill based on a player’s last 162 starts. If a player had yet to start 162 games before the game in question, they are excluded from the regression model. This is a very strict limitation. My database has 206,008 position player starts over five seasons but only 105,484 valid observations for the first regression model. One reason for this is I used the entire 2010 season is used as seed data to establish players’ track record to predict performances starting in 2011. The other reason is some players are not good enough to get 162 major league starts. Every player was used to calculate expected performance, but only players good enough to stay in the majors will be in my regression model. This means the players who are actually in my analysis are slightly above the average MLB player. Remember, we’re trying to figure out if the long term data that exists is better than short term hot streaks.. . poisson hr_pg hr162 if under162gs!=1 Iteration 0: log likelihood = -37885.596 Iteration 1: log likelihood = -37885.596 Poisson regression Number of obs = 105484 LR chi2(1) = 1893.60 Prob > chi2 = 0.0000 Log likelihood = -37885.596 Pseudo R2 = 0.0244 ----------------------------------------------------------------------------- hr_pg | Coef. Std. Err. z P>|z| [95% Conf.Interval] -------------+--------------------------------------------------------------- hr162 | .3843963 .0087115 44.12 0.000 .367322 .4014706 _cons | -2.238728 .0097242 -230.22 0.000 -2.257787 -2.219669 ------------------------------------------------------------------------------ These results fit our expectations. A player who is one standard deviation better at hitting home runs over his prior 162 starts will hit e ^ 0.3843983 = 1.46872 times as many home runs in the current game, as compared to the average player hitting in those ballparks. Since Poisson is an exponential regression model, the top home run hitters would be expected to hit more than twice the home runs in any game. Don’t get too excited though. The very large and negative coefficient tells us that hitting home runs is still rare. One way to examine this is with Stata’s “margins” command, which allows us to predict the number
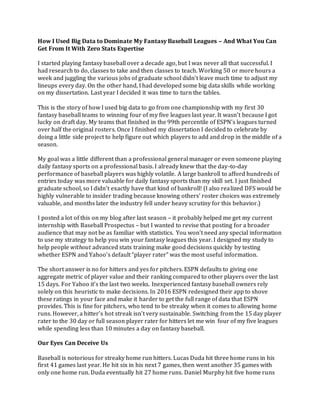
- 5. of home runs someone hits per game at different levels of skill. For illustration I chose -2 standard deviations of skill, -1, 0, +1, +2 and +3. * Standard errors for each estimate range from .001 to .008, so a 95 percent confidence interval would not be visible in this graph. Based on this regression model, a player with average skill at hitting home runs would hit .106 homers per game they start. If we do a little back of the envelope math and assume four plate appearances per start, that translates to one home run per every 37.735 plate appearances. Home runs are pretty rare, even for hitters who do an average job at hitting home runs. Well above average power is extremely valuable and scarce – something to remember for next year’s drafts. A player with +2 standard deviations of home run hitting skill, based on their track record over 162 games, would hit 0.2299 home runs per game they start. It’s more than double what the average power hitter would accomplish. Regression Model 2: Adding Short Term Hot Streaks Now let’s add a measure of short-term success hitting home runs. I chose 15 starts, because I was playing on ESPN leagues that default to showing player ratings over the last 15 games. In the interests of time, I will skip the regression model with short-term streaks as the only independent variable. One potential problem is a home run a player hit yesterday would show up in my short term and long term variables. To correct for this I created a slightly different long term variable: home run hitting skill in the previous 16-162 starts. This way short term and long term skill are mutually exclusive. . poisson hr_pg hr15 hr162_b if under162gs!=1 Iteration 0: log likelihood = -37884.932 Iteration 1: log likelihood = -37884.932 0 0.05 0.1 0.15 0.2 0.25 0.3 0.35 -2 1 0 1 2 3 HR Skill (162 GS) Predicted # of Home Runs Hit Today, By Long Term HR Skill Only
- 6. Poisson regression Number of obs = 105484 LR chi2(2) = 1894.93 Prob > chi2 = 0.0000 Log likelihood = -37884.932 Pseudo R2 = 0.0244 ------------------------------------------------------------------------------ hr_pg | Coef. Std. Err. z P>|z| [95% Conf. Interval] -------------+---------------------------------------------------------------- hr15 | .0716725 .0090748 7.90 0.000 .0538863 .0894587 hr162_b | .3473053 .0095419 36.40 0.000 .3286035 .3660071 _cons | -2.244009 .0097878 -229.27 0.000 -2.263193 -2.224825 ------------------------------------------------------------------------------ If streaks like Daniel Murphy’s record in last year’s playoffs were completely random and have no carry over, we would expect to see a coefficient of 0 for the home runs in the last 15 starts variable. The value is greater than zero. This means there is some short-term effect that carried over from game to game. However, it’s not very big. Here is a graph based on a margins command for home run skill over the past 15 starts: I might be able to publish this finding as evidence of a “hot hand” in baseball. It is significant at the p < 0.001 level. However, I read these results as a warning against picking up the hot hand in fantasy baseball. Long-term track records of hitting home runs are much more important. If I drop an established home run hitter on a cold streak for a random guy suddenly hitting homers, the move will probably backfire. I won one of my leagues by scooping up veteran hitters on cold streaks, taking advantage of other fantasy owners’ impatience. I’d only rely on short-term measures if a hitter’s opportunities suddenly change (via trades / injuries / road trips) or if there are no hitters with a solid long-term track record available. When top prospects like Alex Bregman get promoted, it’s often a roll of the dice 0 0.05 0.1 0.15 0.2 0.25 0.3 0.35 -2 1 0 1 2 3 HR Skill (15 GS) Predicted # of Home Runs Hit Today, By Short Term HR Skill
- 7. whether they will help your team. My statistical model can’t help, but it can tell you which players to drop. Without getting in to all the details, the 30 day player rater is considerably better than the 15 day rater, but it’s still relatively bad compared to season long performance. Regression Model 3: Adding Pitchers Pitchers present different opportunities. A pitcher who suddenly starts performing badly may be experiencing an undiagnosed injury or fatigue. Pitchers who start performing better may have overcome these physical ailments or made meaningful mechanical changes. Short-term fluctuations may matter more for pitchers than they do for hitters. To make sure I’m building off the work I already did, I am going to pose a slightly different question. After we factor in a hitter’s ability to hit home runs, will they hit more home runs when facing pitchers who are particularly bad at limiting home runs? Again, does the short term matter more than the long term? Obviously, 15 and 162 game thresholds are not ideal for establishing pitcher skill. I used 100 plate appearances as the short-term cutoff and 400 as the long-term cutoff. 100 may be a bit much for a short-term cutoff but it’s a nice round number. Each starting pitcher is tracked individually. Requiring 162 starts for a hitter is much more restrictive. There were only 2952 plate appearances where a qualified starting pitcher with 400 batters faced went against a non-qualified hitter. Tracking relievers is much harder. Most will not reach 400 batters faced in a season – and many won’t even reach 100. In typical fantasy baseball leagues the closer is the only reliever with significant value. Opportunities to save games matter more than greatness. We wouldn’t drop hot or cold relievers unless the team says they are removing a closer from his position. To simplify things I aggregated all relievers for a particular team and treated each bullpen as a composite pitcher. Then I ran separate analyses to see if the results changed for at-bats versus starters versus relievers. The differences were minor, so I won’t make distinctions here. (It’s mainly an issue of relievers needing slightly better skill at avoiding home runs or they get demoted.) Home run “skill” for pitchers is measured as home runs allowed. Just like batter skill, I constructed this measure by comparing a pitcher’s performance to the average pitcher working at a particular ballpark. Since this is home runs allowed, low numbers are good for the pitcher. In a regression model, a positive coefficient means batters hit more home runs against a pitcher who has been susceptible to giving up home runs, even after controlling for the hitter’s skill. . poisson hr_pg hr15 hr162_b p_hr100 p_hr400_b if under162gs!=1 Iteration 0: log likelihood = -36971.257 Iteration 1: log likelihood = -36971.257 Poisson regression Number of obs = 102,892
- 8. LR chi2(4) = 2122.62 Prob > chi2 = 0.0000 Log likelihood = -36971.257 Pseudo R2 = 0.0279 ------------------------------------------------------------------------------ hr_pg | Coef. Std. Err. z P>|z| [95% Conf. Interval] -------------+---------------------------------------------------------------- hr15 | .0698402 .0091523 7.63 0.000 .051902 .0877785 hr162_b | .3461104 .0096322 35.93 0.000 .3272316 .3649892 p_hr100 | .1869119 .011318 16.51 0.000 .1647291 .2090947 p_hr400_b | .0026707 .0111019 0.24 0.810 -.0190887 .02443 _cons | -2.250443 .0099851 -225.38 0.000 -2.270013 -2.230872 One of the first things to note is that the importance of a hitter’s skill in getting home runs doesn’t really change after controlling for whether the pitcher tends to serve up long balls or keep them in the ballpark. When evaluating hitters, think about their track record and the park they are playing in. Don’t worry as much about the reputation of the opposing pitcher if someone with bona fide power is sitting on the waiver wire! When evaluating pitchers, I would focus overwhelmingly on whether a pitcher has done well in the last 30 days. From 2010-14 pitchers most didn’t have consistent skill in avoiding home runs. They had meaningful ebbs and flows. It’s hard to know what exactly causes this based solely on box scores. I suspect pitchers’ performance has more serious ups and downs because of the physical strain of pitching. A pitcher who gets tired may make more mistakes or lose velocity. Pitchers may need more than a month of spring training to fully warm up but then stay warm. Detailed data on changing velocity and release points could solve this question. In the short term, if you are a fantasy baseball player looking for an edge, play the hot hand with pitching and be wary of it with hitting.