1. krossover.com http://www.krossover.com/blog/2014/10/coaches-korner-12/
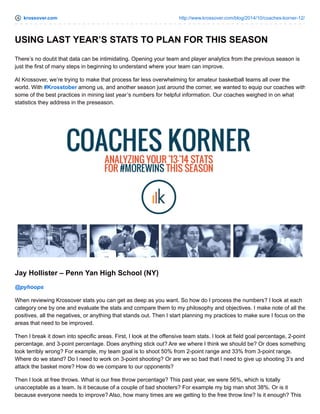
USING LAST YEAR’S STATS TO PLAN FOR THIS SEASON
There’s no doubt that data can be intimidating. Opening your team and player analytics from the previous season is
just the first of many steps in beginning to understand where your team can improve.
At Krossover, we’re trying to make that process far less overwhelming for amateur basketball teams all over the
world. With #Krosstober among us, and another season just around the corner, we wanted to equip our coaches with
some of the best practices in mining last year’s numbers for helpful information. Our coaches weighed in on what
statistics they address in the preseason.
Jay Hollister – Penn Yan High School (NY)
@pyhoops
When reviewing Krossover stats you can get as deep as you want. So how do I process the numbers? I look at each
category one by one and evaluate the stats and compare them to my philosophy and objectives. I make note of all the
positives, all the negatives, or anything that stands out. Then I start planning my practices to make sure I focus on the
areas that need to be improved.
Then I break it down into specific areas. First, I look at the offensive team stats. I look at field goal percentage, 2-point
percentage, and 3-point percentage. Does anything stick out? Are we where I think we should be? Or does something
look terribly wrong? For example, my team goal is to shoot 50% from 2-point range and 33% from 3-point range.
Where do we stand? Do I need to work on 3-point shooting? Or are we so bad that I need to give up shooting 3’s and
attack the basket more? How do we compare to our opponents?
Then I look at free throws. What is our free throw percentage? This past year, we were 56%, which is totally
unacceptable as a team. Is it because of a couple of bad shooters? For example my big man shot 38%. Or is it
because everyone needs to improve? Also, how many times are we getting to the free throw line? Is it enough? This
2. past year, my best big man went to the free throw line 47 times and my small forward went to the line 84 times. These
numbers tell me we are not attacking the basket at all. I expect my big man to go to the free throw line 200+ times and
my forward 100+ times. So we need to change our mentality about attacking. How do I do this? I not only need to
stress driving to the basket more, but also add drills that force us to do so.
Then I investigate rebounding. Where do our numbers stand as a team? Last year our season totals showed that we
were outrebounded. Our offensive rebounds weren’t too bad. However our defensive rebounds were very weak. Do
any individuals stand out in the rebounding category? This past year, everyone was pretty close. However, I had one
individual who had a lot of defensive rebounds, but very few offensive rebounds. His current mindset is that he is a
great shooter and never misses. He couldn’t be farther from the truth. He hates to follow his shot. So I need to get him
to follow his shot in practice.
I then continue onto the next category – turnovers. I do the same for turnovers as I do for all the other categories. I
look at it as a team, and then break it down individually. I then continue category by category until I’m done.
So what do I do when I have all these analytical results? I take all of the areas where we need to improve as a team
and as individuals and rank them from most important to least important.
Then in our practices I will try to design it so that it not only changes our playing mentality, but so it also incorporates
drills that improve these weaknesses. I will focus on the whole team first, and then the individuals as time allows.
As you can see, there is so much that can be benefited from all of these statistics and analytics. It’s just a matter of
how deep you want to delve into it and how much you want to trust the numbers. As a former coach reminded me a
couple of years ago “Figures never lie, but liars do figure.”
Sean Dooley – Baker University (KS)
@bakerathletics
Offensive rating is a big one for us that we talk about all season long. When looking back at our season, it was no
surprise that in the games we won, we tended to be above 80 and the games we lost we tended to be 75 or under in
that category. It helps the players to understand in practice how important each possession is and why we want to
work for quality shots. I have found that a lot of the things we talk about as coaches, like getting quality shots and
valuing the ball, don’t always sink in with our players. However, when I can show them specific numbers that highlight
those things, they tend to grasp the concepts better.
The shot chart is another fantastic resource for us to use. We talk a lot on defense about defending the paint and the
3-point line. When we look back at our season, we find similar trends. In the games we won, we tended to have a
majority of the shots we gave up in the mid-range area. In the games we lost, the shot chart shows that we got beat in
the paint or from 3-point range. It also helped us to understand which areas our offense was relying on for shots. By
using the individual player shot charts, I could find where certain players seemed to be more comfortable shooting
from. Now, I can design plays that will help to get more shots for those specific players from those same spots.
Hopefully, this can help to increase our efficiency offensively during the year.
The pace category was another statistic I liked because it showed us that when we played at the pace we wanted, it
translated to efficiency. My team this year will be a different team in terms of wanting to be more uptempo. Our goal
will be to have the pace number above 70 this year, whereas last year we wanted to keep it in the low 60′s.
James Puliatte – Fort Lee High School (NJ)
3. @iCoachP53
Krossover stats from last season are a HUGE part of my offseason. To start, I look at the shooting charts for individual
players to see where their makes come from. This helps me design where our offense should go. I also look at
different out-of-bounds sets for our team and opponents to see what worked and what didn’t. I have noticed that most
coaches do not change their out-of-bounds plays as much as they should, so this keeps us just a little bit more
prepared right from the get-go.
I look at our turnover ratio and compare our offense rebounds to second-chance points given up. Second-chance
points are something we stress that we can not afford to give up and that we have to strive to achieve ourselves. We
always want to be ahead 2-1 in this statistic.
One stat that most players overlook is shot attempts. It’s true that if the shots don’t go in it doesn’t matter – but if your
opponents are getting 10-15 more shot attempts than you, then you are already behind the eight ball. We can’t have
empty possessions.
What also stood out was that we don’t get to the free-throw line enough, so that helped me design drills in the
offseason that force players to get into the paint and draw contact.
I also make reels for each player returning. For first-year varsity players, I make reels from graduated players. I go
over them with the players during their study halls.
As a group, we meet on Wednesdays to watch film and look at statistics from last year and show mistakes that were
made – especially against league opponents. The stats from last year led me to specific goals for this season. With
the defense we are running, and knowing we probably won’t out-rebound most teams, we need to win the turnover
battle at least 2-1.
Mike Puorro – Barnegat High School (NJ)
@CoachPuorro
This is my first year at a new high school. I was previously at Wall Township HS for six years and now I’m taking over
a program a new program at Barnegat HS. The program at Barnegat has gone 8-41 the past two seasons and started
off 0-17 last year!
While I was at Wall, we really focused on turnovers. We spent time watching them specifically with the players to go
over strategic limitation of these turnovers. We also paid close attention to the offensive rebounds we gave up and
grabbed. I will try to bring the same philosophies to my new school when it comes to those two statistics.
I believe in taking care of the ball and maintaining solid possessions while crashing the offensive glass. If we do this
with meaning and purpose, it creates more possessions. With Krossover, I use our pace statistics to focus on how
fast or slow my team needs to be to succeed.
On the defensive side of the ball, I am all about the “one shot and done” philosophy. In my opinion, the worst-case
scenario is when you force the opposing team to take the shot you want them to, but they crash the glass and finish
with a putback. It’s a very demoralizing swing of events.
In conclusion, we need to rebound the basketball and treat every possession like a game-winner!
All Rights Reserved, Krossover Intelligence, Inc.