Download to read offline
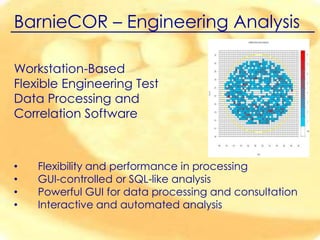
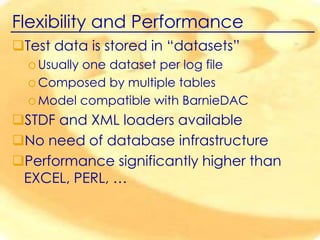

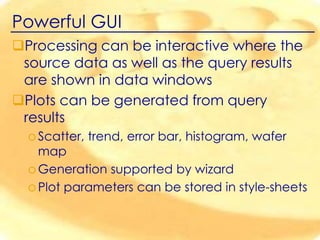


BarnieCOR is engineering analysis software that provides flexibility and high performance for processing test data without needing a database infrastructure. It offers both basic and advanced tools through its GUI. The GUI allows for interactive data processing by showing source data and query results in windows, and generating customizable plots from the results. Analysis can also be automated through scripts that implement processing functions, and data can be shared with other software for further post-processing.