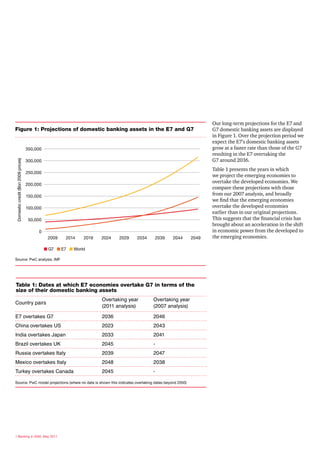
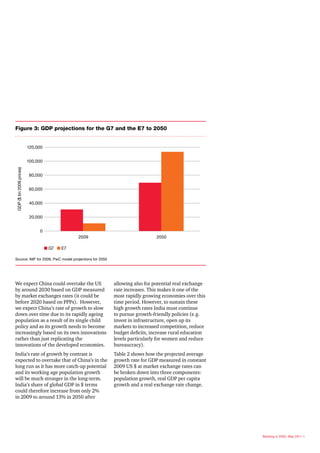
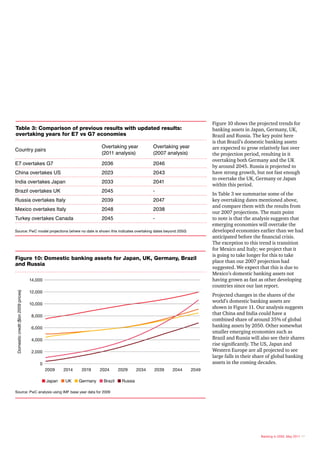
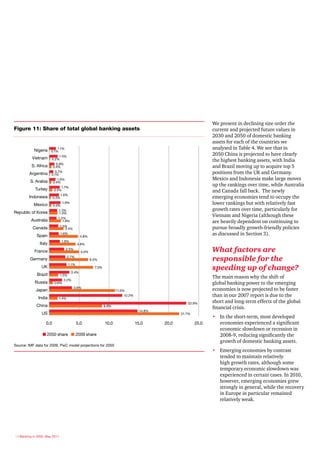
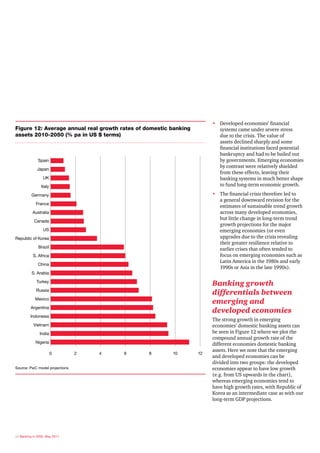
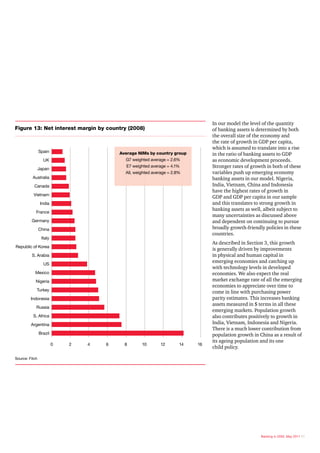
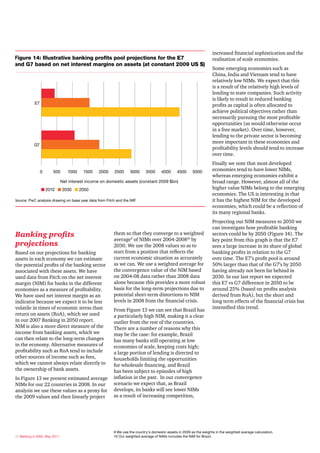
www.pwc.co.uk/financialservices


                             Banking in 2050


How the financial crisis
has affected the long term
outlook for the global
banking industry.

May 2011
Contents
1. Executive Summary                   3
2. Approach                            6
3. How large will the emerging
   economies become?                   8
4. Domestic banking assets –           12
   historic trends
5. Projections of banking assets and   15
   profits to 2050
6. Conclusion and key questions        23
Annex: Methodology and data            25
1. Executive
                                                              Summary

                                                            The accelerating shift in                      industry. In this report we present
                                                                                                           updated projections on how large we
                                                            economic power from the
                                                                                                           expect the banking industry to become
                                                            developed to emerging                          in the world’s largest economies over
                                                            economies is dramatically                      the next 40 years, building on our
                                                            changing the banking                           2007 report on this same topic that
                                                                                                           was produced prior to the onset of the
                                                            industry across the world.                     financial crisis,1 and our updated GDP
                                                                                                           projections published earlier this year.2
                                                            Leaders of financial institutions need
                                                                                                           Our key findings are that:
                                                            to take advantage of the growth
                                                            opportunities this change is creating.         • The emerging economies’ banking
                                                            This report provides projections of the          sectors are expected to outgrow those
                                                            long-term trends of the banking sector           in the developed economies by an
                                                            based on the underlying macro-economic           even greater margin than we projected
                                                            trends, from now until 2050 for the              before the financial crisis.
                                                            world’s leading economies.
                                                                                                           • By 2050 the leading ‘E7’ emerging
                                                            PwC* have prepared this report to help           economies could have domestic
                                                            organisations develop their long-term            banking assets and profits that exceed
                                                            strategy and plans. Our analysis quantifies      those in the G7 by around 50%.
                                                            the projected size and growth of the
                                                                                                           • China could overtake the US in terms
                                                            banking sectors for different economies.
                                                                                                             of the size of their domestic banking
                                                            We identify the projected timing of
                                                                                                             sectors by around 2023.
                                                            the key transitions when the emerging
                                                            economies become leading players. And          • India has particularly strong long-term
* “PwC” refers to the network of member firms of            crucially, we demonstrate these changes          growth potential and our projections
  PricewaterhouseCoopers International Limited (PwCIL),     have accelerated since the period prior to       suggest it could become the third
  or, as the context requires, individual member firms of
  the PwC network.                                          the global financial crisis, placing greater     largest domestic banking sector by
1 “Banking in 2050: How big will the emerging markets       demands on industry leaders to respond           2050 after China and the US, but
  get?”, June 2007, http://www.pwc.com/gx/en/               effectively to these opportunities.              ahead of Japan, the UK and Germany.
  world-2050/banking-sector.jhtml
                                                                                                             Brazil could also rise strongly up
2 “The World in 2050, The accelerating shift of global      The recent global financial crisis shook
                                                                                                             the global banking league table
  economic power: challenges and opportunities”,            the world economy and set in motion
  January 2011, http://www.pwc.com/gx/en/world-2050/                                                         over this period.
  the-accelerating-shift-of-global-economic-power.jhtml     significant changes to the banking


                                                                                                                                   Banking in 2050, May 2011 3
Our long-term projections for the E7 and
Figure 1: Projections of domestic banking assets in the E7 and G7                                                  G7 domestic banking assets are displayed
                                                                                                                   in Figure 1. Over the projection period we
                                                                                                                   expect the E7’s domestic banking assets
                                    350,000                                                                        grow at a faster rate than those of the G7
                                                                                                                   resulting in the E7 overtaking the
                                                                                                                   G7 around 2036.
Domestic credit ($bn 2009 prices)


                                    300,000

                                                                                                                   Table 1 presents the years in which
                                    250,000
                                                                                                                   we project the emerging economies to
                                                                                                                   overtake the developed economies. We
                                    200,000
                                                                                                                   compare these projections with those
                                    150,000
                                                                                                                   from our 2007 analysis, and broadly
                                                                                                                   we find that the emerging economies
                                    100,000                                                                        overtake the developed economies
                                                                                                                   earlier than in our original projections.
                                     50,000                                                                        This suggests that the financial crisis has
                                                                                                                   brought about an acceleration in the shift
                                         0                                                                         in economic power from the developed to
                                               2009    2014   2019   2024   2029   2034   2039    2044      2049   the emerging economies.

                                              n G7 n E7 n World

Source: PwC analysis, IMF


Table 1: Dates at which E7 economies overtake G7 in terms of the
size of their domestic banking assets
                                                                     Overtaking year      Overtaking year
Country pairs
                                                                     (2011 analysis)      (2007 analysis)

E7 overtakes G7                                                      2036                 2046
China overtakes US                                                   2023                 2043
India overtakes Japan                                                2033                 2041
Brazil overtakes UK                                                  2045                 -
Russia overtakes Italy                                               2039                 2047
Mexico overtakes Italy                                               2048                 2038
Turkey overtakes Canada                                              2045                 -

Source: PwC model projections (where no date is shown this indicates overtaking dates beyond 2050)


4 Banking in 2050, May 2011
What questions does                           •	 	
                                                 How will new regulatory capital and
                                                 other requirements impact these
this analysis raise?                             growth trends globally and within
The analysis in this report can help             geographies where implementation
banks, other financial corporations and          may be more or less restrictive? How
policy-makers to identify the key long-          will the use of securitisations impact
term macroeconomic trends likely to              these growth trends?
affect banking over the next 40 years.        •	 	 he pace of prospective growth in
                                                 T
This should help to stimulate strategic          global banking assets is likely to
discussions and identify key opportunities       exceed the sector’s capital generation
and threats relating to the emerging             from retained earnings raising the
markets in particular.                           question: where will the capital to
Particular questions your organisation           support the growth in banking assets
may want to consider are:                        come from?
•	 	
   Which economies have the greatest          •	 	 o what extent will non-bank
                                                 T
   future potential for growth and               investors such as funds and insurance
   investment? What are the areas of             companies be able to access the
   greatest competitive advantage for our        lending markets across the world
   organisation?                                 directly (as lenders) or indirectly
                                                 (through securitisations)?
•	 	
   What growth strategies are open
   to our business to compete in this         •	 	 ill the asset growth in Asian banks
                                                 W
   shifting global landscape?                    create a new cadre of international
   Will competition become more                  banks that will come to dominate
   intense? Is greater consolidation             the global markets and feature
   an effective strategy? How should             prominently in banking M&A? What
   opportunities be valued given these           threat could this pose to the current
   growth expectations?                          leading banks and could this lead to a
                                                 defensively inspired phase of banking
•	 	 hat types of banks will we see
   W                                             consolidation?
   developing in the emerging economies
   (e.g. universal high street banks or
   more specialised or localised players)
   and how will they integrate with and
   shape the future evolution of the
   global financial system (e.g. as regards
   dominant currencies)?


                                                                                          Banking in 2050, May 2011 5
2. Approach


                              Overview
                              In this section we present an overview of our methodology. We follow broadly the
                              same approach that we used in our 2007 analysis, as summarised in Figure 2. Starting
                              from GDP projections (as reported in the latest update of our “World in 2050” report
                              in January 20113), we then developed projections for the amount of domestic banking
                              assets in each economy. We investigated banking profits by applying a country specific
                              net interest margin to the domestic assets. The technical details of this approach are
                              given in the Annex.


                              Figure 2: Global banking projections model structure


                                             GDP                            GDP & GDP/Capita
                                      model assumptions                    projections from PwC
                                                                               model to 2050


                                             Banking
                                        assets to GDP ratio                    Banking assets                             Regression
                                      trend analysis (charts)                   projections                                analysis


                                              Return
                                          on assets trend                       Banking profit                              Expert
                                             analysis                            projections                              judgement


                               Note: all projections done by country then aggregated to global level


                              Source: PwC model


                              3 “The World in 2050, the accelerating shift of global economic power: challenges and opportunities”, January 2011,
                                http://www.pwc.com/gx/en/world-2050/the-accelerating-shift-of-global-economic-power.jhtml
                              4 Note that these five countries were not included in our 2007 ‘Banking in 2050’ report, but are included here as they
                                have long-term potential and were included in the latest update of our ‘World in 2050’ GDP projections.
6 Banking in 2050, May 2011   5 We concentrate on domestic lending only as this allows for the greatest consistency in data between countries.
We included the following 22 countries        We also combined these GDP projections        In our 2007 report we used return on
in the analysis on the basis that, based on   with UN population projections to             assets (RoA) as our measure of banking
earlier model projections, we expect them     determine GDP per capita trends.              profitability. However, we decided not to
to have the largest economies in the world    From previous research, we know this          use this measure in this updated analysis
by 2050:                                      per capita income measure is a useful         because it has become much more volatile
                                              indicator of the state of development         over the course of the financial crisis
G7 countries: US, Japan, Germany,
                                              of each economy, which is a key driver        and so less reliable as a starting point
UK, France, Italy, Canada
                                              of the size of an economy’s banking           for a long-term profitability analysis.
E7 countries: China, India, Brazil,           sector as a share of GDP.                     NIM rates have been less volatile and are
Russia, Mexico, Indonesia, Turkey                                                           more closely related to the domestic asset
                                              Domestic banking asset projections            base used in this study as the measure of
Other developed economies:
                                                                                            banking size in each country.
Australia, Republic of Korea, Spain           Our baseline projections were derived by
Newly emerging economies:                     assuming an underlying upward trend
                                              in the domestic5 credit to GDP ratio in       Key assumptions and uncertainties
Argentina, Vietnam, Nigeria, Saudi
Arabia, South Africa4                         line with historic trends for the countries   Our analysis rests on the following broad
                                              concerned (using IMF data). We also           assumptions:
                                              allow for gradual convergence to the
GDP projections                               norm for countries with relatively high or
                                                                                            1. Governments follow broadly growth-
                                                                                               friendly policies across the period
We began by taking our updated                low initial banking to GDP ratios relative
                                                                                               for the projections (e.g. maintain
long-term GDP projections as the basis        to their state of economic development.
                                                                                               reasonable macroeconomic stability,
for our projections for domestic credit.      This convergence occurs at a relatively
                                                                                               remain open to trade and investment,
As explained further in the Annex, these      slow rate of around 2-4.5% per annum,
                                                                                               maintain a reasonable rule of law etc.)
projections incorporate the effects of:       depending on the country concerned
                                              (as explained further in the Annex).          2. There are no catastrophic events that
• the expected growth of the working
                                                                                               permanently throw growth off track
  age population (as projected by             Having generated these projections for
                                                                                               (e.g. nuclear war, major global climate
  the UN);                                    the ratio of domestic credit to GDP, we
                                                                                               disasters) – as opposed to temporary
                                              then obtained the absolute amount of
• projected growth of human capital                                                            cyclical fluctuations that we ignore
                                              domestic credit by applying these ratios
  (proxied by education levels) and                                                            as we are focusing here on long-term
                                              to our GDP projections at market
  physical capital (driven by assumed                                                          potential growth.
                                              exchange rates.
  investment to GDP ratios after
                                                                                            These assumptions are, of course,
  allowing for depreciation of the
                                              Banking profitability                         subject to many uncertainties over the
  existing capital stock); and
                                                                                            projection period. Our results should
• total factor productivity growth            We investigated the projected profitability   therefore be taken as indications of the
  (global technological progress and          for the banking sector by determining         potential future scale of domestic banking
  lower income countries catching up          the profits from the net interest margin      assets and profits conditional on these
  with richer ones by making use of           (NIM) on domestic banking assets for          assumptions, rather than being forecasts
  their technologies and resources).          each economy. Our approach was to take        to which spurious precision is attached.
                                              data from Fitch on the NIM in different       The purpose of the analysis is to point
The projections also allow for real           countries, and to project forward these       to broad strategic trends in the long run
exchange rate increases over time in          values under a convergence scenario           not to make detailed predictions that are
the emerging economies linked to their        where the NIM in each country tends to        bound to be wrong to a greater or lesser
stronger expected productivity growth         a common value by 2030 (given by the          degree given the uncertainties involved in
(the so-called Balassa-Samuelson effect).     global weighted average NIM in 2004-8).       any such long-term exercise.
This means that real GDP growth in            Applying the projected NIM rates to the
emerging economies is typically higher        domestic assets in an economy gives a
when measured in US $ terms than in           measure of income from lending activity
domestic currency (or PPP terms).             and thus indicates the level of profits.


                                                                                                                   Banking in 2050, May 2011 7
3. How large will the
                               emerging economies
                               become?
                              Our analysis for banking       The global economic
                              assets rests heavily on the    power shift from the G7
                              trends in GDP and GDP
                                                             to the E7 is speeding up
                              per capita of the countries
                                                             “World in 2050: The accelerating shift
                              studied. In our research       in global economic power: challenges
                              “World in 2050”, we            and opportunities” presents our GDP
                              published our projections      projections for the 20 largest economies
                              of the GDP for the different   in the world. We have used the results
                                                             from this analysis to determine the size
                              economies considered in        of domestic credit in these economies.
                              this report. In this section   Therefore to understand the results for
                              we highlight some of the key   the banks, it is useful to first understand
                                                             the main changes we expect to see in the
                              findings from this research
                                                             size of these economies.
                              relevant to the results for
                                                             Figure 3 shows the GDPs of the E7 and
                              our banking projections.
                                                             G7 in 2009 and our updated projections
                                                             for 2050 (measured in constant 2009
                                                             US$ at market exchange rates). We see
                                                             from the chart that in 2009, the GDP of
                                                             the E7 is approximately one third the size
                                                             of the G7, but by 2050 the E7 could grow
                                                             to be more than 60% larger than the G7.
                                                             Our analysis also suggests that the E7
                                                             could overtake the G7 in terms of GDP at
                                                             market exchange rates in around 2032 (at
                                                             PPPs this could occur by 2020, but this is
                                                             less relevant for the present report).


8 Banking in 2050, May 2011
Figure 3: GDP projections for the G7 and the E7 to 2050


                         120,000


                         100,000
GDP ($ bn 2009 prices)


                          80,000


                          60,000


                          40,000


                          20,000


                              0
                                               2009                       2050

                                   n G7 n E7

Source: IMF for 2009, PwC model projections for 2050


We expect China could overtake the US                  allowing also for potential real exchange
by around 2030 based on GDP measured                   rate increases. This makes it one of the
by market exchanges rates (it could be                 most rapidly growing economies over this
before 2020 based on PPPs). However,                   time period. However, to sustain these
we expect China’s rate of growth to slow               high growth rates India must continue
down over time due to its rapidly ageing               to pursue growth-friendly policies (e.g.
population as a result of its single child             invest in infrastructure, open up its
policy and as its growth needs to become               markets to increased competition, reduce
increasingly based on its own innovations              budget deficits, increase rural education
rather than just replicating the                       levels particularly for women and reduce
innovations of the developed economies.                bureaucracy).
India’s rate of growth by contrast is                  Table 2 shows how the projected average
expected to overtake that of China’s in the            growth rate for GDP measured in constant
long run as it has more catch-up potential             2009 US $ at market exchange rates can
and its working age population growth                  be broken down into three components:
will be much stronger in the long-term.                population growth, real GDP per capita
India’s share of global GDP in $ terms                 growth and a real exchange rate change.
could therefore increase from only 2%
in 2009 to around 13% in 2050 after


                                                                                                   Banking in 2050, May 2011 9
Table 2 Components of projected potential GDP growth (% pa average, 2010-50)


Country                        Contribution           Contribution               Real GDP growth   Changes in real   Real GDP
                               from population        from real GDP              in domestic       market exchange   growth in US
                               growth (%)             per capita                 currency          rates (%)         $ terms (%)
                                                      growth (%)                 terms (%)*

                               (A)                    (B)                        (C = A + B)       (D)               (E = C + D)
Vietnam                        0.7                    6.1                        6.8               1.9               8.7
India                          0.8                    5.3                        6.1               1.9               8.0
Nigeria                        1.5                    5.0                        6.5               1.3               7.8
China                          0.1                    4.6                        4.7               1.1               5.8
Indonesia                      0.6                    4.1                        4.7               1.1               5.8
Turkey                         0.6                    3.4                        4.0               1.0               5.0
South Africa                   0.3                    3.6                        3.9               1.1               5.0
Saudi Arabia                   1.4                    2.7                        4.1               0.9               5.0
Argentina                      0.6                    3.0                        3.6               1.2               4.8
Mexico                         0.5                    3.2                        3.7               1.1               4.8
Brazil                         0.6                    3.3                        3.9               0.5               4.4
Russia                         -0.7                   3.2                        2.5               1.4               3.9
Republic of Korea              -0.3                   2.6                        2.3               0.9               3.2
Australia                      0.7                    1.9                        2.6               -0.2              2.4
US                             0.6                    1.8                        2.4               0.0               2.4
UK                             0.3                    2.0                        2.3               0.1               2.4
Canada                         0.6                    1.7                        2.3               -0.1              2.2
Spain                          0.1                    1.8                        1.9               0.1               2.0
France                         0.2                    2.0                        2.2               -0.5              1.7
Italy                          -0.2                   1.9                        1.7               -0.2              1.5
Germany                        -0.3                   1.9                        1.6               -0.3              1.3
Japan                          -0.5                   2.1                        1.6               -0.5              1.1

Source: PwC long-term GDP growth model projections (World in 2050 report, January 2011)


10 Banking in 2050, May 2011
There are several important points to note                     3. The emerging economies’ market
from these GDP projections:                                       exchange rates are expected to
                                                                  appreciate over time in real terms
1. There is a natural segmentation
                                                                  due to relative stronger productivity
   of the countries into two groups:
                                                                  growth (the so-called Balassa-
   emerging economies (E7 and the
                                                                  Samuelson effect). This provides a
   newly emerging economies) with high
                                                                  boost to growth in all of the emerging
   expected rates of growth (typically
                                                                  economies when measured in
   4% or more per annum including real
                                                                  real US$ terms. Note that this real
   exchange rate appreciation) and the
                                                                  exchange rate appreciation could arise
   developed economies (G7) with much
                                                                  due to nominal appreciation and/or
   lower rates of growth (typically less
                                                                  higher inflation rates in the countries
   than 2.5% per annum including real
                                                                  concerned.6
   exchange rate changes). South Korea
   is an intermediate case here between                        Of course, as noted in the previous
   the E7 and G7. We will see a similar                        section, the precise growth projections
   E7-G7 growth differential when we                           shown in Table 1 are subject to many
   consider the expected growth rates of                       uncertainties and should be taken as
   domestic banking assets in Figures 4                        indicators of economic potential rather
   and 5 on P13.                                               than precise forecasts. However, the
                                                               broad messages discussed above on
2. Projected changes in population have
                                                               relative growth rates of emerging and
   an important effect on some countries’
                                                               developed economies seem likely to be
   relative growth rates. For instance,
                                                               more robust.
   Russia, Japan and Republic of Korea
   are expected to experience population
   falls, depressing overall GDP growth.
   Nigeria, Saudi Arabia and India are
   all expected to experience strong
   population increases, thereby boosting
   overall GDP growth. Some advanced
   economies (e.g. US, Australia) are
   projected to have stronger population
   growth than some emerging
   economies (notably China due to its
   one child policy).


6 To illustrate this effect consider the problem of valuing a house located in the Euro zone in US$. Suppose its initial
  value is €100,000, and the market exchange rate is 1€/$. Then the value of the house in dollars is $100,000. Over
  time the value of the house will change as measured in local currency, reflecting local market conditions, the
  economy etc. Measured in US$ however, there could also be a corresponding change in value due to changes in the
  real exchange rate. If the euro appreciates against the dollar in real terms, it will be worth relatively more in dollar
  terms. So in our example, suppose that after one year there is an increase in the value of the house of 5% in the local
  market, and an appreciation of the euro against the dollar resulting in an exchange rate of 0.95 €/$. The value of the
  house at the end of the year is therefore €105,000 or $110,526. Here we can see that there is a higher rate of growth
  in the dollar value of the house, arising from the appreciating exchange rate, in addition to the increase in value due
  to local market conditions. The situation for international comparisons of GDP is analogous to this.                       Banking in 2050, May 2011 11
4. Domestic banking
                                                              assets – historic
                                                              trends
                                                            In this section we review how domestic banking assets
                                                            in the countries of our study have varied over time.
                                                            This is useful as it offers insights of important differences
                                                            between countries and how they are likely to evolve.

                                                            Country trends                                  run, and therefore we project this
                                                                                                            ratio to fall over the coming decades
                                                                                                            to one that is more in line with other
                                                            Developed economies                             developed economies.
                                                            Figure 4 shows historical trends in the
                                                                                                         • The US has a relatively low ratio of
                                                            ratio of domestic banking assets to GDP
                                                                                                           banking assets to GDP based on the
                                                            for the major developed economies. The
                                                                                                           IMF domestic credit definition used
                                                            general trend is that of a gradual upward
                                                                                                           here in comparison with most other
                                                            trend in the ratio over time from around
                                                                                                           developed economies. This is likely
                                                            50-100% of GDP in 1986 to around
                                                                                                           to be due to the fact that in the US a
                                                            100-230% of GDP in 2009. However,
                                                                                                           much greater proportion of financing
                                                            there are considerable variations in these
                                                                                                           takes place through securities markets
                                                            trends across countries. We can note in
                                                                                                           rather than through bank lending.8
                                                            particular that:
                                                                                                           So whilst there are high levels of
                                                            • The banking assets to GDP ratio              leverage in the US economy as a
                                                              for the UK and Spain has increased           whole, a large proportion of this
                                                              particularly strongly over the past 7        debt will be held by non-bank
7 For the UK, we looked at this issue of excessive public
  and private sector debt levels in detail in an article
                                                              years, resulting in ratios of over 200%      organisations, and therefore do not
  in our November 2010 UK Economic Outlook report,            of GDP. This is the result of property       feature in this analysis based on the
  http://www.pwcwebcast.co.uk/ukeo_nov2010_debt.pdf           booms in these countries as well as the      IMF definitions used for this study.
8 The average value of outstanding US securitised debt
  in 2009 has been variously estimated at between $3.6        role of leveraged private equity deals
  trillion and $5 trillion, or around 25-35% of US GDP.       and general expansion of the financial
  However, whether it is appropriate to consider this as
  part of the assets of the banking sector, and whether       sector’s role in these highly leveraged
  there may be double counting if we just add this into       economies. We consider it most likely
  our measure of domestic credit, is less clear. For the
  purposes of this study, therefore, we note this point
                                                              that this high level of credit relative
  but do not try to add in securitisation assets for the      to GDP is unsustainable7 in the long
  US or other countries.


12 Banking in 2050, May 2011
• South Korea is an interesting example
Figure 4: Ratio of domestic banking assets to GDP in                                                                                           of a country that has changed from
developed economies                                                                                                                            being an emerging economy into
                                                                                                                                               a developed economy over the last
                                                                                                                                               30-40 years. Between 1988 and 2000
                                                                250.00                                                                         Republic of Korea had the lowest
                                                                                                                                               ratio of banking assets to GDP of the
                          Domestic banking assets as % of GDP


                                                                                                                                               developed economies considered in
                                                                200.00                                                                         this study, but this ratio has since risen
                                                                                                                                               to a level more in line with the other
                                                                                                                                               developed economies. This mirrors
                                                                150.00                                                                         the broad trends we expect in the
                                                                                                                                               future from other emerging economies
                                                                                                                                               that are currently less far along the
                                                                100.00
                                                                                                                                               development track than Republic of
                                                                                                                                               Korea (as discussed in Section 5
                                                                 50.00                                                                         of this report).

                                                                                                                                             E7 Economies
                                                                  0.00
                                                                         1986           1991           1996           2001            2006   In Figure 5 we show the trend in the ratio
                                                                                                                                             of domestic banking assets to GDP for
                                                                         n Australia n Canada n France n Germany n Italy                     the E7 countries. We can note from this
                                                                         n Japan n Republic of Korea n UK n USA n Spain                      chart that:

Source: IMF                                                                                                                                  • China has by far the highest ratio of
                                                                                                                                               the E7 economies. In the past this has
                                                                                                                                               been due primarily to high levels of
                                                                                                                                               lending to state enterprises, although
Figure 5: Ratio of domestic banking assets to GDP in the                                                                                       more recently property-related
E7 economies                                                                                                                                   lending has also grown rapidly in
                                                                                                                                               China and state enterprise lending
                                                                180.00                                                                         has declined in relative importance
                                                                                                                                               as the Chinese economy becomes
Domestic banking assets as % of GDP


                                                                160.00                                                                         increasingly driven by private sector
                                                                140.00                                                                         companies.

                                                                120.00                                                                       • Some of the other countries display
                                                                                                                                               the effects of past financial and
                                                                100.00                                                                         economic crises. For instance, Brazil
                                                                 80.00                                                                         has two sharp peaks in its ratio
                                                                                                                                               corresponding to its financial crisis
                                                                 60.00                                                                         and hyperinflations between 1986 and
                                                                 40.00                                                                         1994. More recently, however,
                                                                                                                                               its economy has been much more
                                                                 20.00                                                                         stable and its longer term prospects
                                                                  0.00                                                                         appear strong.
                                                                         1986           1991           1996           2001           2006

                                                                         n Brazil n China n India n Indonesia n Mexico n Russia n Turkey

Source: IMF


                                                                                                                                                                    Banking in 2050, May 2011 13
• From the limited data we have for
Figure 6: Ratio of domestic banking assets to GDP in newly                                                                      Nigeria, we see a fair degree of
emerging economies                                                                                                              volatility that could originate from a
                                                                                                                                combination of political uncertainty
                                                                                                                                and its dependence on oil revenues.
                                       140.00                                                                                   In absolute terms, Nigerian banking
                                                                                                                                assets remain low relative to GDP
 Domestic banking assets as % of GDP


                                       120.00                                                                                   but have long-term potential if the
                                                                                                                                government can follow broadly
                                       100.00                                                                                   growth-friendly policies and diversify
                                                                                                                                its economy away from oil in the long
                                        80.00                                                                                   run. Banking sector development
                                                                                                                                will be an important element in
                                        60.00                                                                                   this process for Nigeria and other
                                                                                                                                emerging economies that have
                                        40.00                                                                                   traditionally been heavily dependent
                                                                                                                                on revenues from natural resources.
                                        20.00

                                         0.00                                                                                 Key changes due to the
                                             1986             1991            1996            2001              2006
                                                                                                                              financial crisis
                                                n Argentina n Saudi Arabia n South Africa n Nigeria n Vietnam                 We can see varied trends in how
                                                                                                                              economies’ ratios of domestic banking
Source: IMF ( no available 1994 data for Vietnam)
                                                                                                                              assets to GDP have fared over the
                                                                                                                              financial crisis period since 2007. In
                                                                                                                              most developed economies this ratio
                                                                                                                              kept on increasing, probably reflecting
• Indonesia and Mexico have both                                                Newly emerging economies                      a combination of a decrease/slowdown
  displayed sustained declining banking                                                                                       in GDP and increased lending to
                                                                                Figure 6 shows historic trends in banking
  asset to GDP ratios from 1999 and                                                                                           governments to finance their fiscal
                                                                                asset to GDP ratios in the newly emerging
  1997 respectively, with Mexico                                                                                              interventions and growing budget
                                                                                economies. Our analysis of these
  stabilising around the middle of the                                                                                        deficits. For the E7 and newly emerging
                                                                                countries is limited by the availability of
  2000s. This is most likely an after                                                                                         economies the ratios also increased, but
                                                                                data, but we can identify some
  effect of the Peso crisis (Mexico) and                                                                                      this largely reflected continued healthy
                                                                                broad trends:
  the Asian crisis (Indonesia), reflecting                                                                                    private sector growth after relatively
  a long recovery and rebalancing                                               • Vietnam has shown a strongly                short cyclical downturns due to the crisis.
  of their economies. This result is                                              increasing ratio since 1998. As in          In addition, some countries such as China
  important when we come to consider                                              the case of China, this is most likely      embarked on significant fiscal stimulus
  how developed economies will recover                                            due to the large amount of lending          programmes and encouraged higher
  from the financial crisis, particularly                                         to state owned enterprises in earlier       bank lending to prevent recessions
  for those that are highly leveraged                                             periods combined with strong growth         from taking hold.
  (e.g. UK, Spain). History suggests                                              in property-related lending in more
  that it takes a long time for banking                                           recent years.
  systems to recover fully from such
                                                                                • Argentina has seen a declining ratio
  major crises.
                                                                                  of banking assets to GDP during its
                                                                                  gradual and painful recovery from its
                                                                                  financial crisis in the early 2000s.


14 Banking in 2050, May 2011
5. Projections of
                             banking assets and
                             profits to 2050
Projections of domestic banking assets
Figure 7 shows the key result of this report. It shows the projected trend level of
domestic credit in the G7, E7 and the World over the period to 2050. We project E7
banking assets to grow significantly faster than those in the G7, and to overtake the
G7 around 2036 (compared to around 2044 in our 2007 report on this topic). The
financial crisis therefore does appear to have accelerated this global shift of economic
and financial power to the emerging economies. By 2050 the E7’s banking assets are
projected to be approximately 50% greater than those in the G7.


Figure 7: Projections of domestic banking assets in the E7 and G7


                                    350,000

                                    300,000
Domestic credit ($bn 2009 prices)


                                    250,000

                                    200,000

                                    150,000

                                    100,000

                                     50,000

                                         0
                                              2009   2014    2019   2024   2029   2034   2039    2044        2049

                                              n G7 n E7 n World

Source: PwC analysis, IMF


                                                                                            Banking in 2050, May 2011 15
It’s worth noting that the changes in
Figure 8: Projected ratio of domestic banking assets to GDP                                                            relative E7/G7 banking assets are not
                                                                                                                       exactly the same as the relative change
                                                                                                                       projected in E7/G7 GDP. The reason
                                        160                                                                            for this in our model is that the ratio of
                                                                                                                       domestic banking assets to GDP also
Domestic banking assets as % of GDP


                                        140
                                                                                                                       evolves over time in different ways for the
                                        120                                                                            E7 and G7, as illustrated in Figure 8. The
                                                                                                                       average ratio in the G7 remains relatively
                                        100                                                                            stable over the projection period. In the
                                                                                                                       emerging economies the ratio rises fairly
                                         80                                                                            quickly initially, but then converges more
                                                                                                                       slowly on the world average towards the
                                         60
                                                                                                                       end of the projection period. This is the
                                         40                                                                            result of these economies maturing
                                                                                                                       into developed economies with slower
                                         20                                                                            trend growth rates by the end of the
                                                                                                                       projection period.
                                          0
                                               2009    2014     2019    2024    2029       2034   2039   2044   2049   We also looked at projected changes in
                                                                                                                       levels of domestic banking assets at a
                                               n G7 average n E7 average n World average                               country level. In Figure 9 we plot the
                                                                                                                       changes in domestic assets over the
Source: PwC analysis using IMF base year data for 2009
                                                                                                                       projection period for the US, China, India
                                                                                                                       and Japan. The key results here are that
                                                                                                                       China could overtake the US in 2023, and
                                                                                                                       India could overtake Japan in 2033. In
                                                                                                                       our previous analysis published in June
Figure 9: Domestic banking assets for the US, China, India and Japan
                                                                                                                       2007, China was projected to overtake
                                                                                                                       the US in 2043, and India to overtake
                                                                                                                       Japan in 2041. Although the exact
                                      80,000
                                                                                                                       transition dates are open to considerable
                                      70,000                                                                           uncertainty, it seems likely that China will
Domestic credit ($bn 2009 prices)


                                                                                                                       have the largest domestic banking assets
                                      60,000                                                                           in the world at some point within the
                                                                                                                       next 20-30 years and that India will move
                                      50,000
                                                                                                                       clearly into third place by 2050.
                                      40,000

                                      30,000

                                      20,000

                                      10,000

                                          0
                                                2009     2014    2019    2024    2029      2034   2039   2044   2049

                                           n US n China n India n Japan

Source: PwC analysis using IMF base year data for 2009


16 Banking in 2050, May 2011
Figure 10 shows the projected trends for
Table 3: Comparison of previous results with updated results:                                                       banking assets in Japan, Germany, UK,
overtaking years for E7 vs G7 economies                                                                             Brazil and Russia. The key point here
                                                                                                                    is that Brazil’s domestic banking assets
                                                                  Overtaking year          Overtaking year          are expected to grow relatively fast over
Country pairs
                                                                  (2011 analysis)          (2007 analysis)          the projection period, resulting in it
                                                                                                                    overtaking both Germany and the UK
E7 overtakes G7                                                   2036                     2046
                                                                                                                    by around 2045. Russia is projected to
China overtakes US                                                2023                     2043                     have strong growth, but not fast enough
                                                                                                                    to overtake the UK, Germany or Japan
India overtakes Japan                                             2033                     2041
                                                                                                                    within this period.
Brazil overtakes UK                                               2045                     -
                                                                                                                    In Table 3 we summarise some of the
Russia overtakes Italy                                            2039                     2047                     key overtaking dates mentioned above,
                                                                                                                    and compare them with the results from
Mexico overtakes Italy                                            2048                     2038
                                                                                                                    our 2007 projections. The main point
Turkey overtakes Canada                                           2045                     -                        to note is that the analysis suggests that
                                                                                                                    emerging economies will overtake the
Source: PwC model projections (where no date is shown this indicates overtaking dates beyond 2050)                  developed economies earlier than we had
                                                                                                                    anticipated before the financial crisis.
                                                                                                                    The exception to this trend is transition
                                                                                                                    for Mexico and Italy; we project that it
                                                                                                                    is going to take longer for this to take
Figure 10: Domestic banking assets for Japan, UK, Germany, Brazil
                                                                                                                    place than our 2007 projection had
and Russia
                                                                                                                    suggested. We expect that this is due to
                                                                                                                    Mexico’s domestic banking assets not
                                    14,000                                                                          having grown as fast as other developing
                                                                                                                    countries since our last report.
                                    12,000
Domestic credit ($bn 2009 prices)


                                                                                                                    Projected changes in the shares of the
                                                                                                                    world’s domestic banking assets are
                                    10,000
                                                                                                                    shown in Figure 11. Our analysis suggests
                                    8,000
                                                                                                                    that China and India could have a
                                                                                                                    combined share of around 35% of global
                                    6,000                                                                           banking assets by 2050. Other somewhat
                                                                                                                    smaller emerging economies such as
                                     4,000                                                                          Brazil and Russia will also see their shares
                                                                                                                    rise significantly. The US, Japan and
                                     2,000                                                                          Western Europe are all projected to see
                                                                                                                    large falls in their share of global banking
                                        0                                                                           assets in the coming decades.
                                             2009   2014   2019   2024   2029       2034   2039   2044       2049

                                         n Japan n UK n Germany n Brazil n Russia

Source: PwC analysis using IMF base year data for 2009


                                                                                                                                           Banking in 2050, May 2011 17
We present in declining size order the
Figure 11: Share of total global banking assets                                                                   current and projected future values in
                                                                                                                  2030 and 2050 of domestic banking
                                                                                                                  assets for each of the countries we
            Nigeria         1.1%                                                                                  analysed in Table 4. We see that in
                       0.1%
                              1.4%
                                                                                                                  2050 China is projected to have clearly
          Vietnam      0.2%                                                                                       the highest banking assets, with India
                           0.9%
          S. Africa     0.4%                                                                                      and Brazil moving up to acquire top 5
         Argentina        0.7%
                       0.1%                                                                                       positions from the UK and Germany.
         S. Arabia          1.0%                                                                                  Mexico and Indonesia make large moves
                        0.4%
                               1.7%
                                                                                                                  up the rankings over time, while Australia
            Turkey       0.5%                                                                                     and Canada fall back. The newly
                               1.6%
        Indonesia       0.3%                                                                                      emerging economies tend to occupy the
           Mexico       0.4%
                                1.9%                                                                              lower rankings but with relatively fast
                             1.3%                                                                                 growth rates over time, particularly for
Republic of Korea             1.4%
                             1.2%
                                                                                                                  Vietnam and Nigeria (although these
          Australia             1.9%                                                                              are heavily dependent on continuing to
                               1.5%
           Canada                 2.4%                                                                            pursue broadly growth-friendly policies
             Spain
                               1.6%
                                              4.8%
                                                                                                                  as discussed in Section 3).
                                1.8%
               Italy                       4.8%

            France
                                  2.5%
                                              5.0%                                                                What factors are
         Germany
                                   2.7%
                                                     6.5%                                                         responsible for the
                                    1.1%
                UK
                                       3.4%
                                                       7.3%                                                       speeding up of change?
             Brazil            1.5%
                                                                                                                  The main reason why the shift of
                                  2.2%
            Russia       0.6%                                                                                     global banking power to the emerging
                                         3.8%
             Japan                                                   11.0%                                        economies is now projected to be faster
              India
                                                                          12.2%                                   than in our 2007 report is due to the
                            1.4%
                                                                                                      22.9%       short and long-term effects of the global
             China                                            8.8%
                                                                                                                  financial crisis.
                                                                                    14.8%
                US                                                                                 21.7%
                                                                                                                  • In the short-term, most developed
                   0.0                     5.0                10.0                15.0      20.0           25.0     economies experienced a significant
                                                                                                                    economic slowdown or recession in
                 n 2050 share n 2009 share                                                                          2008-9, reducing significantly the
                                                                                                                    growth of domestic banking assets.
Source: IMF data for 2009, PwC model projections for 2050
                                                                                                                  • Emerging economies by contrast
                                                                                                                    tended to maintain relatively
                                                                                                                    high growth rates, although some
                                                                                                                    temporary economic slowdown was
                                                                                                                    experienced in certain cases. In 2010,
                                                                                                                    however, emerging economies grew
                                                                                                                    strongly in general, while the recovery
                                                                                                                    in Europe in particular remained
                                                                                                                    relatively weak.


18 Banking in 2050, May 2011
Table 4 Global leader board of domestic banking assets in 2009, 2030 and 2050


Country                        Domestic                 Country                         Domestic assets               Country                       Domestic
rankings                       assets 2009              rankings                        2030 (US$ bn,                 rankings                      assets 2050
in 2009                        (US$ bn,                 in 2030                         constant                      in 2050                       (US$ bn,
                               constant                                                 2009 prices)                                                constant
                               2009 prices)                                                                                                         2009 prices)

1.   US                        14,772                   1.    China                     31,018                        1.   China                    72,228
2.   Japan                     7,486                    2.    US                        26,841                        2.   US                       46,544
3.   China                     6,006                    3.    Japan                     9,774                         3.   India                    38,484
4.   UK                        4,989                    4.    India                     7,848                         4.   Japan                    11,959
5.   Germany                   4,416                    5.    UK                        6,082                         5.   Brazil                   10,624
6.   France                    3,401                    6.    Germany                   6,047                         6.   UK                       9,112
7.   Spain                     3,271                    7.    France                    5,136                         7.   Germany                  8,477
8.   Italy                     2,993                    8.    Italy                     4,053                         8.   France                   7,909
9.   Canada                    1,618                    9.    Brazil                    3,799                         9.   Russia                   6,811
10. Australia                  1,324                    10. Spain                       3,756                         10. Mexico                    5,965
11. Brazil                     1,019                    11. Russia                      2,922                         11. Italy                     5,601
12. India                      945                      12. Canada                      2,810                         12. Turkey                    5,502
13. Republic of Korea          935                      13. Republic of Korea           2,515                         13. Indonesia                 5,129
14. Russia                     413                      14. Australia                   2,286                         14. Spain                     4,992
15. Turkey                     352                      15. Mexico                      1,804                         15. Canada                    4,761
16. South Africa               250                      16. Turkey                      1,738                         16. Vietnam                   4,426
17. Saudi Arabia               244                      17. Indonesia                   1,394                         17. Republic of Korea         4,191
18. Mexico                     241                      18. Saudi Arabia                1,088                         18. Australia                 3,812
19. Indonesia                  187                      19. Vietnam                     933                           19. Nigeria                  3,514
20. Vietnam                    113                      20. South Africa                843                           20. Saudi Arabia             3,303
21. Argentina                  86                       21. Argentina                   637                          21. South Africa              2,722
22. Nigeria                    47                       22. Nigeria                     524                          22. Argentina                 2,205

Source: IMF for 2009, PwC model projections for 2030 and 2050 (note the rankings relate only to these 22 countries; we would not rule out other developed countries
featuring in the rankings for some time periods although these are likely to lose ground to the emerging economies over time).


                                                                                                                                                Banking in 2050, May 2011 19
• Developed economies’ financial
Figure 12: Average annual real growth rates of domestic banking          systems came under severe stress
assets 2010-2050 (% pa in US $ terms)                                    due to the crisis. The value of
                                                                         assets declined sharply and some
                                                                         financial institutions faced potential
                                                                         bankruptcy and had to be bailed out
              Spain                                                      by governments. Emerging economies
                                                                         by contrast were relatively shielded
              Japan
                                                                         from these effects, leaving their
                 UK                                                      banking systems in much better shape
                Italy                                                    to fund long-term economic growth.

          Germany                                                      • The financial crisis therefore led to
                                                                         a general downward revision for the
             France
                                                                         estimates of sustainable trend growth
           Australia                                                     across many developed economies,
            Canada
                                                                         but little change in long-term trend
                                                                         growth projections for the major
                 US                                                      emerging economies (or even
Republic of Korea                                                        upgrades due to the crisis revealing
                                                                         their greater resilience relative to
              Brazil
                                                                         earlier crises that often tended to
           S. Africa                                                     focus on emerging economies such as
                                                                         Latin America in the 1980s and early
              China
                                                                         1990s or Asia in the late 1990s).
          S. Arabia

             Turkey
                                                                       Banking growth
             Russia
                                                                       differentials between
            Mexico
                                                                       emerging and
         Argentina
                                                                       developed economies
         Indonesia
                                                                       The strong growth in emerging
           Vietnam                                                     economies’ domestic banking assets can
               India                                                   be seen in Figure 12 where we plot the
                                                                       compound annual growth rate of the
            Nigeria                                                    different economies domestic banking
                                                                       assets. Here we note that the emerging
                        0       2   4   6       8       10        12
                                                                       and developed economies can be
                                                                       divided into two groups: the developed
Source: PwC model projections                                          economies appear to have low growth
                                                                       (e.g. from US upwards in the chart),
                                                                       whereas emerging economies tend to
                                                                       have high growth rates, with Republic of
                                                                       Korea as an intermediate case as with our
                                                                       long-term GDP projections.


20 Banking in 2050, May 2011
In our model the level of the quantity
Figure 13: Net interest margin by country (2008)                               of banking assets is determined by both
                                                                               the overall size of the economy and
                                                                               the rate of growth in GDP per capita,
                                                                               which is assumed to translate into a rise
                Spain                    Average NIMs by country group         in the ratio of banking assets to GDP
                  UK                       G7 weighted average = 2.6%          as economic development proceeds.
                Japan
                                            E7 weighted average = 4.1%         Stronger rates of growth in both of these
                                           All, weighted average = 2.8%        variables push up emerging economy
          Australia                                                            banking assets in our model. Nigeria,
           Canada                                                              India, Vietnam, China and Indonesia
                                                                               have the highest rates of growth in
          Vietnam
                                                                               GDP and GDP per capita in our sample
                 India                                                         and this translates to strong growth in
                                                                               banking assets as well, albeit subject to
            France
                                                                               many uncertainties as discussed above
         Germany                                                               and dependent on continuing to pursue
                China                                                          broadly growth-friendly policies in these
                                                                               countries.
                 Italy
                                                                               As described in Section 3, this growth
Republic of Korea
                                                                               is generally driven by improvements
         S. Arabia                                                             in physical and human capital in
                  US
                                                                               emerging economies and catching up
                                                                               with technology levels in developed
           Mexico                                                              economies. We also expect the real
            Nigeria                                                            market exchange rate of all the emerging
                                                                               economies to appreciate over time to
            Turkey                                                             come in line with purchasing power
         Indonesia                                                             parity estimates. This increases banking
                                                                               assets measured in $ terms in all these
            Russia
                                                                               emerging markets. Population growth
          S. Africa                                                            also contributes positively to growth in
         Argentina                                                             India, Vietnam, Indonesia and Nigeria.
                                                                               There is a much lower contribution from
                Brazil                                                         population growth in China as a result of
                                                                               its ageing population and its one
                         0   2   4   6     8       10      12      14     16
                                                                               child policy.

Source: Fitch


                                                                                                     Banking in 2050, May 2011 21
increased financial sophistication and the
Figure 14: Illustrative banking profits pool projections for the E7                                                  realisation of scale economies.
and G7 based on net interest margins on assets (at constant 2009 US $)
                                                                                                                     Some emerging economies such as
                                                                                                                     China, India and Vietnam tend to have
                                                                                                                     relatively low NIMs. We expect that this
                                                                                                                     is a result of the relatively high levels of
                                                                                                                     lending to state companies. Such activity
                                                                                                                     is likely to result in reduced banking
            E7                                                                                                       profits as capital is often allocated to
                                                                                                                     achieve political objectives rather than
                                                                                                                     necessarily pursuing the most profitable
                                                                                                                     opportunities (as would otherwise occur
                                                                                                                     in a free market). Over time, however,
                                                                                                                     lending to the private sector is becoming
                                                                                                                     more important in these economies and
            G7
                                                                                                                     profitability levels should tend to increase
                                                                                                                     over time.
                                                                                                                     Finally we note that most developed
                 0      500       1000    1500   2000    2500     3000      3500      4000     4500      5000        economies tend to have lower NIMs,
                                                                                                                     whereas emerging economies exhibit a
                               Net interest income on domestic assets (constant 2009 $bn)                            broad range. However, almost all of the
                 n 2010 n 2030 n 2050                                                                                higher value NIMs belong to the emerging
                                                                                                                     economies. The US is interesting in that
Source: PwC analysis drawing on base year data from Fitch and the IMF                                                it has the highest NIM for the developed
                                                                                                                     economies, which could be a reflection of
                                                                                                                     its many regional banks.
                                                                                                                     Projecting our NIM measures to 2050 we
                                                                                                                     can investigate how profitable banking
Banking profits                                          them so that they converge to a weighted                    sectors could be by 2050 (Figure 14). The
                                                         average9 of NIMs over 2004-200810 by                        key point from this graph is that the E7
projections                                              2030. We use the 2008 values so as to                       sees a large increase in its share of global
Based on our projections for banking                     start from a position that reflects the                     banking profits in relation to the G7
assets in each economy we can estimate                   current economic situation as accurately                    over time. The E7’s profit pool is around
the potential profits of the banking sector              as we can. We use a weighted average for                    50% larger than that of the G7’s by 2050
associated with these assets. We have                    the convergence value of the NIM based                      having already not been far behind in
used data from Fitch on the net interest                 on 2004-08 data rather than 2008 data                       2030. In our last report we expected
margin (NIM) for banks in the different                  alone because this provides a more robust                   this E7 vs G7 difference in 2050 to be
economies as a measure of profitability.                 basis for the long-term projections due to                  around 25% (based on profits analysis
We have used net interest margin as an                   potential short-term distortions to NIM                     derived from RoA), but the short and
indicator because we expect it to be less                levels in 2008 from the financial crisis.                   long term effects of the financial crisis has
volatile in times of economic stress than                                                                            intensified this trend.
                                                         From Figure 13 we can see that Brazil has
return on assets (RoA), which we used                    a particularly high NIM, making it a clear
in our 2007 Banking in 2050 report.                      outlier from the rest of the countries.
NIM is also a more direct measure of the                 There are a number of reasons why this
income from banking assets, which we                     may be the case: for example, Brazil
can then relate to the long-term changes                 has many banks still operating at low
in the economy. Alternative measures of                  economies of scale, keeping costs high;
profitability such as RoA tend to include                a large portion of lending is directed to
other sources of income such as fees,                    households limiting the opportunities
which we cannot always relate directly to                for wholesale financing, and Brazil
the ownership of bank assets.                            has been subject to episodes of high
In Figure 13 we present estimated average                inflation in the past. In our convergence
NIMs for our 22 countries in 2008. In our                scenario we expect that, as Brazil
analysis we use these values as a proxy for              develops, its banks will see lower NIMs
the 2009 values and then linearly project                as a result of increasing competition,


                                                         9 We use the country’s domestic assets in 2009 as the weights in the weighted average calculation.
22 Banking in 2050, May 2011                             10 Our weighted average of NIMs includes the NIM for Brazil.
6. Conclusion and
  key questions

The conclusion from our       How are banking
analysis is that shifts from  systems going to adapt?
the G7 to the E7 in the       How will banking and financial systems
global shares of domestic     in emerging and developing economies
banking assets and related    evolve in response to the rising
profits are accelerating      significance of emerging economies?
                              For instance where will all the new capital
following the financial       to underpin these additional banking
crisis. However, our analysis assets come from? Will it come from
also raises questions as      domestic sources or will we see increased
to how the global banking     levels of international capital flows?
industry will evolve over the As the emerging economies develop they
next few decades. To address will require increasingly sophisticated
                              financial services and banks are likely to
all of these issues would     expand to meet this need and reap the
take us beyond the scope of   benefits of greater economies of scale as
this report. In this section, a result. This then throws up questions
                              about the strategic options and scenarios
however, we outline some
                              that banks in emerging and developed
key questions arising as a    economies should be looking at, as well as
stimulus for future debate.   how policy-makers should respond to this
                                     challenge. For example:
                                     • Will we see increasing consolidation
                                       in markets that take smaller shares of
                                       the global pot (e.g. Europe)?


                                                          Banking in 2050, May 2011 23
• Will we see overseas expansion of                  emerging economies that had in the                        their business models in the post-crisis
     banks from the emerging economies                  past experienced severe financial/                        environment. Such large changes
     (e.g. following the earlier approach               economic crises (e.g. Mexico,                             require a comprehensive look from all
     of some universal US and UK banks in               Argentina and Indonesia) had long                         angles of a bank’s business from how
     global markets), or will they tend to              recovery periods in excess of 5 years,                    it supports its people and operations
     focus their operations mostly within               as shown in the decline of their                          through to its governance, legal and
     their own home economies or as a                   domestic banking asset to GDP ratios                      tax structures.
     support to the overseas trading of                 for many years after these crises. We
     domestic companies (e.g. as                        also saw particularly high levels of
     has tended to be the case for the                  domestic assets relative to GDP in                   Other socio-economic
     Japanese banks).                                   Spain and the UK. The lesson from                    issues
                                                        history may be that it will take a long
   • Will economies develop market or                                                                        Over the projection period we can expect
                                                        time for these countries to deleverage
     bank oriented financial systems?                                                                        to face substantial socio-economic
                                                        following the crisis and return their
     Could we, for example, come to                                                                          challenges that may affect the type of
                                                        economies and banks to a healthy
     see more financial intermediation                                                                       borrowing and lending required. Issues
                                                        position (the problems of Japan since
     through banks, or will we see greater                                                                   such as ageing societies, increasing
                                                        the early 1990s is another example
     disintermediation? How will this                                                                        demand for natural resources, the effects
                                                        here of how long such adjustment can
     affect incumbent banks in these                                                                         of climate change and the move to a low
                                                        take after a banking crisis, although
     markets and potential entrants?                                                                         carbon economy will all pose challenges
                                                        that was an extreme case).
                                                                                                             to the banking industry but also create
   • How can established banks from
                                                    • Changes in regulation since the                        potentially significant new business
     emerging economies tap into the
                                                      financial crisis will play a profound                  opportunities.
     markets where expected profits
                                                      role in the development of the
     are highest? Will policy-makers in                                                                      In ageing societies, for instance, we might
                                                      banking industry going forward.
     emerging economies open up their                                                                        expect to see changes in the balance
                                                      For instance, increased capital
     markets to foreign competition?                                                                         between consumption and saving. How
                                                      requirements from the Basel III
                                                                                                             will increasing dependency ratios in
   In our reports “The Day After                      regulations and associated national
                                                                                                             economies with ageing populations affect
   Tomorrow”11, and “The Future of                    changes, which are designed to
                                                                                                             the demand for credit and saving? As
   Banking”12 we reviewed some of these               increase the level of buffers in the
                                                                                                             increasing proportions of the population
   issues, focussing on the key questions             financial system, could see decreased
                                                                                                             draw down their wealth for consumption
   that will shape the strategies of banks            profitability of banks. However, the
                                                                                                             in retirement, where will this money
   as they recover from the financial crisis.         rules are not complete and the full
                                                                                                             be spent? How will banks manage
   With significant changes in the banking            impact of these regulations will take
                                                                                                             this transition and how will it affect
   landscape already in progress, it will             years to understand. Despite this, their
                                                                                                             profitability in the sector? In our recent
   be important for banks to adapt their              effects are likely to be felt, at least in
                                                                                                             publication “The New Rule of 10%” we
   strategies accordingly.                            part, almost immediately as regulators
                                                                                                             examined the likely drivers and possible
                                                      and market counterparties hold banks
   What effects from the financial crisis will                                                               impacts on financial institutions in the US
                                                      to the new requirements. In addition,
   have long lasting effects?                                                                                from changes in the saving rate. In this
                                                      it is likely that further banking and
                                                                                                             report we identified the need for financial
   Economic volatility from the financial             financial sector regulations and or
                                                                                                             institutions to re-examine their strategies;
   crisis still remains, with high levels of          amendments to existing regulations
                                                                                                             whether it be changing business models,
   leverage still in place in many developed          will be implemented at national and/
                                                                                                             development of wealth management
   economies. This poses important                    or international level. Therefore the
                                                                                                             services, or becoming less reliant on
   questions as to how the global banking             regulatory outlook and its impact
                                                                                                             consumer lending and transactions
   industry will change in the longer                 remain very uncertain for the
                                                                                                             revenue.14
   term as a result of the financial crisis.          banking sector.
   For example:                                                                                              While we expect these socio-economic
                                                    • Such significant changes in the
                                                                                                             developments and issues to determine
   • How long will it take for the major              banking industry will affect the way
                                                                                                             the range of financial services in
     developed economies to recover                   that banks operate, and how they
                                                                                                             different economies, however, they do
     fully from the crisis? With many                 structure themselves to deliver their
                                                                                                             not affect the broad conclusion of a shift
     economies still bearing high levels              services. We focussed on this in our
                                                                                                             in economic power from the developed
     of debt, how long will it be before              recent publication “Operating in the
                                                                                                             to the emerging economies that is the
     they return to more sustainable                  Future”13, where we reported on the
                                                                                                             central theme of this report.
     levels? We saw in Section 4 that some            challenges facing banks in reforming


                                                 11 “The Day After Tomorrow”, http://www.pwc.co.uk/eng/publications/the_day_after_tomorrow_pwc_perspective_on_
                                                    the_global_financial_crisis.html
                                                 12 “The Future of Banking”, http://www.pwc.co.uk/eng/publications/the_future_of_banking_july_2009.html
                                                 13 “Operating in the Future: Is your operating vision clearly defined?”, http://www.pwc.co.uk/eng/publications/
                                                    operating_in_the_future.html
                                                 14 “The New Rule of 10%”, http://www.pwc.com/us/en/financial-services/publications/viewpoints/viewpoint-US-
24 Banking in 2050, May 2011                        savings-rate.jhtml
Annex: Methodology
  and data

Long-term economic                            The assumptions used in this model
                                              reflect a broad range of research by bodies
growth model                                  such as the IMF and the World Bank, as
The model used to project long-term           well as leading academic economists.
economic growth in this paper is              While any such assumptions are subject
described in detail in our earlier series     to many uncertainties, we believe that the
of “The World in 2050” reports.               baseline economic growth scenario used
The model is a standard one in the            in this paper is plausible.
academic research literature in which
economic growth is driven by four
main factors feeding into an aggregate
                                              Exchange rate
production function:                          projections
• Technological progress, including           Purchasing power parity (PPP) exchange
  ‘catch-up’ effects for emerging             rates are assumed to remain constant
  economies that vary according to            over time in real terms, while market
  their state of institutional                exchange rates converge gradually over
  development and stability;                  time to these levels in the very long-
                                              term (due to faster productivity growth
• Demographic change, in particular           in the emerging economies relative to
  the growth rate of working age              the developed economies). This means
  population;                                 that the relative value of E7 and other
• Investment, in plant, machinery,            emerging banking markets in dollar terms
  buildings and other physical assets,        tends to rise in the long run due both to
  which contribute to the long-term           faster economic growth in these countries
  growth of the capital stock in the          and to projected real exchange rate
  economy; and                                appreciation.
• Trends in education levels, which
  are critical to the quality of the labour
  force and their ability to make the
  most of new technologies.


                                                                    Banking in 2050, May 2011 25
Banking assets data                            results than more sophisticated panel          A maximum limit of domestic credit of
                                               data analysis, which suffered from             250% of GDP was imposed in our model
and projections                                some econometric problems due to               reflecting our assumptions on the upper
For banking assets, we used data on            autocorrelation of residuals. After some       limit to a sustainable level of debt in an
total domestic credit (to households,          experimentation, a log-linear relationship     economy. Under ordinary conditions we
companies and government) since this           between domestic credit to GDP ratios          would expect debt levels to remain lower
seemed most likely to be related to GDP.       and GDP per capita levels in PPP terms         than 200% based on the experience in
For consistency, all such data were taken      provided the preferred basis for our           Switzerland (where the ratio appears to
from the latest online version of the          projections model. We found a highly           have topped out at around 180% over the
IMF’s International Financial Statistics       statistically significant (at the 99% level)   past decade) and analysis of minimum
database.                                      positive relationship between these            plausible interest cover ratios based on
                                               two variables. As the most recent data         US and UK data. However, recent data
Using the results from our 2007 analysis,      points available in 2008-9 are subject to      in the UK and Spain show domestic
we see a clear and statistically significant   distortion due to the financial crisis, we     banking asset to GDP ratios in excess
positive relationship between GDP per          used the original relationship between         of 200%. Therefore we have raised our
capita growth and the average annual           the growth in the ratio of domestic credit     maximum ratio limit, but imposed higher
rise in the domestic credit to GDP ratio.      to GDP and GDP per capita growth in            convergence rates on these two countries
In other words, the faster an economy          earlier years to ensure that the long-term     to reflect our view that their overall level
develops, the faster its banking sector        projections were not reflecting mid-crisis     of assets will fall to more sustainable
grows relative to the economy as a whole.      conditions.                                    levels in the long run as described above.
This relationship is measured using            Given our projections for GDP per capita
IMF data over several decades in most
cases, which gives some reassurance
                                               in PPP terms, we were therefore able to        Banking profits data
                                               project forward a ‘target’ domestic credit
in projecting forward a broadly similar        to GDP ratio for each country, with the        and projections
relationship in the long-term. In practice,    exception of the US, where we used a           Our data on banking profits were sourced
of course, this will not be a smooth           country-specific time series trend. For        from Fitch and covered the leading banks
process: there will be economic and credit     the other countries, we then assumed in        in each of the countries included in our
cycles of varying length and severity          our baseline scenario that their actual        model. We used net interest margin
in all countries that we cannot hope           domestic credit to GDP ratios converged        (NIM) as a measure of profits, instead of
to predict with any accuracy. We can,          gradually to their target ratios, with 2% of   return on assets (RoA), which we used in
however, look through these short-to-          the difference being eliminated each year      our 2007 analysis. The rationale for this
medium-term cycles to identify plausible       on this convergence path. For China, we        is that net interest margin is likely to be
scenarios for the long-term underlying         assumed a somewhat higher convergence          a less volatile measure of banking profits
trend in banking sector assets by country,     ratio of 3%, since there is evidence from      than return on assets and therefore is a
and here we are more confident about           the past couple of years that the ratio        better starting point for setting long-term
making broad projections based on the          is likely to decline more rapidly in the       projections.
underlying trends seen in the historic         short-term due to past problems with
data. This is particularly true when           non-performing loans being corrected,          We assumed a scenario of linear
looking at portfolios of countries such as     although the ratio should then rise again      convergence from the net interest margin
the E7, within which individual country        in the longer term as the retail lending       ratios shown in Figure 13 to a global
variations in the long-term health of the      market in particular grows rapidly. We         weighted average net interest of 3.1%
banking sector should tend to cancel out       also assumed higher convergence rates          from 2030 onwards. This can be taken
over time.                                     for the UK, Spain and Australia of 4.5%,       to reflect the impact of cross-border
                                               4.5% and 3% respectively. The rationale        competition and M&A in normalising
In our 2007 analysis, we carried out a
                                               for this is that in the past few years these   profits across the banking sectors of the
variety of statistical analyses of trends
                                               countries have seen sharp increases in         major world economies.
in the banking assets to GDP ratio over
time and across countries, using GDP           the levels of domestic assets relative to      This net interest margin scenario was
per capita levels as the key explanatory       GDP that we expect to fall back over the       then combined with our GDP growth and
variable. For the purposes of providing        course of the projection period to more        domestic credit to GDP ratio scenarios to
a basis for future projections, we found       sustainable levels in the long-term.           produce banking profits pools projections
that simple cross-sectional relationships                                                     in the G7 and the E7 economies, as
tended to produce more plausible                                                              summarised in Figure 14 in the main text.


26 Banking in 2050, May 2011
Contacts
The authors of this report are John Hawksworth, Head of Macroeconomics, PwC (UK)
and Douglas Niven of the PwC (UK) Economics Practice, who also made an important
contribution to the economic research underlying this report. The main editor of the
report is Nick Page, Partner, Transaction Services, Financial Services PwC (UK).
The PwC economics practice offers a wide range of services, covering competition and regulation issues, litigation support, bids
and business cases, public policy and project appraisals, financial economics,the economics of sustainability and macroeconomics.
For more details of these services, please visit our website: www.pwc.com/uk/economics
If you would like to discuss the issues raised in this report in more detail, please contact your usual PwC contact or
anyone of those listed.


Authors                                                    PwC Global Financial                                        David Law
                                                                                                                       PwC UK
John Hawksworth                                            Services Leadership                                         +44 131 524 2379
Chief Economist
PwC UK
                                                           Team                                                        david.law@uk.pwc.com

+44 20 7213 1650
                                                           Nigel Vooght                                                David Newton
john.c.hawksworth@uk.pwc.com
                                                           Global Financial Services Leader                            PwC UK
Douglas Niven                                              PwC UK                                                      +44 20 7804 2039
PwC UK                                                     +44 20 7213 3960                                            david.newton@uk.pwc.com
+44 20 7804 2775                                           nigel.j.vooght@uk.pwc.com
douglas.r.niven@uk.pwc.com                                                                                             Dominic Nixon
                                                           Barry Benjamin                                              PwC Singapore
                                                           PwC US                                                      +65 6236 3188
Editor                                                     +1 410 659 3400                                             dominic.nixon@sg.pwc.com
Nick Page                                                  barry.p.benjamin@us.pwc.com
PwC UK                                                                                                                 Phil Rivett
+44 20 7213 1442                                           Antony Eldridge                                             Global Financial Services Chairman
nick.r.page@uk.pwc.com                                     PwC UK                                                      PwC UK
                                                           +44 20 7804 2614                                            +44 20 7212 4686
                                                           antony.eldridge@uk.pwc.com                                  phil.g.rivett@uk.pwc.com

                                                           James Flanagan                                              Robert Sullivan
                                                           PwC US                                                      PwC US
                                                           +1 646 471 5220                                             +1 646 471 8388
                                                           james.f.flanagan@us.pwc.com                                 robert.p.sullivan@us.pwc.com

                                                           Craig Hamer                                                 Jon Terry
                                                           PwC UK                                                      PwC UK
                                                           +44 20 721 24990                                            +44 207 212 4370
                                                           craig.x.hamer@uk.pwc.com                                    jon.p.terry@uk.pwc.com


This publication has been prepared for general guidance on matters of interest only, and does not constitute professional advice. You should not act upon the information
contained in this publication without obtaining specific professional advice. No representation or warranty (express or implied) is given as to the accuracy or completeness
of the information contained in this publication, and, to the extent permitted by law, PricewaterhouseCoopers does not accept or assume any liability, responsibility or duty
of care for any consequences of you or anyone else acting, or refraining to act, in reliance on the information contained in this publication or for any decision based on it.
For more information about this report contact Áine Bryn, Global FS Marketing, PwC UK, on +44 207 212 8839 or at aine.bryn@uk.pwc.com. For additional copies contact
Maya Bhatti, Global FS Marketing, PwC UK, on +44 207 213 2302 or at maya.bhatti@uk.pwc.com
www.pwc.com/financialservices

© 2011 PwC. All rights reserved. Not for further distribution without the permission of PwC. “PwC” refers to the network of member firms of PricewaterhouseCoopers
International Limited (PwCIL), or, as the context requires, individual member firms of the PwC network. Each member firm is a separate legal entity and does not act as
agent of PwCIL or any other member firm. PwCIL does not provide any services to clients. PwCIL is not responsible or liable for the acts or omissions of any of its member
firms nor can it control the exercise of their professional judgment or bind them in any way. No member firm is responsible or liable for the acts or omissions of any other
member firm nor can it control the exercise of another member firm’s professional judgment or bind another member firm or PwCIL in any way.

Banking in 2050 by PwC

  • 1.
    www.pwc.co.uk/financialservices Banking in 2050 How the financial crisis has affected the long term outlook for the global banking industry. May 2011
  • 2.
    Contents 1. Executive Summary 3 2. Approach 6 3. How large will the emerging economies become? 8 4. Domestic banking assets – 12 historic trends 5. Projections of banking assets and 15 profits to 2050 6. Conclusion and key questions 23 Annex: Methodology and data 25
  • 3.
    1. Executive Summary The accelerating shift in industry. In this report we present updated projections on how large we economic power from the expect the banking industry to become developed to emerging in the world’s largest economies over economies is dramatically the next 40 years, building on our changing the banking 2007 report on this same topic that was produced prior to the onset of the industry across the world. financial crisis,1 and our updated GDP projections published earlier this year.2 Leaders of financial institutions need Our key findings are that: to take advantage of the growth opportunities this change is creating. • The emerging economies’ banking This report provides projections of the sectors are expected to outgrow those long-term trends of the banking sector in the developed economies by an based on the underlying macro-economic even greater margin than we projected trends, from now until 2050 for the before the financial crisis. world’s leading economies. • By 2050 the leading ‘E7’ emerging PwC* have prepared this report to help economies could have domestic organisations develop their long-term banking assets and profits that exceed strategy and plans. Our analysis quantifies those in the G7 by around 50%. the projected size and growth of the • China could overtake the US in terms banking sectors for different economies. of the size of their domestic banking We identify the projected timing of sectors by around 2023. the key transitions when the emerging economies become leading players. And • India has particularly strong long-term * “PwC” refers to the network of member firms of crucially, we demonstrate these changes growth potential and our projections PricewaterhouseCoopers International Limited (PwCIL), have accelerated since the period prior to suggest it could become the third or, as the context requires, individual member firms of the PwC network. the global financial crisis, placing greater largest domestic banking sector by 1 “Banking in 2050: How big will the emerging markets demands on industry leaders to respond 2050 after China and the US, but get?”, June 2007, http://www.pwc.com/gx/en/ effectively to these opportunities. ahead of Japan, the UK and Germany. world-2050/banking-sector.jhtml Brazil could also rise strongly up 2 “The World in 2050, The accelerating shift of global The recent global financial crisis shook the global banking league table economic power: challenges and opportunities”, the world economy and set in motion January 2011, http://www.pwc.com/gx/en/world-2050/ over this period. the-accelerating-shift-of-global-economic-power.jhtml significant changes to the banking Banking in 2050, May 2011 3
  • 4.
    Our long-term projectionsfor the E7 and Figure 1: Projections of domestic banking assets in the E7 and G7 G7 domestic banking assets are displayed in Figure 1. Over the projection period we expect the E7’s domestic banking assets 350,000 grow at a faster rate than those of the G7 resulting in the E7 overtaking the G7 around 2036. Domestic credit ($bn 2009 prices) 300,000 Table 1 presents the years in which 250,000 we project the emerging economies to overtake the developed economies. We 200,000 compare these projections with those 150,000 from our 2007 analysis, and broadly we find that the emerging economies 100,000 overtake the developed economies earlier than in our original projections. 50,000 This suggests that the financial crisis has brought about an acceleration in the shift 0 in economic power from the developed to 2009 2014 2019 2024 2029 2034 2039 2044 2049 the emerging economies. n G7 n E7 n World Source: PwC analysis, IMF Table 1: Dates at which E7 economies overtake G7 in terms of the size of their domestic banking assets Overtaking year Overtaking year Country pairs (2011 analysis) (2007 analysis) E7 overtakes G7 2036 2046 China overtakes US 2023 2043 India overtakes Japan 2033 2041 Brazil overtakes UK 2045 - Russia overtakes Italy 2039 2047 Mexico overtakes Italy 2048 2038 Turkey overtakes Canada 2045 - Source: PwC model projections (where no date is shown this indicates overtaking dates beyond 2050) 4 Banking in 2050, May 2011
  • 5.
    What questions does • How will new regulatory capital and other requirements impact these this analysis raise? growth trends globally and within The analysis in this report can help geographies where implementation banks, other financial corporations and may be more or less restrictive? How policy-makers to identify the key long- will the use of securitisations impact term macroeconomic trends likely to these growth trends? affect banking over the next 40 years. • he pace of prospective growth in T This should help to stimulate strategic global banking assets is likely to discussions and identify key opportunities exceed the sector’s capital generation and threats relating to the emerging from retained earnings raising the markets in particular. question: where will the capital to Particular questions your organisation support the growth in banking assets may want to consider are: come from? • Which economies have the greatest • o what extent will non-bank T future potential for growth and investors such as funds and insurance investment? What are the areas of companies be able to access the greatest competitive advantage for our lending markets across the world organisation? directly (as lenders) or indirectly (through securitisations)? • What growth strategies are open to our business to compete in this • ill the asset growth in Asian banks W shifting global landscape? create a new cadre of international Will competition become more banks that will come to dominate intense? Is greater consolidation the global markets and feature an effective strategy? How should prominently in banking M&A? What opportunities be valued given these threat could this pose to the current growth expectations? leading banks and could this lead to a defensively inspired phase of banking • hat types of banks will we see W consolidation? developing in the emerging economies (e.g. universal high street banks or more specialised or localised players) and how will they integrate with and shape the future evolution of the global financial system (e.g. as regards dominant currencies)? Banking in 2050, May 2011 5
  • 6.
    2. Approach Overview In this section we present an overview of our methodology. We follow broadly the same approach that we used in our 2007 analysis, as summarised in Figure 2. Starting from GDP projections (as reported in the latest update of our “World in 2050” report in January 20113), we then developed projections for the amount of domestic banking assets in each economy. We investigated banking profits by applying a country specific net interest margin to the domestic assets. The technical details of this approach are given in the Annex. Figure 2: Global banking projections model structure GDP GDP & GDP/Capita model assumptions projections from PwC model to 2050 Banking assets to GDP ratio Banking assets Regression trend analysis (charts) projections analysis Return on assets trend Banking profit Expert analysis projections judgement Note: all projections done by country then aggregated to global level Source: PwC model 3 “The World in 2050, the accelerating shift of global economic power: challenges and opportunities”, January 2011, http://www.pwc.com/gx/en/world-2050/the-accelerating-shift-of-global-economic-power.jhtml 4 Note that these five countries were not included in our 2007 ‘Banking in 2050’ report, but are included here as they have long-term potential and were included in the latest update of our ‘World in 2050’ GDP projections. 6 Banking in 2050, May 2011 5 We concentrate on domestic lending only as this allows for the greatest consistency in data between countries.
  • 7.
    We included thefollowing 22 countries We also combined these GDP projections In our 2007 report we used return on in the analysis on the basis that, based on with UN population projections to assets (RoA) as our measure of banking earlier model projections, we expect them determine GDP per capita trends. profitability. However, we decided not to to have the largest economies in the world From previous research, we know this use this measure in this updated analysis by 2050: per capita income measure is a useful because it has become much more volatile indicator of the state of development over the course of the financial crisis G7 countries: US, Japan, Germany, of each economy, which is a key driver and so less reliable as a starting point UK, France, Italy, Canada of the size of an economy’s banking for a long-term profitability analysis. E7 countries: China, India, Brazil, sector as a share of GDP. NIM rates have been less volatile and are Russia, Mexico, Indonesia, Turkey more closely related to the domestic asset Domestic banking asset projections base used in this study as the measure of Other developed economies: banking size in each country. Australia, Republic of Korea, Spain Our baseline projections were derived by Newly emerging economies: assuming an underlying upward trend in the domestic5 credit to GDP ratio in Key assumptions and uncertainties Argentina, Vietnam, Nigeria, Saudi Arabia, South Africa4 line with historic trends for the countries Our analysis rests on the following broad concerned (using IMF data). We also assumptions: allow for gradual convergence to the GDP projections norm for countries with relatively high or 1. Governments follow broadly growth- friendly policies across the period We began by taking our updated low initial banking to GDP ratios relative for the projections (e.g. maintain long-term GDP projections as the basis to their state of economic development. reasonable macroeconomic stability, for our projections for domestic credit. This convergence occurs at a relatively remain open to trade and investment, As explained further in the Annex, these slow rate of around 2-4.5% per annum, maintain a reasonable rule of law etc.) projections incorporate the effects of: depending on the country concerned (as explained further in the Annex). 2. There are no catastrophic events that • the expected growth of the working permanently throw growth off track age population (as projected by Having generated these projections for (e.g. nuclear war, major global climate the UN); the ratio of domestic credit to GDP, we disasters) – as opposed to temporary then obtained the absolute amount of • projected growth of human capital cyclical fluctuations that we ignore domestic credit by applying these ratios (proxied by education levels) and as we are focusing here on long-term to our GDP projections at market physical capital (driven by assumed potential growth. exchange rates. investment to GDP ratios after These assumptions are, of course, allowing for depreciation of the Banking profitability subject to many uncertainties over the existing capital stock); and projection period. Our results should • total factor productivity growth We investigated the projected profitability therefore be taken as indications of the (global technological progress and for the banking sector by determining potential future scale of domestic banking lower income countries catching up the profits from the net interest margin assets and profits conditional on these with richer ones by making use of (NIM) on domestic banking assets for assumptions, rather than being forecasts their technologies and resources). each economy. Our approach was to take to which spurious precision is attached. data from Fitch on the NIM in different The purpose of the analysis is to point The projections also allow for real countries, and to project forward these to broad strategic trends in the long run exchange rate increases over time in values under a convergence scenario not to make detailed predictions that are the emerging economies linked to their where the NIM in each country tends to bound to be wrong to a greater or lesser stronger expected productivity growth a common value by 2030 (given by the degree given the uncertainties involved in (the so-called Balassa-Samuelson effect). global weighted average NIM in 2004-8). any such long-term exercise. This means that real GDP growth in Applying the projected NIM rates to the emerging economies is typically higher domestic assets in an economy gives a when measured in US $ terms than in measure of income from lending activity domestic currency (or PPP terms). and thus indicates the level of profits. Banking in 2050, May 2011 7
  • 8.
    3. How largewill the emerging economies become? Our analysis for banking The global economic assets rests heavily on the power shift from the G7 trends in GDP and GDP to the E7 is speeding up per capita of the countries “World in 2050: The accelerating shift studied. In our research in global economic power: challenges “World in 2050”, we and opportunities” presents our GDP published our projections projections for the 20 largest economies of the GDP for the different in the world. We have used the results from this analysis to determine the size economies considered in of domestic credit in these economies. this report. In this section Therefore to understand the results for we highlight some of the key the banks, it is useful to first understand the main changes we expect to see in the findings from this research size of these economies. relevant to the results for Figure 3 shows the GDPs of the E7 and our banking projections. G7 in 2009 and our updated projections for 2050 (measured in constant 2009 US$ at market exchange rates). We see from the chart that in 2009, the GDP of the E7 is approximately one third the size of the G7, but by 2050 the E7 could grow to be more than 60% larger than the G7. Our analysis also suggests that the E7 could overtake the G7 in terms of GDP at market exchange rates in around 2032 (at PPPs this could occur by 2020, but this is less relevant for the present report). 8 Banking in 2050, May 2011
  • 9.
    Figure 3: GDPprojections for the G7 and the E7 to 2050 120,000 100,000 GDP ($ bn 2009 prices) 80,000 60,000 40,000 20,000 0 2009 2050 n G7 n E7 Source: IMF for 2009, PwC model projections for 2050 We expect China could overtake the US allowing also for potential real exchange by around 2030 based on GDP measured rate increases. This makes it one of the by market exchanges rates (it could be most rapidly growing economies over this before 2020 based on PPPs). However, time period. However, to sustain these we expect China’s rate of growth to slow high growth rates India must continue down over time due to its rapidly ageing to pursue growth-friendly policies (e.g. population as a result of its single child invest in infrastructure, open up its policy and as its growth needs to become markets to increased competition, reduce increasingly based on its own innovations budget deficits, increase rural education rather than just replicating the levels particularly for women and reduce innovations of the developed economies. bureaucracy). India’s rate of growth by contrast is Table 2 shows how the projected average expected to overtake that of China’s in the growth rate for GDP measured in constant long run as it has more catch-up potential 2009 US $ at market exchange rates can and its working age population growth be broken down into three components: will be much stronger in the long-term. population growth, real GDP per capita India’s share of global GDP in $ terms growth and a real exchange rate change. could therefore increase from only 2% in 2009 to around 13% in 2050 after Banking in 2050, May 2011 9
  • 10.
    Table 2 Componentsof projected potential GDP growth (% pa average, 2010-50) Country Contribution Contribution Real GDP growth Changes in real Real GDP from population from real GDP in domestic market exchange growth in US growth (%) per capita currency rates (%) $ terms (%) growth (%) terms (%)* (A) (B) (C = A + B) (D) (E = C + D) Vietnam 0.7 6.1 6.8 1.9 8.7 India 0.8 5.3 6.1 1.9 8.0 Nigeria 1.5 5.0 6.5 1.3 7.8 China 0.1 4.6 4.7 1.1 5.8 Indonesia 0.6 4.1 4.7 1.1 5.8 Turkey 0.6 3.4 4.0 1.0 5.0 South Africa 0.3 3.6 3.9 1.1 5.0 Saudi Arabia 1.4 2.7 4.1 0.9 5.0 Argentina 0.6 3.0 3.6 1.2 4.8 Mexico 0.5 3.2 3.7 1.1 4.8 Brazil 0.6 3.3 3.9 0.5 4.4 Russia -0.7 3.2 2.5 1.4 3.9 Republic of Korea -0.3 2.6 2.3 0.9 3.2 Australia 0.7 1.9 2.6 -0.2 2.4 US 0.6 1.8 2.4 0.0 2.4 UK 0.3 2.0 2.3 0.1 2.4 Canada 0.6 1.7 2.3 -0.1 2.2 Spain 0.1 1.8 1.9 0.1 2.0 France 0.2 2.0 2.2 -0.5 1.7 Italy -0.2 1.9 1.7 -0.2 1.5 Germany -0.3 1.9 1.6 -0.3 1.3 Japan -0.5 2.1 1.6 -0.5 1.1 Source: PwC long-term GDP growth model projections (World in 2050 report, January 2011) 10 Banking in 2050, May 2011
  • 11.
    There are severalimportant points to note 3. The emerging economies’ market from these GDP projections: exchange rates are expected to appreciate over time in real terms 1. There is a natural segmentation due to relative stronger productivity of the countries into two groups: growth (the so-called Balassa- emerging economies (E7 and the Samuelson effect). This provides a newly emerging economies) with high boost to growth in all of the emerging expected rates of growth (typically economies when measured in 4% or more per annum including real real US$ terms. Note that this real exchange rate appreciation) and the exchange rate appreciation could arise developed economies (G7) with much due to nominal appreciation and/or lower rates of growth (typically less higher inflation rates in the countries than 2.5% per annum including real concerned.6 exchange rate changes). South Korea is an intermediate case here between Of course, as noted in the previous the E7 and G7. We will see a similar section, the precise growth projections E7-G7 growth differential when we shown in Table 1 are subject to many consider the expected growth rates of uncertainties and should be taken as domestic banking assets in Figures 4 indicators of economic potential rather and 5 on P13. than precise forecasts. However, the broad messages discussed above on 2. Projected changes in population have relative growth rates of emerging and an important effect on some countries’ developed economies seem likely to be relative growth rates. For instance, more robust. Russia, Japan and Republic of Korea are expected to experience population falls, depressing overall GDP growth. Nigeria, Saudi Arabia and India are all expected to experience strong population increases, thereby boosting overall GDP growth. Some advanced economies (e.g. US, Australia) are projected to have stronger population growth than some emerging economies (notably China due to its one child policy). 6 To illustrate this effect consider the problem of valuing a house located in the Euro zone in US$. Suppose its initial value is €100,000, and the market exchange rate is 1€/$. Then the value of the house in dollars is $100,000. Over time the value of the house will change as measured in local currency, reflecting local market conditions, the economy etc. Measured in US$ however, there could also be a corresponding change in value due to changes in the real exchange rate. If the euro appreciates against the dollar in real terms, it will be worth relatively more in dollar terms. So in our example, suppose that after one year there is an increase in the value of the house of 5% in the local market, and an appreciation of the euro against the dollar resulting in an exchange rate of 0.95 €/$. The value of the house at the end of the year is therefore €105,000 or $110,526. Here we can see that there is a higher rate of growth in the dollar value of the house, arising from the appreciating exchange rate, in addition to the increase in value due to local market conditions. The situation for international comparisons of GDP is analogous to this. Banking in 2050, May 2011 11
  • 12.
    4. Domestic banking assets – historic trends In this section we review how domestic banking assets in the countries of our study have varied over time. This is useful as it offers insights of important differences between countries and how they are likely to evolve. Country trends run, and therefore we project this ratio to fall over the coming decades to one that is more in line with other Developed economies developed economies. Figure 4 shows historical trends in the • The US has a relatively low ratio of ratio of domestic banking assets to GDP banking assets to GDP based on the for the major developed economies. The IMF domestic credit definition used general trend is that of a gradual upward here in comparison with most other trend in the ratio over time from around developed economies. This is likely 50-100% of GDP in 1986 to around to be due to the fact that in the US a 100-230% of GDP in 2009. However, much greater proportion of financing there are considerable variations in these takes place through securities markets trends across countries. We can note in rather than through bank lending.8 particular that: So whilst there are high levels of • The banking assets to GDP ratio leverage in the US economy as a for the UK and Spain has increased whole, a large proportion of this particularly strongly over the past 7 debt will be held by non-bank 7 For the UK, we looked at this issue of excessive public and private sector debt levels in detail in an article years, resulting in ratios of over 200% organisations, and therefore do not in our November 2010 UK Economic Outlook report, of GDP. This is the result of property feature in this analysis based on the http://www.pwcwebcast.co.uk/ukeo_nov2010_debt.pdf booms in these countries as well as the IMF definitions used for this study. 8 The average value of outstanding US securitised debt in 2009 has been variously estimated at between $3.6 role of leveraged private equity deals trillion and $5 trillion, or around 25-35% of US GDP. and general expansion of the financial However, whether it is appropriate to consider this as part of the assets of the banking sector, and whether sector’s role in these highly leveraged there may be double counting if we just add this into economies. We consider it most likely our measure of domestic credit, is less clear. For the purposes of this study, therefore, we note this point that this high level of credit relative but do not try to add in securitisation assets for the to GDP is unsustainable7 in the long US or other countries. 12 Banking in 2050, May 2011
  • 13.
    • South Koreais an interesting example Figure 4: Ratio of domestic banking assets to GDP in of a country that has changed from developed economies being an emerging economy into a developed economy over the last 30-40 years. Between 1988 and 2000 250.00 Republic of Korea had the lowest ratio of banking assets to GDP of the Domestic banking assets as % of GDP developed economies considered in 200.00 this study, but this ratio has since risen to a level more in line with the other developed economies. This mirrors 150.00 the broad trends we expect in the future from other emerging economies that are currently less far along the 100.00 development track than Republic of Korea (as discussed in Section 5 50.00 of this report). E7 Economies 0.00 1986 1991 1996 2001 2006 In Figure 5 we show the trend in the ratio of domestic banking assets to GDP for n Australia n Canada n France n Germany n Italy the E7 countries. We can note from this n Japan n Republic of Korea n UK n USA n Spain chart that: Source: IMF • China has by far the highest ratio of the E7 economies. In the past this has been due primarily to high levels of lending to state enterprises, although Figure 5: Ratio of domestic banking assets to GDP in the more recently property-related E7 economies lending has also grown rapidly in China and state enterprise lending 180.00 has declined in relative importance as the Chinese economy becomes Domestic banking assets as % of GDP 160.00 increasingly driven by private sector 140.00 companies. 120.00 • Some of the other countries display the effects of past financial and 100.00 economic crises. For instance, Brazil 80.00 has two sharp peaks in its ratio corresponding to its financial crisis 60.00 and hyperinflations between 1986 and 40.00 1994. More recently, however, its economy has been much more 20.00 stable and its longer term prospects 0.00 appear strong. 1986 1991 1996 2001 2006 n Brazil n China n India n Indonesia n Mexico n Russia n Turkey Source: IMF Banking in 2050, May 2011 13
  • 14.
    • From thelimited data we have for Figure 6: Ratio of domestic banking assets to GDP in newly Nigeria, we see a fair degree of emerging economies volatility that could originate from a combination of political uncertainty and its dependence on oil revenues. 140.00 In absolute terms, Nigerian banking assets remain low relative to GDP Domestic banking assets as % of GDP 120.00 but have long-term potential if the government can follow broadly 100.00 growth-friendly policies and diversify its economy away from oil in the long 80.00 run. Banking sector development will be an important element in 60.00 this process for Nigeria and other emerging economies that have 40.00 traditionally been heavily dependent on revenues from natural resources. 20.00 0.00 Key changes due to the 1986 1991 1996 2001 2006 financial crisis n Argentina n Saudi Arabia n South Africa n Nigeria n Vietnam We can see varied trends in how economies’ ratios of domestic banking Source: IMF ( no available 1994 data for Vietnam) assets to GDP have fared over the financial crisis period since 2007. In most developed economies this ratio kept on increasing, probably reflecting • Indonesia and Mexico have both Newly emerging economies a combination of a decrease/slowdown displayed sustained declining banking in GDP and increased lending to Figure 6 shows historic trends in banking asset to GDP ratios from 1999 and governments to finance their fiscal asset to GDP ratios in the newly emerging 1997 respectively, with Mexico interventions and growing budget economies. Our analysis of these stabilising around the middle of the deficits. For the E7 and newly emerging countries is limited by the availability of 2000s. This is most likely an after economies the ratios also increased, but data, but we can identify some effect of the Peso crisis (Mexico) and this largely reflected continued healthy broad trends: the Asian crisis (Indonesia), reflecting private sector growth after relatively a long recovery and rebalancing • Vietnam has shown a strongly short cyclical downturns due to the crisis. of their economies. This result is increasing ratio since 1998. As in In addition, some countries such as China important when we come to consider the case of China, this is most likely embarked on significant fiscal stimulus how developed economies will recover due to the large amount of lending programmes and encouraged higher from the financial crisis, particularly to state owned enterprises in earlier bank lending to prevent recessions for those that are highly leveraged periods combined with strong growth from taking hold. (e.g. UK, Spain). History suggests in property-related lending in more that it takes a long time for banking recent years. systems to recover fully from such • Argentina has seen a declining ratio major crises. of banking assets to GDP during its gradual and painful recovery from its financial crisis in the early 2000s. 14 Banking in 2050, May 2011
  • 15.
    5. Projections of banking assets and profits to 2050 Projections of domestic banking assets Figure 7 shows the key result of this report. It shows the projected trend level of domestic credit in the G7, E7 and the World over the period to 2050. We project E7 banking assets to grow significantly faster than those in the G7, and to overtake the G7 around 2036 (compared to around 2044 in our 2007 report on this topic). The financial crisis therefore does appear to have accelerated this global shift of economic and financial power to the emerging economies. By 2050 the E7’s banking assets are projected to be approximately 50% greater than those in the G7. Figure 7: Projections of domestic banking assets in the E7 and G7 350,000 300,000 Domestic credit ($bn 2009 prices) 250,000 200,000 150,000 100,000 50,000 0 2009 2014 2019 2024 2029 2034 2039 2044 2049 n G7 n E7 n World Source: PwC analysis, IMF Banking in 2050, May 2011 15
  • 16.
    It’s worth notingthat the changes in Figure 8: Projected ratio of domestic banking assets to GDP relative E7/G7 banking assets are not exactly the same as the relative change projected in E7/G7 GDP. The reason 160 for this in our model is that the ratio of domestic banking assets to GDP also Domestic banking assets as % of GDP 140 evolves over time in different ways for the 120 E7 and G7, as illustrated in Figure 8. The average ratio in the G7 remains relatively 100 stable over the projection period. In the emerging economies the ratio rises fairly 80 quickly initially, but then converges more slowly on the world average towards the 60 end of the projection period. This is the 40 result of these economies maturing into developed economies with slower 20 trend growth rates by the end of the projection period. 0 2009 2014 2019 2024 2029 2034 2039 2044 2049 We also looked at projected changes in levels of domestic banking assets at a n G7 average n E7 average n World average country level. In Figure 9 we plot the changes in domestic assets over the Source: PwC analysis using IMF base year data for 2009 projection period for the US, China, India and Japan. The key results here are that China could overtake the US in 2023, and India could overtake Japan in 2033. In our previous analysis published in June Figure 9: Domestic banking assets for the US, China, India and Japan 2007, China was projected to overtake the US in 2043, and India to overtake Japan in 2041. Although the exact 80,000 transition dates are open to considerable 70,000 uncertainty, it seems likely that China will Domestic credit ($bn 2009 prices) have the largest domestic banking assets 60,000 in the world at some point within the next 20-30 years and that India will move 50,000 clearly into third place by 2050. 40,000 30,000 20,000 10,000 0 2009 2014 2019 2024 2029 2034 2039 2044 2049 n US n China n India n Japan Source: PwC analysis using IMF base year data for 2009 16 Banking in 2050, May 2011
  • 17.
    Figure 10 showsthe projected trends for Table 3: Comparison of previous results with updated results: banking assets in Japan, Germany, UK, overtaking years for E7 vs G7 economies Brazil and Russia. The key point here is that Brazil’s domestic banking assets Overtaking year Overtaking year are expected to grow relatively fast over Country pairs (2011 analysis) (2007 analysis) the projection period, resulting in it overtaking both Germany and the UK E7 overtakes G7 2036 2046 by around 2045. Russia is projected to China overtakes US 2023 2043 have strong growth, but not fast enough to overtake the UK, Germany or Japan India overtakes Japan 2033 2041 within this period. Brazil overtakes UK 2045 - In Table 3 we summarise some of the Russia overtakes Italy 2039 2047 key overtaking dates mentioned above, and compare them with the results from Mexico overtakes Italy 2048 2038 our 2007 projections. The main point Turkey overtakes Canada 2045 - to note is that the analysis suggests that emerging economies will overtake the Source: PwC model projections (where no date is shown this indicates overtaking dates beyond 2050) developed economies earlier than we had anticipated before the financial crisis. The exception to this trend is transition for Mexico and Italy; we project that it is going to take longer for this to take Figure 10: Domestic banking assets for Japan, UK, Germany, Brazil place than our 2007 projection had and Russia suggested. We expect that this is due to Mexico’s domestic banking assets not 14,000 having grown as fast as other developing countries since our last report. 12,000 Domestic credit ($bn 2009 prices) Projected changes in the shares of the world’s domestic banking assets are 10,000 shown in Figure 11. Our analysis suggests 8,000 that China and India could have a combined share of around 35% of global 6,000 banking assets by 2050. Other somewhat smaller emerging economies such as 4,000 Brazil and Russia will also see their shares rise significantly. The US, Japan and 2,000 Western Europe are all projected to see large falls in their share of global banking 0 assets in the coming decades. 2009 2014 2019 2024 2029 2034 2039 2044 2049 n Japan n UK n Germany n Brazil n Russia Source: PwC analysis using IMF base year data for 2009 Banking in 2050, May 2011 17
  • 18.
    We present indeclining size order the Figure 11: Share of total global banking assets current and projected future values in 2030 and 2050 of domestic banking assets for each of the countries we Nigeria 1.1% analysed in Table 4. We see that in 0.1% 1.4% 2050 China is projected to have clearly Vietnam 0.2% the highest banking assets, with India 0.9% S. Africa 0.4% and Brazil moving up to acquire top 5 Argentina 0.7% 0.1% positions from the UK and Germany. S. Arabia 1.0% Mexico and Indonesia make large moves 0.4% 1.7% up the rankings over time, while Australia Turkey 0.5% and Canada fall back. The newly 1.6% Indonesia 0.3% emerging economies tend to occupy the Mexico 0.4% 1.9% lower rankings but with relatively fast 1.3% growth rates over time, particularly for Republic of Korea 1.4% 1.2% Vietnam and Nigeria (although these Australia 1.9% are heavily dependent on continuing to 1.5% Canada 2.4% pursue broadly growth-friendly policies Spain 1.6% 4.8% as discussed in Section 3). 1.8% Italy 4.8% France 2.5% 5.0% What factors are Germany 2.7% 6.5% responsible for the 1.1% UK 3.4% 7.3% speeding up of change? Brazil 1.5% The main reason why the shift of 2.2% Russia 0.6% global banking power to the emerging 3.8% Japan 11.0% economies is now projected to be faster India 12.2% than in our 2007 report is due to the 1.4% 22.9% short and long-term effects of the global China 8.8% financial crisis. 14.8% US 21.7% • In the short-term, most developed 0.0 5.0 10.0 15.0 20.0 25.0 economies experienced a significant economic slowdown or recession in n 2050 share n 2009 share 2008-9, reducing significantly the growth of domestic banking assets. Source: IMF data for 2009, PwC model projections for 2050 • Emerging economies by contrast tended to maintain relatively high growth rates, although some temporary economic slowdown was experienced in certain cases. In 2010, however, emerging economies grew strongly in general, while the recovery in Europe in particular remained relatively weak. 18 Banking in 2050, May 2011
  • 19.
    Table 4 Globalleader board of domestic banking assets in 2009, 2030 and 2050 Country Domestic Country Domestic assets Country Domestic rankings assets 2009 rankings 2030 (US$ bn, rankings assets 2050 in 2009 (US$ bn, in 2030 constant in 2050 (US$ bn, constant 2009 prices) constant 2009 prices) 2009 prices) 1. US 14,772 1. China 31,018 1. China 72,228 2. Japan 7,486 2. US 26,841 2. US 46,544 3. China 6,006 3. Japan 9,774 3. India 38,484 4. UK 4,989 4. India 7,848 4. Japan 11,959 5. Germany 4,416 5. UK 6,082 5. Brazil 10,624 6. France 3,401 6. Germany 6,047 6. UK 9,112 7. Spain 3,271 7. France 5,136 7. Germany 8,477 8. Italy 2,993 8. Italy 4,053 8. France 7,909 9. Canada 1,618 9. Brazil 3,799 9. Russia 6,811 10. Australia 1,324 10. Spain 3,756 10. Mexico 5,965 11. Brazil 1,019 11. Russia 2,922 11. Italy 5,601 12. India 945 12. Canada 2,810 12. Turkey 5,502 13. Republic of Korea 935 13. Republic of Korea 2,515 13. Indonesia 5,129 14. Russia 413 14. Australia 2,286 14. Spain 4,992 15. Turkey 352 15. Mexico 1,804 15. Canada 4,761 16. South Africa 250 16. Turkey 1,738 16. Vietnam 4,426 17. Saudi Arabia 244 17. Indonesia 1,394 17. Republic of Korea 4,191 18. Mexico 241 18. Saudi Arabia 1,088 18. Australia 3,812 19. Indonesia 187 19. Vietnam 933 19. Nigeria 3,514 20. Vietnam 113 20. South Africa 843 20. Saudi Arabia 3,303 21. Argentina 86 21. Argentina 637 21. South Africa 2,722 22. Nigeria 47 22. Nigeria 524 22. Argentina 2,205 Source: IMF for 2009, PwC model projections for 2030 and 2050 (note the rankings relate only to these 22 countries; we would not rule out other developed countries featuring in the rankings for some time periods although these are likely to lose ground to the emerging economies over time). Banking in 2050, May 2011 19
  • 20.
    • Developed economies’financial Figure 12: Average annual real growth rates of domestic banking systems came under severe stress assets 2010-2050 (% pa in US $ terms) due to the crisis. The value of assets declined sharply and some financial institutions faced potential bankruptcy and had to be bailed out Spain by governments. Emerging economies by contrast were relatively shielded Japan from these effects, leaving their UK banking systems in much better shape Italy to fund long-term economic growth. Germany • The financial crisis therefore led to a general downward revision for the France estimates of sustainable trend growth Australia across many developed economies, Canada but little change in long-term trend growth projections for the major US emerging economies (or even Republic of Korea upgrades due to the crisis revealing their greater resilience relative to Brazil earlier crises that often tended to S. Africa focus on emerging economies such as Latin America in the 1980s and early China 1990s or Asia in the late 1990s). S. Arabia Turkey Banking growth Russia differentials between Mexico emerging and Argentina developed economies Indonesia The strong growth in emerging Vietnam economies’ domestic banking assets can India be seen in Figure 12 where we plot the compound annual growth rate of the Nigeria different economies domestic banking assets. Here we note that the emerging 0 2 4 6 8 10 12 and developed economies can be divided into two groups: the developed Source: PwC model projections economies appear to have low growth (e.g. from US upwards in the chart), whereas emerging economies tend to have high growth rates, with Republic of Korea as an intermediate case as with our long-term GDP projections. 20 Banking in 2050, May 2011
  • 21.
    In our modelthe level of the quantity Figure 13: Net interest margin by country (2008) of banking assets is determined by both the overall size of the economy and the rate of growth in GDP per capita, which is assumed to translate into a rise Spain Average NIMs by country group in the ratio of banking assets to GDP UK G7 weighted average = 2.6% as economic development proceeds. Japan E7 weighted average = 4.1% Stronger rates of growth in both of these All, weighted average = 2.8% variables push up emerging economy Australia banking assets in our model. Nigeria, Canada India, Vietnam, China and Indonesia have the highest rates of growth in Vietnam GDP and GDP per capita in our sample India and this translates to strong growth in banking assets as well, albeit subject to France many uncertainties as discussed above Germany and dependent on continuing to pursue China broadly growth-friendly policies in these countries. Italy As described in Section 3, this growth Republic of Korea is generally driven by improvements S. Arabia in physical and human capital in US emerging economies and catching up with technology levels in developed Mexico economies. We also expect the real Nigeria market exchange rate of all the emerging economies to appreciate over time to Turkey come in line with purchasing power Indonesia parity estimates. This increases banking assets measured in $ terms in all these Russia emerging markets. Population growth S. Africa also contributes positively to growth in Argentina India, Vietnam, Indonesia and Nigeria. There is a much lower contribution from Brazil population growth in China as a result of its ageing population and its one 0 2 4 6 8 10 12 14 16 child policy. Source: Fitch Banking in 2050, May 2011 21
  • 22.
    increased financial sophisticationand the Figure 14: Illustrative banking profits pool projections for the E7 realisation of scale economies. and G7 based on net interest margins on assets (at constant 2009 US $) Some emerging economies such as China, India and Vietnam tend to have relatively low NIMs. We expect that this is a result of the relatively high levels of lending to state companies. Such activity is likely to result in reduced banking E7 profits as capital is often allocated to achieve political objectives rather than necessarily pursuing the most profitable opportunities (as would otherwise occur in a free market). Over time, however, lending to the private sector is becoming more important in these economies and G7 profitability levels should tend to increase over time. Finally we note that most developed 0 500 1000 1500 2000 2500 3000 3500 4000 4500 5000 economies tend to have lower NIMs, whereas emerging economies exhibit a Net interest income on domestic assets (constant 2009 $bn) broad range. However, almost all of the n 2010 n 2030 n 2050 higher value NIMs belong to the emerging economies. The US is interesting in that Source: PwC analysis drawing on base year data from Fitch and the IMF it has the highest NIM for the developed economies, which could be a reflection of its many regional banks. Projecting our NIM measures to 2050 we can investigate how profitable banking Banking profits them so that they converge to a weighted sectors could be by 2050 (Figure 14). The average9 of NIMs over 2004-200810 by key point from this graph is that the E7 projections 2030. We use the 2008 values so as to sees a large increase in its share of global Based on our projections for banking start from a position that reflects the banking profits in relation to the G7 assets in each economy we can estimate current economic situation as accurately over time. The E7’s profit pool is around the potential profits of the banking sector as we can. We use a weighted average for 50% larger than that of the G7’s by 2050 associated with these assets. We have the convergence value of the NIM based having already not been far behind in used data from Fitch on the net interest on 2004-08 data rather than 2008 data 2030. In our last report we expected margin (NIM) for banks in the different alone because this provides a more robust this E7 vs G7 difference in 2050 to be economies as a measure of profitability. basis for the long-term projections due to around 25% (based on profits analysis We have used net interest margin as an potential short-term distortions to NIM derived from RoA), but the short and indicator because we expect it to be less levels in 2008 from the financial crisis. long term effects of the financial crisis has volatile in times of economic stress than intensified this trend. From Figure 13 we can see that Brazil has return on assets (RoA), which we used a particularly high NIM, making it a clear in our 2007 Banking in 2050 report. outlier from the rest of the countries. NIM is also a more direct measure of the There are a number of reasons why this income from banking assets, which we may be the case: for example, Brazil can then relate to the long-term changes has many banks still operating at low in the economy. Alternative measures of economies of scale, keeping costs high; profitability such as RoA tend to include a large portion of lending is directed to other sources of income such as fees, households limiting the opportunities which we cannot always relate directly to for wholesale financing, and Brazil the ownership of bank assets. has been subject to episodes of high In Figure 13 we present estimated average inflation in the past. In our convergence NIMs for our 22 countries in 2008. In our scenario we expect that, as Brazil analysis we use these values as a proxy for develops, its banks will see lower NIMs the 2009 values and then linearly project as a result of increasing competition, 9 We use the country’s domestic assets in 2009 as the weights in the weighted average calculation. 22 Banking in 2050, May 2011 10 Our weighted average of NIMs includes the NIM for Brazil.
  • 23.
    6. Conclusion and key questions The conclusion from our How are banking analysis is that shifts from systems going to adapt? the G7 to the E7 in the How will banking and financial systems global shares of domestic in emerging and developing economies banking assets and related evolve in response to the rising profits are accelerating significance of emerging economies? For instance where will all the new capital following the financial to underpin these additional banking crisis. However, our analysis assets come from? Will it come from also raises questions as domestic sources or will we see increased to how the global banking levels of international capital flows? industry will evolve over the As the emerging economies develop they next few decades. To address will require increasingly sophisticated financial services and banks are likely to all of these issues would expand to meet this need and reap the take us beyond the scope of benefits of greater economies of scale as this report. In this section, a result. This then throws up questions about the strategic options and scenarios however, we outline some that banks in emerging and developed key questions arising as a economies should be looking at, as well as stimulus for future debate. how policy-makers should respond to this challenge. For example: • Will we see increasing consolidation in markets that take smaller shares of the global pot (e.g. Europe)? Banking in 2050, May 2011 23
  • 24.
    • Will wesee overseas expansion of emerging economies that had in the their business models in the post-crisis banks from the emerging economies past experienced severe financial/ environment. Such large changes (e.g. following the earlier approach economic crises (e.g. Mexico, require a comprehensive look from all of some universal US and UK banks in Argentina and Indonesia) had long angles of a bank’s business from how global markets), or will they tend to recovery periods in excess of 5 years, it supports its people and operations focus their operations mostly within as shown in the decline of their through to its governance, legal and their own home economies or as a domestic banking asset to GDP ratios tax structures. support to the overseas trading of for many years after these crises. We domestic companies (e.g. as also saw particularly high levels of has tended to be the case for the domestic assets relative to GDP in Other socio-economic Japanese banks). Spain and the UK. The lesson from issues history may be that it will take a long • Will economies develop market or Over the projection period we can expect time for these countries to deleverage bank oriented financial systems? to face substantial socio-economic following the crisis and return their Could we, for example, come to challenges that may affect the type of economies and banks to a healthy see more financial intermediation borrowing and lending required. Issues position (the problems of Japan since through banks, or will we see greater such as ageing societies, increasing the early 1990s is another example disintermediation? How will this demand for natural resources, the effects here of how long such adjustment can affect incumbent banks in these of climate change and the move to a low take after a banking crisis, although markets and potential entrants? carbon economy will all pose challenges that was an extreme case). to the banking industry but also create • How can established banks from • Changes in regulation since the potentially significant new business emerging economies tap into the financial crisis will play a profound opportunities. markets where expected profits role in the development of the are highest? Will policy-makers in In ageing societies, for instance, we might banking industry going forward. emerging economies open up their expect to see changes in the balance For instance, increased capital markets to foreign competition? between consumption and saving. How requirements from the Basel III will increasing dependency ratios in In our reports “The Day After regulations and associated national economies with ageing populations affect Tomorrow”11, and “The Future of changes, which are designed to the demand for credit and saving? As Banking”12 we reviewed some of these increase the level of buffers in the increasing proportions of the population issues, focussing on the key questions financial system, could see decreased draw down their wealth for consumption that will shape the strategies of banks profitability of banks. However, the in retirement, where will this money as they recover from the financial crisis. rules are not complete and the full be spent? How will banks manage With significant changes in the banking impact of these regulations will take this transition and how will it affect landscape already in progress, it will years to understand. Despite this, their profitability in the sector? In our recent be important for banks to adapt their effects are likely to be felt, at least in publication “The New Rule of 10%” we strategies accordingly. part, almost immediately as regulators examined the likely drivers and possible and market counterparties hold banks What effects from the financial crisis will impacts on financial institutions in the US to the new requirements. In addition, have long lasting effects? from changes in the saving rate. In this it is likely that further banking and report we identified the need for financial Economic volatility from the financial financial sector regulations and or institutions to re-examine their strategies; crisis still remains, with high levels of amendments to existing regulations whether it be changing business models, leverage still in place in many developed will be implemented at national and/ development of wealth management economies. This poses important or international level. Therefore the services, or becoming less reliant on questions as to how the global banking regulatory outlook and its impact consumer lending and transactions industry will change in the longer remain very uncertain for the revenue.14 term as a result of the financial crisis. banking sector. For example: While we expect these socio-economic • Such significant changes in the developments and issues to determine • How long will it take for the major banking industry will affect the way the range of financial services in developed economies to recover that banks operate, and how they different economies, however, they do fully from the crisis? With many structure themselves to deliver their not affect the broad conclusion of a shift economies still bearing high levels services. We focussed on this in our in economic power from the developed of debt, how long will it be before recent publication “Operating in the to the emerging economies that is the they return to more sustainable Future”13, where we reported on the central theme of this report. levels? We saw in Section 4 that some challenges facing banks in reforming 11 “The Day After Tomorrow”, http://www.pwc.co.uk/eng/publications/the_day_after_tomorrow_pwc_perspective_on_ the_global_financial_crisis.html 12 “The Future of Banking”, http://www.pwc.co.uk/eng/publications/the_future_of_banking_july_2009.html 13 “Operating in the Future: Is your operating vision clearly defined?”, http://www.pwc.co.uk/eng/publications/ operating_in_the_future.html 14 “The New Rule of 10%”, http://www.pwc.com/us/en/financial-services/publications/viewpoints/viewpoint-US- 24 Banking in 2050, May 2011 savings-rate.jhtml
  • 25.
    Annex: Methodology and data Long-term economic The assumptions used in this model reflect a broad range of research by bodies growth model such as the IMF and the World Bank, as The model used to project long-term well as leading academic economists. economic growth in this paper is While any such assumptions are subject described in detail in our earlier series to many uncertainties, we believe that the of “The World in 2050” reports. baseline economic growth scenario used The model is a standard one in the in this paper is plausible. academic research literature in which economic growth is driven by four main factors feeding into an aggregate Exchange rate production function: projections • Technological progress, including Purchasing power parity (PPP) exchange ‘catch-up’ effects for emerging rates are assumed to remain constant economies that vary according to over time in real terms, while market their state of institutional exchange rates converge gradually over development and stability; time to these levels in the very long- term (due to faster productivity growth • Demographic change, in particular in the emerging economies relative to the growth rate of working age the developed economies). This means population; that the relative value of E7 and other • Investment, in plant, machinery, emerging banking markets in dollar terms buildings and other physical assets, tends to rise in the long run due both to which contribute to the long-term faster economic growth in these countries growth of the capital stock in the and to projected real exchange rate economy; and appreciation. • Trends in education levels, which are critical to the quality of the labour force and their ability to make the most of new technologies. Banking in 2050, May 2011 25
  • 26.
    Banking assets data results than more sophisticated panel A maximum limit of domestic credit of data analysis, which suffered from 250% of GDP was imposed in our model and projections some econometric problems due to reflecting our assumptions on the upper For banking assets, we used data on autocorrelation of residuals. After some limit to a sustainable level of debt in an total domestic credit (to households, experimentation, a log-linear relationship economy. Under ordinary conditions we companies and government) since this between domestic credit to GDP ratios would expect debt levels to remain lower seemed most likely to be related to GDP. and GDP per capita levels in PPP terms than 200% based on the experience in For consistency, all such data were taken provided the preferred basis for our Switzerland (where the ratio appears to from the latest online version of the projections model. We found a highly have topped out at around 180% over the IMF’s International Financial Statistics statistically significant (at the 99% level) past decade) and analysis of minimum database. positive relationship between these plausible interest cover ratios based on two variables. As the most recent data US and UK data. However, recent data Using the results from our 2007 analysis, points available in 2008-9 are subject to in the UK and Spain show domestic we see a clear and statistically significant distortion due to the financial crisis, we banking asset to GDP ratios in excess positive relationship between GDP per used the original relationship between of 200%. Therefore we have raised our capita growth and the average annual the growth in the ratio of domestic credit maximum ratio limit, but imposed higher rise in the domestic credit to GDP ratio. to GDP and GDP per capita growth in convergence rates on these two countries In other words, the faster an economy earlier years to ensure that the long-term to reflect our view that their overall level develops, the faster its banking sector projections were not reflecting mid-crisis of assets will fall to more sustainable grows relative to the economy as a whole. conditions. levels in the long run as described above. This relationship is measured using Given our projections for GDP per capita IMF data over several decades in most cases, which gives some reassurance in PPP terms, we were therefore able to Banking profits data project forward a ‘target’ domestic credit in projecting forward a broadly similar to GDP ratio for each country, with the and projections relationship in the long-term. In practice, exception of the US, where we used a Our data on banking profits were sourced of course, this will not be a smooth country-specific time series trend. For from Fitch and covered the leading banks process: there will be economic and credit the other countries, we then assumed in in each of the countries included in our cycles of varying length and severity our baseline scenario that their actual model. We used net interest margin in all countries that we cannot hope domestic credit to GDP ratios converged (NIM) as a measure of profits, instead of to predict with any accuracy. We can, gradually to their target ratios, with 2% of return on assets (RoA), which we used in however, look through these short-to- the difference being eliminated each year our 2007 analysis. The rationale for this medium-term cycles to identify plausible on this convergence path. For China, we is that net interest margin is likely to be scenarios for the long-term underlying assumed a somewhat higher convergence a less volatile measure of banking profits trend in banking sector assets by country, ratio of 3%, since there is evidence from than return on assets and therefore is a and here we are more confident about the past couple of years that the ratio better starting point for setting long-term making broad projections based on the is likely to decline more rapidly in the projections. underlying trends seen in the historic short-term due to past problems with data. This is particularly true when non-performing loans being corrected, We assumed a scenario of linear looking at portfolios of countries such as although the ratio should then rise again convergence from the net interest margin the E7, within which individual country in the longer term as the retail lending ratios shown in Figure 13 to a global variations in the long-term health of the market in particular grows rapidly. We weighted average net interest of 3.1% banking sector should tend to cancel out also assumed higher convergence rates from 2030 onwards. This can be taken over time. for the UK, Spain and Australia of 4.5%, to reflect the impact of cross-border 4.5% and 3% respectively. The rationale competition and M&A in normalising In our 2007 analysis, we carried out a for this is that in the past few years these profits across the banking sectors of the variety of statistical analyses of trends countries have seen sharp increases in major world economies. in the banking assets to GDP ratio over time and across countries, using GDP the levels of domestic assets relative to This net interest margin scenario was per capita levels as the key explanatory GDP that we expect to fall back over the then combined with our GDP growth and variable. For the purposes of providing course of the projection period to more domestic credit to GDP ratio scenarios to a basis for future projections, we found sustainable levels in the long-term. produce banking profits pools projections that simple cross-sectional relationships in the G7 and the E7 economies, as tended to produce more plausible summarised in Figure 14 in the main text. 26 Banking in 2050, May 2011
  • 27.
    Contacts The authors ofthis report are John Hawksworth, Head of Macroeconomics, PwC (UK) and Douglas Niven of the PwC (UK) Economics Practice, who also made an important contribution to the economic research underlying this report. The main editor of the report is Nick Page, Partner, Transaction Services, Financial Services PwC (UK). The PwC economics practice offers a wide range of services, covering competition and regulation issues, litigation support, bids and business cases, public policy and project appraisals, financial economics,the economics of sustainability and macroeconomics. For more details of these services, please visit our website: www.pwc.com/uk/economics If you would like to discuss the issues raised in this report in more detail, please contact your usual PwC contact or anyone of those listed. Authors PwC Global Financial David Law PwC UK John Hawksworth Services Leadership +44 131 524 2379 Chief Economist PwC UK Team david.law@uk.pwc.com +44 20 7213 1650 Nigel Vooght David Newton john.c.hawksworth@uk.pwc.com Global Financial Services Leader PwC UK Douglas Niven PwC UK +44 20 7804 2039 PwC UK +44 20 7213 3960 david.newton@uk.pwc.com +44 20 7804 2775 nigel.j.vooght@uk.pwc.com douglas.r.niven@uk.pwc.com Dominic Nixon Barry Benjamin PwC Singapore PwC US +65 6236 3188 Editor +1 410 659 3400 dominic.nixon@sg.pwc.com Nick Page barry.p.benjamin@us.pwc.com PwC UK Phil Rivett +44 20 7213 1442 Antony Eldridge Global Financial Services Chairman nick.r.page@uk.pwc.com PwC UK PwC UK +44 20 7804 2614 +44 20 7212 4686 antony.eldridge@uk.pwc.com phil.g.rivett@uk.pwc.com James Flanagan Robert Sullivan PwC US PwC US +1 646 471 5220 +1 646 471 8388 james.f.flanagan@us.pwc.com robert.p.sullivan@us.pwc.com Craig Hamer Jon Terry PwC UK PwC UK +44 20 721 24990 +44 207 212 4370 craig.x.hamer@uk.pwc.com jon.p.terry@uk.pwc.com This publication has been prepared for general guidance on matters of interest only, and does not constitute professional advice. You should not act upon the information contained in this publication without obtaining specific professional advice. No representation or warranty (express or implied) is given as to the accuracy or completeness of the information contained in this publication, and, to the extent permitted by law, PricewaterhouseCoopers does not accept or assume any liability, responsibility or duty of care for any consequences of you or anyone else acting, or refraining to act, in reliance on the information contained in this publication or for any decision based on it. For more information about this report contact Áine Bryn, Global FS Marketing, PwC UK, on +44 207 212 8839 or at aine.bryn@uk.pwc.com. For additional copies contact Maya Bhatti, Global FS Marketing, PwC UK, on +44 207 213 2302 or at maya.bhatti@uk.pwc.com
  • 28.
    www.pwc.com/financialservices © 2011 PwC.All rights reserved. Not for further distribution without the permission of PwC. “PwC” refers to the network of member firms of PricewaterhouseCoopers International Limited (PwCIL), or, as the context requires, individual member firms of the PwC network. Each member firm is a separate legal entity and does not act as agent of PwCIL or any other member firm. PwCIL does not provide any services to clients. PwCIL is not responsible or liable for the acts or omissions of any of its member firms nor can it control the exercise of their professional judgment or bind them in any way. No member firm is responsible or liable for the acts or omissions of any other member firm nor can it control the exercise of another member firm’s professional judgment or bind another member firm or PwCIL in any way.