Balance sheet of asian paints
- 1. Balance Sheet of Asian Paints ------------------- in Rs. Cr. -------------------
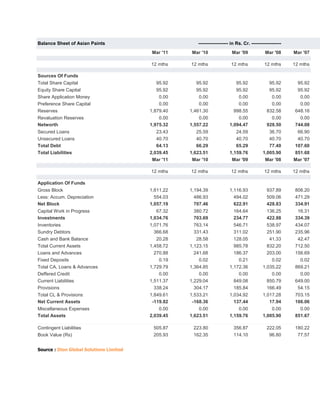
Mar '11 Mar '10 Mar '09 Mar '08 Mar '07
12 mths 12 mths 12 mths 12 mths 12 mths
Sources Of Funds
Total Share Capital 95.92 95.92 95.92 95.92 95.92
Equity Share Capital 95.92 95.92 95.92 95.92 95.92
Share Application Money 0.00 0.00 0.00 0.00 0.00
Preference Share Capital 0.00 0.00 0.00 0.00 0.00
Reserves 1,879.40 1,461.30 998.55 832.58 648.16
Revaluation Reserves 0.00 0.00 0.00 0.00 0.00
Networth 1,975.32 1,557.22 1,094.47 928.50 744.08
Secured Loans 23.43 25.59 24.59 36.70 66.90
Unsecured Loans 40.70 40.70 40.70 40.70 40.70
Total Debt 64.13 66.29 65.29 77.40 107.60
Total Liabilities 2,039.45 1,623.51 1,159.76 1,005.90 851.68
Mar '11 Mar '10 Mar '09 Mar '08 Mar '07
12 mths 12 mths 12 mths 12 mths 12 mths
Application Of Funds
Gross Block 1,611.22 1,194.39 1,116.93 937.89 806.20
Less: Accum. Depreciation 554.03 486.93 494.02 509.06 471.29
Net Block 1,057.19 707.46 622.91 428.83 334.91
Capital Work in Progress 67.32 380.72 164.64 136.25 16.31
Investments 1,034.76 703.69 234.77 422.88 334.39
Inventories 1,071.76 763.14 546.71 538.97 434.07
Sundry Debtors 366.68 331.43 311.02 251.90 235.96
Cash and Bank Balance 20.28 28.58 128.05 41.33 42.47
Total Current Assets 1,458.72 1,123.15 985.78 832.20 712.50
Loans and Advances 270.88 241.68 186.37 203.00 156.69
Fixed Deposits 0.19 0.02 0.21 0.02 0.02
Total CA, Loans & Advances 1,729.79 1,364.85 1,172.36 1,035.22 869.21
Deffered Credit 0.00 0.00 0.00 0.00 0.00
Current Liabilities 1,511.37 1,229.04 849.08 850.79 649.00
Provisions 338.24 304.17 185.84 166.49 54.15
Total CL & Provisions 1,849.61 1,533.21 1,034.92 1,017.28 703.15
Net Current Assets -119.82 -168.36 137.44 17.94 166.06
Miscellaneous Expenses 0.00 0.00 0.00 0.00 0.00
Total Assets 2,039.45 1,623.51 1,159.76 1,005.90 851.67
Contingent Liabilities 505.87 223.80 356.87 222.05 180.22
Book Value (Rs) 205.93 162.35 114.10 96.80 77.57
Source : Dion Global Solutions Limited
- 2. Asian Paints Previous Years »
Consolidated Profit & Loss account ------------------- in Rs. Cr. -------------------
Mar '11 Mar '10 Mar '09 Mar '08 Mar '07
12 mths 12 mths 12 mths 12 mths 12 mths
Income
Sales Turnover 8,671.13 7,393.30 6,301.46 5,123.52 4,316.54
Excise Duty 673.12 449.00 561.81 532.68 477.76
Net Sales 7,998.01 6,944.30 5,739.65 4,590.84 3,838.78
Other Income 79.62 137.03 22.09 51.86 25.80
Stock Adjustments 169.33 124.90 -12.69 37.02 84.23
Total Income 8,246.96 7,206.23 5,749.05 4,679.72 3,948.81
Expenditure
Raw Materials 4,653.93 3,882.47 3,403.19 2,638.09 2,293.86
Power & Fuel Cost 74.56 56.48 54.01 41.23 39.18
Employee Cost 455.88 438.17 372.39 307.53 262.82
Other Manufacturing Expenses 64.16 54.92 44.03 35.24 29.35
Selling and Admin Expenses 1,504.10 1,306.68 1,082.34 866.06 732.36
Miscellaneous Expenses 96.57 92.23 70.67 73.45 79.45
Preoperative Exp Capitalised 0.00 0.00 0.00 0.00 0.00
Total Expenses 6,849.20 5,830.95 5,026.63 3,961.60 3,437.02
Mar '11 Mar '10 Mar '09 Mar '08 Mar '07
12 mths 12 mths 12 mths 12 mths 12 mths
Operating Profit 1,318.14 1,238.25 700.33 666.26 485.99
PBDIT 1,397.76 1,375.28 722.42 718.12 511.79
Interest 25.00 36.75 32.46 26.37 23.99
PBDT 1,372.76 1,338.53 689.96 691.75 487.80
Depreciation 113.13 83.56 74.38 59.17 61.14
Other Written Off 0.00 0.00 0.00 0.00 0.00
Profit Before Tax 1,259.63 1,254.97 615.58 632.58 426.66
Extra-ordinary items 5.37 7.66 6.92 -2.75 7.07
PBT (Post Extra-ord Items) 1,265.00 1,262.63 622.50 629.83 433.73
Tax 383.65 378.72 203.02 201.78 150.24
Reported Net Profit 881.35 883.91 419.48 428.05 283.49
Minority Interest 38.11 48.27 21.64 18.87 2.06
Share Of P/L Of Associates 0.00 0.00 0.00 0.00 0.40
Net P/L After Minority Interest &
837.87 826.83 392.16 418.77 281.72
Share Of Associates
Total Value Addition 2,195.27 1,948.48 1,623.44 1,323.51 1,143.16
Preference Dividend 0.00 0.00 0.00 0.00 0.00
Equity Dividend 306.94 258.98 167.86 163.05 124.69
Corporate Dividend Tax 50.11 43.33 28.88 27.72 18.06
Per share data (annualised)
Shares in issue (lakhs) 959.20 959.20 959.20 959.20 959.20
Earning Per Share (Rs) 91.88 92.15 43.73 44.63 29.55
Equity Dividend (%) 0.00 0.00 0.00 0.00 0.00
- 3. Book Value (Rs) 228.05 178.27 125.44 102.42 81.09
Source : Dion Global Solutions Limited
FINANCIAL RATIOS –
Asian Paints Previous Years »
------------------- in Rs. Cr. -------------------
Mar
Mar '10 Mar '09 Mar '08 Mar '07
'11
Investment Valuation Ratios
Face Value 10.00 10.00 10.00 10.00 10.00
Dividend Per Share -- -- -- -- --
Operating Profit Per Share (Rs) 137.42 129.09 73.01 69.46 50.67
Net Operating Profit Per Share (Rs) 833.82 723.97 598.38 478.61 400.21
Free Reserves Per Share (Rs) 217.15 167.37 114.51 91.62 70.29
Bonus in Equity Capital 97.98 97.98 97.98 97.98 97.98
Profitability Ratios
Operating Profit Margin(%) 16.48 17.83 12.20 14.51 12.66
Profit Before Interest And Tax
14.92 16.49 10.83 13.07 10.97
Margin(%)
Gross Profit Margin(%) 15.06 16.62 10.90 13.22 11.06
Cash Profit Margin(%) 12.18 12.57 8.71 10.57 8.84
Adjusted Cash Margin(%) 12.18 12.57 8.71 10.57 8.84
Net Profit Margin(%) 10.44 11.93 6.88 8.81 7.26
Adjusted Net Profit Margin(%) 10.44 11.93 6.88 8.81 7.26
Return On Capital Employed(%) 52.84 62.58 44.25 53.20 42.72
Return On Net Worth(%) 38.54 48.86 33.06 41.65 36.13
Adjusted Return on Net Worth(%) 39.81 46.58 35.68 43.94 36.14
Return on Assets Excluding
228.05 178.27 125.44 102.42 81.09
Revaluations
Return on Assets Including
228.05 178.27 125.44 102.42 81.09
Revaluations
Return on Long Term Funds(%) 56.87 68.21 52.03 62.83 54.34
Liquidity And Solvency Ratios
Current Ratio 1.07 0.94 1.09 0.97 1.04
Quick Ratio 0.50 0.49 0.74 0.62 0.74
- 4. Debt Equity Ratio 0.11 0.13 0.25 0.26 0.37
Long Term Debt Equity Ratio 0.03 0.04 0.06 0.07 0.08
Debt Coverage Ratios
Interest Cover 57.56 42.57 25.26 31.19 24.08
Total Debt to Owners Fund 0.11 0.13 0.25 0.26 0.37
Financial Charges Coverage Ratio 55.71 35.26 22.77 27.27 21.53
Financial Charges Coverage Ratio
39.25 26.01 15.55 18.76 15.26
Post Tax
Management Efficiency Ratios
Inventory Turnover Ratio 6.96 8.09 8.67 7.37 7.40
Debtors Turnover Ratio 14.18 12.46 11.12 10.42 10.00
Investments Turnover Ratio 6.96 8.09 8.67 7.37 7.40
Fixed Assets Turnover Ratio 4.17 4.82 4.06 3.93 3.72
Total Assets Turnover Ratio 3.15 3.59 3.88 3.80 3.74
Asset Turnover Ratio 4.17 4.82 4.06 3.93 3.72
Average Raw Material Holding 52.75 44.22 42.27 43.33 37.44
Average Finished Goods Held 41.62 37.23 31.26 39.37 41.16
Number of Days In Working Capital 15.57 4.06 29.22 20.12 35.57
Profit & Loss Account Ratios
Material Cost Composition 58.18 55.90 59.29 57.46 59.75
Imported Composition of Raw
-- -- -- -- --
Materials Consumed
Selling Distribution Cost Composition 15.95 15.62 15.70 15.68 15.40
Expenses as Composition of Total
-- -- -- -- --
Sales
Cash Flow Indicator Ratios
Dividend Payout Ratio Net Profit 42.34 36.17 49.45 46.62 50.79
Dividend Payout Ratio Cash Profit 37.33 32.88 41.66 40.73 41.71
Earning Retention Ratio 59.01 62.05 54.18 55.82 49.24
Cash Earning Retention Ratio 63.72 65.66 60.95 61.14 58.30
AdjustedCash Flow Times 0.24 0.26 0.59 0.53 0.84
Source : Dion Global Solutions Limited