Balance sheet
•Download as DOCX, PDF•
0 likes•139 views

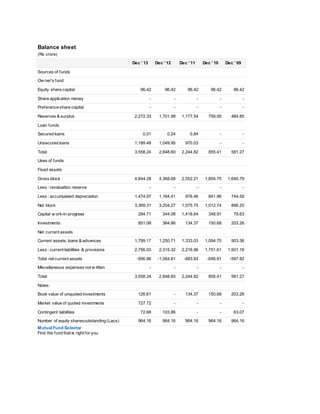
This balance sheet shows the company's financial position over several years from 2009 to 2013. Total assets have increased from Rs. 581 crore in 2009 to Rs. 3,558 crore in 2013, driven primarily by growth in reserves and surplus as well as unsecured loans. Fixed assets net block has increased from Rs. 896 crore to Rs. 3,369 crore over this period while investments have grown from Rs. 203 crore to Rs. 851 crore. Total liabilities have increased from Rs. 581 crore to Rs. 3,558 crore between 2009 and 2013.

Recommended
More Related Content
What's hot
What's hot (13)
Viewers also liked
Similar to Balance sheet
Similar to Balance sheet (20)
Balance sheet
- 1. Balance sheet (Rs crore) Dec ' 13 Dec ' 12 Dec ' 11 Dec ' 10 Dec ' 09 Sources of funds Ow ner's fund Equity share capital 96.42 96.42 96.42 96.42 96.42 Share application money - - - - - Preference share capital - - - - - Reserves & surplus 2,272.33 1,701.99 1,177.54 759.00 484.85 Loan funds Secured loans 0.01 0.24 0.84 - - Unsecured loans 1,189.48 1,049.95 970.03 - - Total 3,558.24 2,848.60 2,244.82 855.41 581.27 Uses of funds Fixed assets Gross block 4,844.28 4,368.68 2,552.21 1,854.70 1,640.79 Less : revaluation reserve - - - - - Less : accumulated depreciation 1,474.97 1,164.41 976.46 841.96 744.59 Net block 3,369.31 3,204.27 1,575.75 1,012.74 896.20 Capital w ork-in-progress 294.71 344.08 1,418.64 348.91 79.63 Investments 851.08 364.86 134.37 150.68 203.26 Net current assets Current assets, loans & advances 1,799.17 1,250.71 1,333.03 1,094.70 903.36 Less : current liabilities & provisions 2,756.03 2,315.32 2,216.96 1,751.61 1,501.18 Total net current assets -956.86 -1,064.61 -883.93 -656.91 -597.82 Miscellaneous expenses not w ritten - - - - - Total 3,558.24 2,848.60 2,244.82 855.41 581.27 Notes: Book value of unquoted investments 126.61 - 134.37 150.68 203.26 Market value of quoted investments 727.72 - - - - Contingent liabilities 72.68 103.86 - - 63.07 Number of equity sharesoutstanding (Lacs) 964.16 964.16 964.16 964.16 964.16 Mutual Fund Selector Find the fund that is right for you
- 2. EQUITY AND LIABILITIES Share Capital 96.42 96.42 0.00% Share Warrants & Outstandings Total Reserves 2,272.33 1,701.99 33.51% Shareholder's Funds 2,368.75 1,798.41 31.71% Long-Term Borrowings 0.00 0.00 0.00% Secured Loans 0.00 0.00 0.00% Unsecured Loans 1,189.48 1,049.95 13.29% Deferred Tax Assets / Liabilities 215.47 162.08 32.94% Other Long Term Liabilities 0.00 0.00 0.00% Long Term Trade Payables 0.00 0.00 0.00% Long Term Provisions 1,193.39 1,014.75 17.60% Total Non-CurrentLiabilities 2,598.34 2,226.78 16.69% Current Liabilities Trade Payables 633.04 539.40 17.36% Other Current Liabilities 500.25 558.03 -10.35% Short Term Borrow ings 0.01 0.24 -95.83% Short Term Provisions 213.88 41.06 420.90% Total Current Liabilities 1,347.18 1,138.73 18.31% Total Liabilities 6,314.27 5,163.92 22.28% ASSETS Non-Current Assets 0.00 0.00 0.00% Gross Block 4,903.16 4,427.56 10.74% Less: Accumulated Depreciation 1,523.91 1,216.44 25.28% Less: Impairment of Assets 9.94 6.85 45.11% Net Block 3,369.31 3,204.27 5.15% Lease Adjustment A/c 0.00 0.00 0.00% Capital Work in Progress 294.71 344.08 -14.35% Intangible assets under development 0.00 0.00 0.00% Pre-operative Expenses pending 0.00 0.00 0.00% Assets in transit 0.00 0.00 0.00%
- 3. Non Current Investments 224.12 0.00 100.00% Long Term Loans & Advances 123.94 125.45 -1.20% Other Non Current Assets 0.47 0.00 100.00% Total Non-CurrentAssets 4,012.55 3,673.80 9.22% Current Assets Loans & Advances Currents Investments 626.96 364.86 71.84% Inventories 735.93 745.58 -1.29% Sundry Debtors 84.27 87.57 -3.77% Cash and Bank 749.36 236.96 216.24% Other Current Assets 10.06 5.18 94.21% Short Term Loans and Advances 95.14 49.97 90.39% Total Current Assets 2,301.72 1,490.12 54.47% Net Current Assets (Including Current Investments) 954.54 351.39 171.65% Total Current Assets Excluding Current Investments 1,674.76 1,125.26 48.83% Miscellaneous Expenses not w ritten off 0.00 0.00 0.00% Total Assets 6,314.27 5,163.92 22.28% Contingent Liabilities 12.76 11.70 9.06% Total Debt 1,189.49 1,050.19 13.26% Book Value (in ₹) 0.00 186.52 -100.00% Adjusted Book Value (in ₹) 245.67 186.52 31.71%