Download to read offline
![Thanks for downloading this sample business
plan from Bplans.com!
Your business is unique. Your business plan should be too.
A sample plan is a great way to get inspired. But, your business is unique and your
business plan should reflect that. If you need your own business plan, you’re still
going to have to put in all your own information and do all your own financial
forecasts.
LivePlan can help. You can easily create a custom business plan that will wow lenders
and investors. It’s like having a business consultant, designer, and accountant by your
side while you write your plan.
A step-by-step process to follow
LivePlan asks you questions about your business, you plug in the answers. It’s as
easy as that. You’ll get straightforward instructions, with examples, for every
essential piece of your business plan.
Financials that are calculated for you
LivePlan tells you exactly what kind of financial information you need to enter
and then does all the calculations automatically using built-in formulas. So you
end up with razor-accurate financial statements that include all the tables that
a lender or investor expects to see.
Impress lenders and investors
“I needed to write a business plan for my investors. [LivePlan] helped me
create a precise plan to confidently share with investors, and I've raised $3
million so far!" - Rachid T., Olive Oil USA, LLC
Start writing your own business plan with LivePlan »](https://image.slidesharecdn.com/bakerybusinessplan-220416064509/95/bakery_business_plan-doc-1-638.jpg)
![CONFIDENTIAL
This logo is ugly. Want a great one designed just for your business?
Click here to learn how to get a professionally designed custom logo.
This sample business plan has been made available to users of Bplans.com, published by
Palo Alto Software. Our sample plans were developed by existing companies and new
business start-ups as research instruments to determine market viability, or funding
availability. Names, locations and numbers may have been changed, and substantial
portions of text may have been omitted to preserve
confidentiality and proprietary information.
You are welcome to use this plan as a starting point to create your own, but you do not
have permission to reproduce, resell, publish, distribute
or even copythis plan as it exists here.
Requests for reprints, academic use, and other dissemination of this sample plan should
be emailed to the marketing department of Palo Alto Software at
marketing@paloalto.com.
Copyright © Palo Alto Software, Inc., 2017 All rights reserved.
Requests for reprints, academic use, and other dissemination of this sample
plan should be emailed to the marketing department of Palo Alto Software at
marketing@paloalto.com.
Copyright Palo Alto Software, Inc., 2007-2009 All rights reserved.
]](https://image.slidesharecdn.com/bakerybusinessplan-220416064509/95/bakery_business_plan-doc-2-638.jpg)


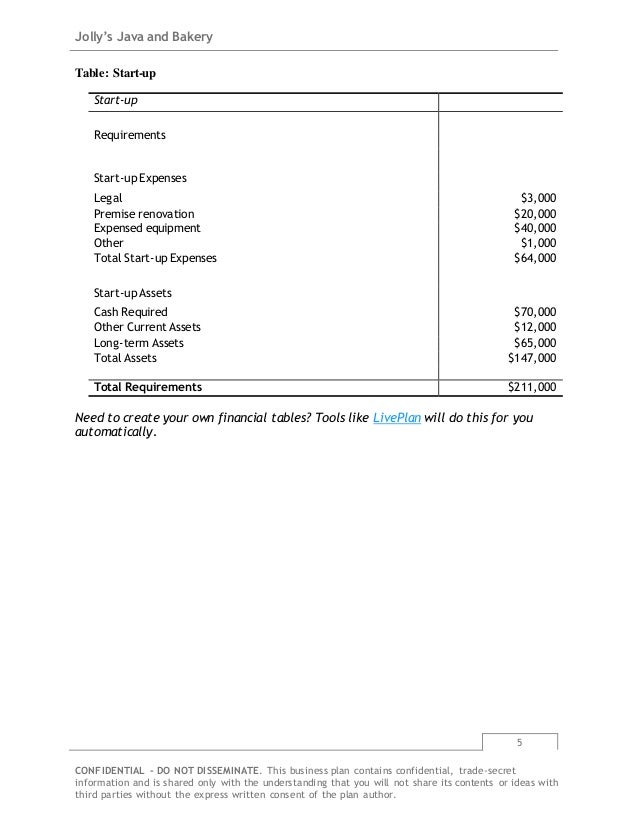


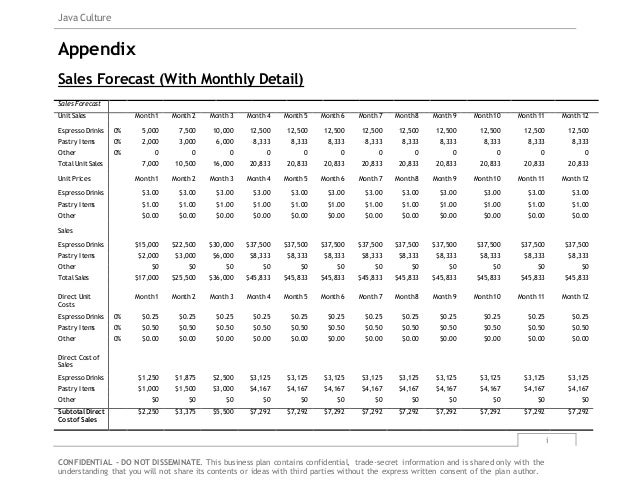


Jolly's Java and Bakery (JJB) is a start-up coffee shop and bakery located in southwest Washington that is equally owned and managed by two partners. JJB plans to offer high-quality coffee, espresso, and bakery products and focus on establishing a loyal local customer base. JJB expects to raise $110,000 in capital from the partners and borrow $100,000 through an SBA loan. In its first three years, JJB anticipates sales of $491,000, $567,000, and $655,000 respectively, and profits of around $13,000, $36,000, and $46,000. JJB aims to provide excellent customer service


