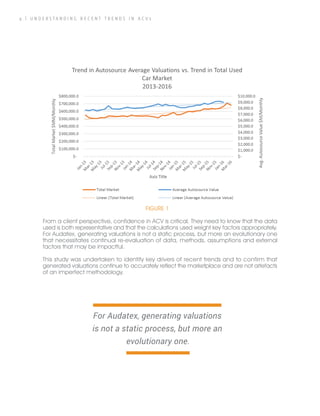
SlideShare a Scribd company logo
U N D E R S T A N D I N G R E C E N T T R E N D S I N A C V s
AUTOSOURCE
MACROECONOMIC
ANALYSIS
Contents
Summary	3
Purpose	3
Research Design	 5
Research Findings	 6
Data Analytics	 6
Literature Research	 8
Interpretaion & Analysis	 9
Conclusion	13
BY COLIN WRIGHT
Audatex is the
world leader in the
development and
implementation of
software and services
for the automobile
and insurance claims
processing industry.
As part of the Solera group
of companies,
we draw on our broad
global claims market
experience to identify and
implement the
best-practice processes
that drive continuous
improvement for our
local customers and their
trading partners.
Autosource
Macroeconomic
Analysis:
Understanding
Recent Trends in
ACVs
Copyright © 2016
Audatex Canada. All rights
reserved.
Audatex, Autosource, and
Audatex Estimating,
are trademarks or
registered trademarks
of Audatex. All other
trademarks used are the
property of their respective
owners.
U N D E R S T A N D I N G R E C E N T T R E N D S I N A C V s | 3
Summary
In terms of perspective, this white paper provides more of a ‘birds-eye’ view rather than
a granular, case-by-case analysis of actual cash value (ACV) estimations. Some useful
insights are made available. Principal among these are that macroeconomic factors
are the key determinants for the supply of, and demand for, used vehicles, and of used
vehicle pricing in aggregate. It is also apparent that Autosource ACV trends are reliable
proxies for used vehicle market price trends. Although not explored in detail, it is clear that
used vehicle markets in Canada and the U.S. are fundamentally alike, but the timing and
scale of any response to marketplace events may be affected by other factors unique
to each country.
Purpose
Many of Canada’s leading insurers rely on used vehicle valuations generated by Autosource,
Audatex Canada’s valuation tool, to help them settle total loss claims. Autosource captures
data from across the Canadian marketplace, finds vehicles that are both geographically
proximate and comparable to the loss vehicle, and then uses a proprietary algorithm built
using literally millions of data points to calculate a valuation amount.
Autosource is a robust, time-tested product. Its outputs are critical to ensuring that the
promise of indemnity, i.e., that the claimant will be restored to the position they were in
prior to their loss, is met, and that the settlement process is equitable for both policyholder
and insurer alike.
Over the past 18-24 months, aggregate analyses suggested that actual cash value
amounts were trending upward (See Figure 1.) during a period when inflation was negligible
and other economic factors such as GDP growth, the price of oil, employment, and the
value of the Canadian dollar were either soft or declining. In an environment where most
indicators suggest that prices should hold steady or perhaps even decline, the trend in
ACV seems counterintuitive.
4 | U N D E R S T A N D I N G R E C E N T T R E N D S I N A C V s
From a client perspective, confidence in ACV is critical. They need to know that the data
used is both representative and that the calculations used weight key factors appropriately.
For Audatex, generating valuations is not a static process, but more an evolutionary one
that necessitates continual re-evaluation of data, methods, assumptions and external
factors that may be impactful.
This study was undertaken to identify key drivers of recent trends and to confirm that
generated valuations continue to accurately reflect the marketplace and are not artefacts
of an imperfect methodology.
FIGURE 1
For Audatex, generating valuations
is not a static process, but more an
evolutionary one.
U N D E R S T A N D I N G R E C E N T T R E N D S I N A C V s | 5
Research Design
The research design for this study comprises two components: a statistical analysis of 2015
ACV data; and a literature search focused primarily on reports generated by government
agencies and commercial market research firms.
Autosource data were extracted for 20151
and various data mining techniques were applied,
including a cluster analysis, the construction of a linear regression model, a correlation
analysis of expected vs. observed outcomes, and profiling of the identified clusters.
The dataset included latest ACV values aggregated by month, province, region of origin,
make, and vehicle category as well as vehicle age and mileage. Only data from typical
instant, i.e., system-generated, valuations were included. A linear regression model built
off the dataset also incorporated additional variables such as the value of the Canadian
dollar over time. Part of the dataset from the first half of the year was used to “train” or
fine tune the model while the remainder was reserved to test its predictive ability against
observed results.
Valuable insights were gained from a variety of sources accessed during the literature
search conducted for the study. Because vehicle markets develop over multi-year, or even
longer, timescales the search was not limited to only the most recent published material
but also included analyses of economic events and trends stretching back for the better
part of the last decade.
Material from government entities such as the Financial Consumer Agency of Canada
and Statistics Canada, as well as from the research arms of major financial institutions such
as Scotiabank, was reviewed. Reports from specialist automotive research companies on
both sides of the border, such as the U.S.-based National Automobile Dealers Association
(NADA) and DesRosiers Automotive Consultants in Canada, were also examined. Business
news reports published by mainstream media outlets such as The Globe & Mail or The
Financial Post provided additional, relevant information.
As a starting point for the research and subsequent analytical activity, it was hypothesized
that ACVs are proxies for used vehicle market prices and that any long-term movement
or identifiable trend in ACVs will mirror real-world events, price movements, and trends in
those markets. As such, the drivers of the used vehicle market will also drive ACVs.
1	 Obtaining current data for the used car market in Canada can be challenging. For
example, there is a two-three-month lag for Statistics Canada price data and seasonal
adjustments are made to prior entries with each new entry. Volume data are not readily
accessible except in year-end summaries. The ability to provide an “up to the minute”
snapshot of the market is, therefore, constrained.
6 | U N D E R S T A N D I N G R E C E N T T R E N D S I N A C V s
A strong correlation
between changes to
ACVs and changes in
$CAD/$USD exchange
rate is a suprising find.
Research Findings
Data Analytics
Through the initial data analysis, fourteen clusters were defined. Each cluster contained
vehicle makes and models that share similar characteristics. A multiple linear regression
model was developed and trained with a subset of the data as planned. The model was
then used to forecast results for the remainder of the dataset. Actual ACVs for the latter
half of the year were then compared with the forecast ACVs, exceeding them by an
average of $674 at year-end.
Two of the fourteen clusters defined were weakly correlated with overall ACV and two
others, clusters 4 and 8, were negatively correlated, meaning that the actual results for
these clusters moved in the opposite direction to what the model predicted. Clusters 4
and 8 accounted for 36% of the valuations in the dataset which suggests that they strongly
influenced the difference between actual and model results.
Examining the composition of these clusters revealed that 50% of the vehicles in Cluster
4 are classified as “Economy-Domestic” while an additional 14% are “Economy-Import”.
In terms of vehicle makes, Cluster 4 contains a disproportionate number of vehicles from
defunct brands; Pontiac, Saturn, and Oldsmobile account for 42%, 11% and 8% of the
cars in the cluster, respectively. These brands are overrepresented in the cluster relative
to their distribution within the dataset overall.
Within Cluster 8, “Economy-Import” at
47%, and “Mid-Foreign” at 27% are the
predominant categories, and Toyota,
Honda, Nissan and Volkswagen are notable
brands (See Figure 2.). At shares of 29%,
13%, 10% and 9%, respectively, these
makes account for nearly two thirds of
the vehicles in the cluster.
FIGURE 2
U N D E R S T A N D I N G R E C E N T T R E N D S I N A C V s | 7
A strong correlation discovered between changes to ACVs and changes in the $CAD/$USD
exchange rate is a somewhat surprising finding. Although the U.S. is Canada’s largest
trading partner, there is no obvious reason that the value of the dollar should correlate
with, or have any influence upon Canadian used vehicle prices as these are domestic
assets being bought and sold in the domestic market with domestic currency.
A separate analysis was conducted comparing ACVs for both cars and light trucks for 2014
through the first quarter of 2016 with the Consumer Price Index (CPI)1
over the same period.
The following charts (Figures 3. & 4.) illustrate a generally positive correlation, particularly
for cars, with overall price inflation in the Canadian economy.
1	 Source for CPI data: www.statcan.gc.ca
FIGURE 3
FIGURE 4
8 | U N D E R S T A N D I N G R E C E N T T R E N D S I N A C V s
Literature Research
The purpose of the literature search was twofold: identify current marketplace trends
and the key macroeconomic factors that drive them; and provide historical context by
reviewing and analyzing recent, relevant economic events.
Notable findings:
Over the 2012-2015 time frame, the total value of used car sales in Canada increased 18%,
while the average price increased 20%1
and total unit volume declined 2%2
(Figure 5).
•	 Following near-record new car sales in 2012, record sales were seen in 2013, 2014
and 2015
•	 There are still approximately ten million cars ten years old or older on Canadian roads
– replacement demand continues to fuel a very active new car market in 2016
•	 Consumer preference has shifted to light trucks and crossovers – sales of subcompact
and compact cars have declined
•	 Low fuel prices plus favourable purchase financing and leasing options contribute to
changing preferences
•	 While the overall value of used cars sold in Canada has risen over the past few years
the number of units sold has declined slightly meaning that average values have
increased
1	 Statistics Canada, CANSIM 080-0020, 2016
2	 DesRosiers Automotive Consultants Inc., 2016
FIGURE 5
U N D E R S T A N D I N G R E C E N T T R E N D S I N A C V s | 9
•	 There is a used car shortage that is putting upward pressure on prices – particularly
within specific categories
•	 Industry-watchers expect the shortage to ease as the effects of multiple factors, e.g.,
changing consumer preferences or changes in financing, impact supply
•	 Used vehicle sales from Canada to the U.S. have soared as the value of the Canadian
dollar has declined
•	 The recession in 2008-09 profoundly impacted auto sales on both sides of the border
•	 Post-recession, new vehicle financing changed significantly1
•	 In 2007 in Canada, leasing had a 42.4% share of new vehicle financing – this collapsed
to a 7.1% share in 2009
•	 Leasing has been rebounding steadily – in 2015, 28.8% of new cars in Canada were
financed with leases
•	 During the recession, some automakers, notably GM Corp. and Chrysler LLC, suspended
leasing altogether while others limited its availability to certain market segments
•	 Chrysler did not offer leasing in Canada from 2008 until 2013, and GM from 2008
until 2011
•	 To maintain affordability, the market shifted to extended-term loans (ETLs) – average
terms have increased by two months annually since 2010 reaching 74 months in 2015
•	 84- and 96-month ETLs are now commonplace
•	 There is increasing concern about an “auto bubble” – ETLs and broader availability of
leasing options contribute to ever-higher levels of consumer debt – the frothy new car
market of recent years could contract sharply under certain scenarios which would
have an impact on used car markets a few years down the road
Interpretaion & Analysis
The results of the data analytics and literature search point in the same direction. Recent
increases in ACVs mirror a rise in average used car prices that is driven by multiple factors.
Principal among these is a shortage in supply that has its roots in the recession of 2008-09.
Off-lease vehicles are an important source of supply to the used car market. Lease financing
terms are typically 36-60 months in length meaning that many late-model used cars are
lease returns. The cessation or sharp curtailing of leasing by major manufacturers during
the recession directly affected used car supply 3-5 years later.
As noted by the Financial Consumer Agency of Canada, consumer purchase decisions
hinge on affordability, or more correctly, on the regular payment amount needed to
finance the vehicle2
. In fact, much vehicle advertising highlights the payment amount
while burying the full retail price and other payment terms in fine print.
1	 For the purposes of this document, loans, leases and cash are all considered as
different forms of purchase financing.
2	 Auto Finance: Market Trends, Financial Consumer Agency of Canada, March 2016
1 0 | U N D E R S T A N D I N G R E C E N T T R E N D S I N A C V s
In order to continue to provide car shoppers with attractive, “affordable” financing options
in the absence of leasing programs, manufacturers turned to extended term loans, low
interest rates and more frequent payments. Previously, typical car loans had 36-48 month
terms paid monthly. Post-recession, ETLs became the norm with terms of 60, 72, 84, and,
more recently, 96 months. In addition, bi-weekly, or even weekly repayment schedules
have become commonplace. Advertising focused on the payment amount and the low,
or even 0% interest rates being offered.
Consumer choice has also been affected by ETL financing. Purchasers who focus on the
regular payment rather than on the total cost of financing have a tendency to buy up
and purchase “more car”, or possibly a different type of vehicle such as a crossover or
compact SUV (Figure 6).
The increasing prevalence of ETLs has played a part in shifting consumer preference
away from conventional passenger cars toward light trucks. In an expanding market over
the period 2011–2015 where the total number of units sold has risen from 1,585,519 to
1,898,485, the passenger car share of market has slipped from 43.8% to 37.7% while the
light truck share of market has grown from 56.2% to 62.3%1
.
Many consumers find themselves in a negative equity position because of ETLs – they
owe more than their car is worth for much of the loan term – the average amount of ETL
negative equity is -$6,7002
. For some car owners, being in a negative equity position is
a disincentive to sell or trade their vehicle before they have finished paying for it which
effectively delays the addition of these vehicles to the used vehicle market.
When GM and Chrysler went into bankruptcy protection in 2008 they suspended their
leasing programs. This action would have had the effect of limiting the supply of vehicles
from these manufacturers to the used vehicle marketplace in the short- to medium-term, as
purchasers would have been forced to migrate to longer-term ETLs for affordable financing.
The recession also impacted new vehicle sales overall (see Figure 7, below). Total sales
volume for new passenger cars and light trucks collapsed from about 1.69 million units
in 2007 to 1.48 million in 20093
. The market has steadily rebounded since, achieving
successive new records in the past three years.
These changes in sales volume, financing and consumer preference affect the market
1	 DesRosiers Automotive Consultants Inc., 2016
2	 Financial Consumer Agency of Canada, March 2016
3	 Statistics Canada, CANSIM 079-0003, 2016
FIGURE 6
U N D E R S T A N D I N G R E C E N T T R E N D S I N A C V s | 1 1
unevenly, i.e., by region, vehicle type, make and model, but the overall effect post-recession
was a slow erosion of the supply of used vehicles to the Canadian market.
Figure 8., below, maps the changes in finance options against overall unit sales. It shows
that leasing peaked in 2005 and then suffered a 38% drop in share of finance by the
end of 20091
. Unit sales of used vehicles, rose for four years until 2011, after which they
began to decline, suggesting, first, an increase in supply between 2005 and 2011, and
then a subsequent tightening of supply. Three years later, used sales were again on the
rise, fueled by steadily increasing supplies of off-lease vehicles as leasing rebounded
over the intervening years, plus the addition of vehicles purchased post-recession using
conventional financing.
1	 DesRosiers Automotive Consultants Inc., 2016
FIGURE 7
…leasing peaked in 2005
and then suffered a 38%
drop in share of finance by
the end of 2009.
In the broadest terms, the expected response
to a reduction in supply is upward pressure on
pricing. The cluster analysis provides support
for this. As discussed in the Data Analytics
section earlier, cluster 8 accounted for 30%
of the valuations in the dataset. The largest
vehicle categories in the cluster are
“Economy-Import” at 47%, “Mid-Foreign”
at 27%, “Minivans” at 11%, and “Economy-
Domestic” at 8%. On a brand basis, Toyota,
Honda, and Nissan account for 29%, 13%,
and 10% of the vehicles in the clusterwhile
Ford, Dodge and Volkswagen have 9%
each. Notably, Toyota and Volkswagen were
overrepresented in the cluster relative to their
distribution within the dataset overall.
1 2 | U N D E R S T A N D I N G R E C E N T T R E N D S I N A C V s
Cluster 8 ACVs are negatively correlated with model predictions meaning that they are
higher than projected. Taking into account the various factors influencing supply, it is
reasonable to posit that fewer domestic vehicles would have been added to the used
vehicle market as lease returns dried up. This would have a twofold impact on pricing as
the limited supply of domestic vehicles would lend buoyancy to prices for those vehicles
and, in turn, consumers looking for domestics but finding fewer to choose from would look
for substitutes, i.e., similar imported vehicles. The increased demand for a limited supply
of imported, foreign vehicles would put price pressure on those vehicles. A reduction in
supply of one category leads to increased demand for a substitute category and both
categories experience upward price pressure.
Recent changes in the $CAD/$USD exchange rate only served to exacerbate the problem.
As noted previously, the rise in ACVs is also negatively correlated with the decline in the
value of the Canadian dollar versus the US dollar. In 2015, Americans bought 200,000
used vehicles in Canada and exported them to the U.S. - 7% of the total number of used
vehicles sold in Canada1
. The favourable exchange rate makes Canadian used autos very
attractive to U.S. buyers; dealers are reported to be paying asking prices at auction and
shipping truckloads of vehicles south. The impact on the Canadian market is a reduction
in the supply of late model used vehicles contributing to increased retail prices. Exports
from every province climbed in 2015, but Ontario was the dominant supplier suggesting
that impacts might be experienced differently by region2
.
Looking forward, the ongoing resurgence of leasing post-recession bodes well for used car
buyers. Analyses of the U.S. market suggest that as these vehicles start to come off-lease
in 2016-2018 buyers will have greater choice and the increased supply is expected to
exert downward pressure on prices3
. These expectations appear to be coming to fruition.
1	 Auto Remarketing Canada, 2016
2	 Scotiabank, 2015
3	 National Automobile Dealers Association, NADA Used Car Guide, under licence by
J.D. Power and Associates, 2016
FIGURE 8
U N D E R S T A N D I N G R E C E N T T R E N D S I N A C V s | 1 3
The NADA Used Car Guide for August and September report consecutive declines in the
Used Vehicle Price Index of 1.1% and 0.4% respectively1
. Similar easing is expected for
Canada as well, and a decline was evident in August when average used car prices
declined month-over-month by 0.3%2
(see Figure 9.). With increasing supply south of the
border, exports of used vehicles to the U.S. may also decline which might further ease
pressure on pricing.
Conclusion
An obvious endpoint for this analysis is that the impressions of industry participants are
confirmed; ACVs have been rising and this rise is counterintuitive when considered in the
context of how a number of widely reported economic indicators such as inflation, the
price of oil, and rates of employment have behaved. In fact, the story is more complex.
Although there may be a tendency to view the used car market as static, with a steady
supply of vehicles becoming available as the fleet inexorably turns over, it is anything but.
The research conducted for this paper reveals that current availability is largely determined
by the economic conditions that prevailed several years ago and by the response of the
marketplace to those conditions.
1	 NADA Used Car Guide, August, September, 2016
2	 Auto Remarketing Canada, September, 2016
FIGURE 9
1 4 | U N D E R S T A N D I N G R E C E N T T R E N D S I N A C V s
The recession of ’08-’09 dealt a serious blow to overall sales. It also had a dramatic impact
on car companies and financing institutions in terms of how they assessed and managed
risk. Leasing collapsed and with it a major source of supply to the used car market. To
maintain affordability, ETLs became commonplace.
These events and the responses to them impacted both short- and longer-term supply.
The disequilibrium between the supply and demand of used vehicles in both Canada
and the U.S. is a major driver of the recent rise in ACV values; the resurgence in leasing
and record sales of new vehicles is expected to reverse that trend in the near-term.
If nothing else, this analysis highlights the complexities of new and used vehicle markets
and the multiplicity of variables that drive volumes and pricing. A good example is the
impact that a declining dollar has had. When the Canadian dollar was at or near par with
the U.S. dollar Canadians turned to the U.S. and purchased new vehicles because, even
with import costs, lower MSRPs south of the border made it attractive to do so. Now the
tables have turned and used Canadian vehicles are seen as bargains by American buyers.
Used vehicle exports help ease supply issues in the importing country but exacerbate
them in the source country.
The challenge this complexity presents for market watchers and forecasters is significant.
It is reasonable to broadly predict future trends but exceedingly difficult to determine
the delta of marketplace changes with any accuracy. The analysis also highlights that
Autosource, which uses current marketplace prices obtained from multiple sources, is an
excellent proxy for the market. The cluster analysis reveals how changes in supply and
changing consumer preferences impact pricing - Autosource valuations effectively track
these changes.
There are some emerging trends that are likely to have an impact going forward. New
vehicle sales in Canada softened somewhat beginning in July and continuing through
August and September, but still remain at historically high levels and in aggregate are up
by 3.2% year-over-year1
. The consumer shift away from passenger cars to sport utilities
and crossovers continues unabated. Also noteworthy is the long-term trend toward greater
negative equity. This will affect the ability of consumers to take on additional debt meaning
that some will retain their vehicles longer and others will be pushed into different vehicle
and financing choices when they fail to meet the underwriting criteria of lending institutions
for the purchase of new vehicles. How these trends will affect the future supply and pricing
of used vehicles will only be apparent through continued monitoring and analysis.
1	 DesRosiers Automotive Consultants Inc.
The disequilibrium between the supply and
demand of used vehicles is a major driver of
the recent rise in ACV values.
Audatex Canada
1210 Sheppard Avenue East, Suite 204
North York, Ontario
M2K 1E3
info@audatex.ca
Intelligence.BuiltIn.
Copyright © 2016 Audatex Canada, All rights reserved.
The information contained in this document represents the current view of Audatex
on the issue discussed as of the date of publication. Because Audatex must respond
to changing market conditions, it should not be interpreted to be a commitment on
the part of Audatex, and Audatex cannot guarantee the accuracy of any information
presented after the date of publication.

More Related Content

What's hot

paperboard market
paperboard marketpaperboard market
paperboard market
snehaltirthkar
 
Starkstes IPO-Jahr seit Jahrtausendwende
Starkstes IPO-Jahr seit JahrtausendwendeStarkstes IPO-Jahr seit Jahrtausendwende
Starkstes IPO-Jahr seit Jahrtausendwende
EY
 
Inland Global Market Report 2018
Inland Global Market Report 2018Inland Global Market Report 2018
Inland Global Market Report 2018
SainathMuntha1
 
Canada M&A Insights - March 2017
Canada M&A Insights - March 2017Canada M&A Insights - March 2017
Canada M&A Insights - March 2017
Duff & Phelps
 
Capital Markets Insights - Q4 2016
Capital Markets Insights - Q4 2016Capital Markets Insights - Q4 2016
Capital Markets Insights - Q4 2016
Duff & Phelps
 
Electricity in Canada
Electricity in CanadaElectricity in Canada
Electricity in Canada
ReportLinker.com
 
WMStrategy Demo South and Central America Ethylene Oxide Market January 2019
WMStrategy Demo South and Central America Ethylene Oxide Market January 2019WMStrategy Demo South and Central America Ethylene Oxide Market January 2019
WMStrategy Demo South and Central America Ethylene Oxide Market January 2019
Williams & Marshall Strategy
 
EY Analyst themes of quarterly oil & gas earnings: 3Q18
EY Analyst themes of quarterly oil & gas earnings: 3Q18EY Analyst themes of quarterly oil & gas earnings: 3Q18
EY Analyst themes of quarterly oil & gas earnings: 3Q18
EY
 
2016-us-goodwill-impairment-study
2016-us-goodwill-impairment-study2016-us-goodwill-impairment-study
2016-us-goodwill-impairment-studyDave Wright
 
SVB State of the Markets Q3 2018
SVB State of the Markets Q3 2018SVB State of the Markets Q3 2018
SVB State of the Markets Q3 2018
Silicon Valley Bank
 
EY Power transactions and trends: Q2 2018
EY Power transactions and trends: Q2 2018EY Power transactions and trends: Q2 2018
EY Power transactions and trends: Q2 2018
EY
 
A Consultant's View
A Consultant's ViewA Consultant's View
A Consultant's View
KAED1
 
Global Insight
Global Insight Global Insight
Global Insight
David Apted
 

What's hot (13)

paperboard market
paperboard marketpaperboard market
paperboard market
 
Starkstes IPO-Jahr seit Jahrtausendwende
Starkstes IPO-Jahr seit JahrtausendwendeStarkstes IPO-Jahr seit Jahrtausendwende
Starkstes IPO-Jahr seit Jahrtausendwende
 
Inland Global Market Report 2018
Inland Global Market Report 2018Inland Global Market Report 2018
Inland Global Market Report 2018
 
Canada M&A Insights - March 2017
Canada M&A Insights - March 2017Canada M&A Insights - March 2017
Canada M&A Insights - March 2017
 
Capital Markets Insights - Q4 2016
Capital Markets Insights - Q4 2016Capital Markets Insights - Q4 2016
Capital Markets Insights - Q4 2016
 
Electricity in Canada
Electricity in CanadaElectricity in Canada
Electricity in Canada
 
WMStrategy Demo South and Central America Ethylene Oxide Market January 2019
WMStrategy Demo South and Central America Ethylene Oxide Market January 2019WMStrategy Demo South and Central America Ethylene Oxide Market January 2019
WMStrategy Demo South and Central America Ethylene Oxide Market January 2019
 
EY Analyst themes of quarterly oil & gas earnings: 3Q18
EY Analyst themes of quarterly oil & gas earnings: 3Q18EY Analyst themes of quarterly oil & gas earnings: 3Q18
EY Analyst themes of quarterly oil & gas earnings: 3Q18
 
2016-us-goodwill-impairment-study
2016-us-goodwill-impairment-study2016-us-goodwill-impairment-study
2016-us-goodwill-impairment-study
 
SVB State of the Markets Q3 2018
SVB State of the Markets Q3 2018SVB State of the Markets Q3 2018
SVB State of the Markets Q3 2018
 
EY Power transactions and trends: Q2 2018
EY Power transactions and trends: Q2 2018EY Power transactions and trends: Q2 2018
EY Power transactions and trends: Q2 2018
 
A Consultant's View
A Consultant's ViewA Consultant's View
A Consultant's View
 
Global Insight
Global Insight Global Insight
Global Insight
 

Viewers also liked

마마미투
마마미투마마미투
마마미투
jerywe
 
뜨리바다펜션 여행사추천
뜨리바다펜션 여행사추천뜨리바다펜션 여행사추천
뜨리바다펜션 여행사추천
jerywe
 
Lady tavares
Lady tavaresLady tavares
Lady tavares
tefitaperez
 
소다
소다소다
소다
jerywe
 
Pantallazo de cris
Pantallazo de crisPantallazo de cris
Pantallazo de cris
kimberlin172
 
Animales en Peligro de Entincion
Animales en Peligro de EntincionAnimales en Peligro de Entincion
Animales en Peligro de Entincion
Yahaira Miranda
 
PRIMEROS AUXILIOS
PRIMEROS AUXILIOSPRIMEROS AUXILIOS
PRIMEROS AUXILIOS
laura bonilla duran
 
Sheet - COO 33 - 3°-5° PISO ELE-SAN
Sheet - COO 33 - 3°-5° PISO ELE-SANSheet - COO 33 - 3°-5° PISO ELE-SAN
Sheet - COO 33 - 3°-5° PISO ELE-SANJessica Reyes Aliaga
 
Saving general yang ready for dl
Saving general yang ready for dlSaving general yang ready for dl
Saving general yang ready for dl
staceemc
 
Educación inclusiva
Educación inclusivaEducación inclusiva
Educación inclusiva
magavc20
 
Supercopa gaúcha artilharia
Supercopa gaúcha   artilhariaSupercopa gaúcha   artilharia
Supercopa gaúcha artilharia
Rafael Passos
 
Campeonato brasileiro – artilharia
Campeonato brasileiro – artilhariaCampeonato brasileiro – artilharia
Campeonato brasileiro – artilharia
Rafael Passos
 
Campeonato brasileiro – artilharia
Campeonato brasileiro – artilhariaCampeonato brasileiro – artilharia
Campeonato brasileiro – artilharia
Rafael Passos
 
Musculos del gluteo y muslo
Musculos del gluteo y musloMusculos del gluteo y muslo
Musculos del gluteo y muslo
NubiaArdila1
 
Garbage
GarbageGarbage
Garbage
Tareq Zarouni
 
EMC Forum
EMC ForumEMC Forum
EMC Forum
Julien SIMON
 

Viewers also liked (17)

마마미투
마마미투마마미투
마마미투
 
Resume (1)
Resume (1)Resume (1)
Resume (1)
 
뜨리바다펜션 여행사추천
뜨리바다펜션 여행사추천뜨리바다펜션 여행사추천
뜨리바다펜션 여행사추천
 
Lady tavares
Lady tavaresLady tavares
Lady tavares
 
소다
소다소다
소다
 
Pantallazo de cris
Pantallazo de crisPantallazo de cris
Pantallazo de cris
 
Animales en Peligro de Entincion
Animales en Peligro de EntincionAnimales en Peligro de Entincion
Animales en Peligro de Entincion
 
PRIMEROS AUXILIOS
PRIMEROS AUXILIOSPRIMEROS AUXILIOS
PRIMEROS AUXILIOS
 
Sheet - COO 33 - 3°-5° PISO ELE-SAN
Sheet - COO 33 - 3°-5° PISO ELE-SANSheet - COO 33 - 3°-5° PISO ELE-SAN
Sheet - COO 33 - 3°-5° PISO ELE-SAN
 
Saving general yang ready for dl
Saving general yang ready for dlSaving general yang ready for dl
Saving general yang ready for dl
 
Educación inclusiva
Educación inclusivaEducación inclusiva
Educación inclusiva
 
Supercopa gaúcha artilharia
Supercopa gaúcha   artilhariaSupercopa gaúcha   artilharia
Supercopa gaúcha artilharia
 
Campeonato brasileiro – artilharia
Campeonato brasileiro – artilhariaCampeonato brasileiro – artilharia
Campeonato brasileiro – artilharia
 
Campeonato brasileiro – artilharia
Campeonato brasileiro – artilhariaCampeonato brasileiro – artilharia
Campeonato brasileiro – artilharia
 
Musculos del gluteo y muslo
Musculos del gluteo y musloMusculos del gluteo y muslo
Musculos del gluteo y muslo
 
Garbage
GarbageGarbage
Garbage
 
EMC Forum
EMC ForumEMC Forum
EMC Forum
 

Similar to Autosource-Whitepaper-Final

Automotive Aftermarket in North America to 2016
Automotive Aftermarket in North America to 2016Automotive Aftermarket in North America to 2016
Automotive Aftermarket in North America to 2016ReportsnReports
 
Connected Logistics Market.pdf
Connected Logistics Market.pdfConnected Logistics Market.pdf
Connected Logistics Market.pdf
sagarsingh443888
 
Sewells Group Automotive Dealer Confidence Index (ADCI) Report Apr-Jun 2014
Sewells Group Automotive Dealer Confidence Index (ADCI) Report Apr-Jun 2014Sewells Group Automotive Dealer Confidence Index (ADCI) Report Apr-Jun 2014
Sewells Group Automotive Dealer Confidence Index (ADCI) Report Apr-Jun 2014
Sewells MSXI
 
Fleet activity a strong indicator of economic health
Fleet activity a strong indicator of economic healthFleet activity a strong indicator of economic health
Fleet activity a strong indicator of economic health
Michael Mocanu
 
WCG_US_Asset_Auto_Report_2016
WCG_US_Asset_Auto_Report_2016WCG_US_Asset_Auto_Report_2016
WCG_US_Asset_Auto_Report_2016Dave Mirsky
 
2008 Global Wireless Industry Survey
2008 Global Wireless Industry Survey2008 Global Wireless Industry Survey
2008 Global Wireless Industry Survey
Jordi Planas Manzano
 
Term ProjectFinancial Statement Analysis of Autonation and.docx
Term ProjectFinancial Statement Analysis of Autonation and.docxTerm ProjectFinancial Statement Analysis of Autonation and.docx
Term ProjectFinancial Statement Analysis of Autonation and.docx
bradburgess22840
 
ACT Research: Economy Strong, but Moderating; CV Industry Nearing Inflection ...
ACT Research: Economy Strong, but Moderating; CV Industry Nearing Inflection ...ACT Research: Economy Strong, but Moderating; CV Industry Nearing Inflection ...
ACT Research: Economy Strong, but Moderating; CV Industry Nearing Inflection ...
Ian McGriff
 
Cargo global market report 2018
Cargo global market report 2018Cargo global market report 2018
Cargo global market report 2018
lakshmipraneethganti
 
Lng carriers market
Lng carriers marketLng carriers market
Lng carriers market
Kalyani Deshmukh
 
Sewells MSXI ADCI Report Oct-Dec 2016 Edition
Sewells MSXI ADCI Report Oct-Dec 2016 EditionSewells MSXI ADCI Report Oct-Dec 2016 Edition
Sewells MSXI ADCI Report Oct-Dec 2016 Edition
Sewells MSXI
 
Accenture Spend Trends Report Q2 2014
Accenture Spend Trends Report Q2 2014Accenture Spend Trends Report Q2 2014
Accenture Spend Trends Report Q2 2014
accenture
 
Business forecasting project border
Business forecasting project borderBusiness forecasting project border
Business forecasting project border
Shruti Nigam (CWM, AFP)
 
Sewells group adci report (India)
Sewells group adci report (India) Sewells group adci report (India)
Sewells group adci report (India)
Sewells MSXI
 
Snapshot report - Sustainability in Trucking
Snapshot report - Sustainability in TruckingSnapshot report - Sustainability in Trucking
Snapshot report - Sustainability in Trucking
Jennifer Wong
 
ATRADIUS Payment-Practices-Barometer-ASIA Octubre16
ATRADIUS Payment-Practices-Barometer-ASIA Octubre16ATRADIUS Payment-Practices-Barometer-ASIA Octubre16
ATRADIUS Payment-Practices-Barometer-ASIA Octubre16
Jaime Cubillo Fleming
 
Accenture Spend Trends Report Q3 2014
Accenture Spend Trends Report Q3 2014Accenture Spend Trends Report Q3 2014
Accenture Spend Trends Report Q3 2014
accenture
 
Vehicle Retarder Market .pdf
Vehicle Retarder Market .pdfVehicle Retarder Market .pdf
Vehicle Retarder Market .pdf
Vrushali913094
 
SEWELLS GROUP ADCI REPORT- END OF JUL-SEP 2014 QUARTER (INDIA)
SEWELLS GROUP ADCI REPORT- END OF JUL-SEP 2014 QUARTER (INDIA)SEWELLS GROUP ADCI REPORT- END OF JUL-SEP 2014 QUARTER (INDIA)
SEWELLS GROUP ADCI REPORT- END OF JUL-SEP 2014 QUARTER (INDIA)
Sewells MSXI
 

Similar to Autosource-Whitepaper-Final (20)

Automotive Aftermarket in North America to 2016
Automotive Aftermarket in North America to 2016Automotive Aftermarket in North America to 2016
Automotive Aftermarket in North America to 2016
 
Connected Logistics Market.pdf
Connected Logistics Market.pdfConnected Logistics Market.pdf
Connected Logistics Market.pdf
 
HCUK-mid-year-review
HCUK-mid-year-reviewHCUK-mid-year-review
HCUK-mid-year-review
 
Sewells Group Automotive Dealer Confidence Index (ADCI) Report Apr-Jun 2014
Sewells Group Automotive Dealer Confidence Index (ADCI) Report Apr-Jun 2014Sewells Group Automotive Dealer Confidence Index (ADCI) Report Apr-Jun 2014
Sewells Group Automotive Dealer Confidence Index (ADCI) Report Apr-Jun 2014
 
Fleet activity a strong indicator of economic health
Fleet activity a strong indicator of economic healthFleet activity a strong indicator of economic health
Fleet activity a strong indicator of economic health
 
WCG_US_Asset_Auto_Report_2016
WCG_US_Asset_Auto_Report_2016WCG_US_Asset_Auto_Report_2016
WCG_US_Asset_Auto_Report_2016
 
2008 Global Wireless Industry Survey
2008 Global Wireless Industry Survey2008 Global Wireless Industry Survey
2008 Global Wireless Industry Survey
 
Term ProjectFinancial Statement Analysis of Autonation and.docx
Term ProjectFinancial Statement Analysis of Autonation and.docxTerm ProjectFinancial Statement Analysis of Autonation and.docx
Term ProjectFinancial Statement Analysis of Autonation and.docx
 
ACT Research: Economy Strong, but Moderating; CV Industry Nearing Inflection ...
ACT Research: Economy Strong, but Moderating; CV Industry Nearing Inflection ...ACT Research: Economy Strong, but Moderating; CV Industry Nearing Inflection ...
ACT Research: Economy Strong, but Moderating; CV Industry Nearing Inflection ...
 
Cargo global market report 2018
Cargo global market report 2018Cargo global market report 2018
Cargo global market report 2018
 
Lng carriers market
Lng carriers marketLng carriers market
Lng carriers market
 
Sewells MSXI ADCI Report Oct-Dec 2016 Edition
Sewells MSXI ADCI Report Oct-Dec 2016 EditionSewells MSXI ADCI Report Oct-Dec 2016 Edition
Sewells MSXI ADCI Report Oct-Dec 2016 Edition
 
Accenture Spend Trends Report Q2 2014
Accenture Spend Trends Report Q2 2014Accenture Spend Trends Report Q2 2014
Accenture Spend Trends Report Q2 2014
 
Business forecasting project border
Business forecasting project borderBusiness forecasting project border
Business forecasting project border
 
Sewells group adci report (India)
Sewells group adci report (India) Sewells group adci report (India)
Sewells group adci report (India)
 
Snapshot report - Sustainability in Trucking
Snapshot report - Sustainability in TruckingSnapshot report - Sustainability in Trucking
Snapshot report - Sustainability in Trucking
 
ATRADIUS Payment-Practices-Barometer-ASIA Octubre16
ATRADIUS Payment-Practices-Barometer-ASIA Octubre16ATRADIUS Payment-Practices-Barometer-ASIA Octubre16
ATRADIUS Payment-Practices-Barometer-ASIA Octubre16
 
Accenture Spend Trends Report Q3 2014
Accenture Spend Trends Report Q3 2014Accenture Spend Trends Report Q3 2014
Accenture Spend Trends Report Q3 2014
 
Vehicle Retarder Market .pdf
Vehicle Retarder Market .pdfVehicle Retarder Market .pdf
Vehicle Retarder Market .pdf
 
SEWELLS GROUP ADCI REPORT- END OF JUL-SEP 2014 QUARTER (INDIA)
SEWELLS GROUP ADCI REPORT- END OF JUL-SEP 2014 QUARTER (INDIA)SEWELLS GROUP ADCI REPORT- END OF JUL-SEP 2014 QUARTER (INDIA)
SEWELLS GROUP ADCI REPORT- END OF JUL-SEP 2014 QUARTER (INDIA)
 

Autosource-Whitepaper-Final

  • 1. U N D E R S T A N D I N G R E C E N T T R E N D S I N A C V s AUTOSOURCE MACROECONOMIC ANALYSIS
  • 2. Contents Summary 3 Purpose 3 Research Design 5 Research Findings 6 Data Analytics 6 Literature Research 8 Interpretaion & Analysis 9 Conclusion 13 BY COLIN WRIGHT Audatex is the world leader in the development and implementation of software and services for the automobile and insurance claims processing industry. As part of the Solera group of companies, we draw on our broad global claims market experience to identify and implement the best-practice processes that drive continuous improvement for our local customers and their trading partners. Autosource Macroeconomic Analysis: Understanding Recent Trends in ACVs Copyright © 2016 Audatex Canada. All rights reserved. Audatex, Autosource, and Audatex Estimating, are trademarks or registered trademarks of Audatex. All other trademarks used are the property of their respective owners.
  • 3. U N D E R S T A N D I N G R E C E N T T R E N D S I N A C V s | 3 Summary In terms of perspective, this white paper provides more of a ‘birds-eye’ view rather than a granular, case-by-case analysis of actual cash value (ACV) estimations. Some useful insights are made available. Principal among these are that macroeconomic factors are the key determinants for the supply of, and demand for, used vehicles, and of used vehicle pricing in aggregate. It is also apparent that Autosource ACV trends are reliable proxies for used vehicle market price trends. Although not explored in detail, it is clear that used vehicle markets in Canada and the U.S. are fundamentally alike, but the timing and scale of any response to marketplace events may be affected by other factors unique to each country. Purpose Many of Canada’s leading insurers rely on used vehicle valuations generated by Autosource, Audatex Canada’s valuation tool, to help them settle total loss claims. Autosource captures data from across the Canadian marketplace, finds vehicles that are both geographically proximate and comparable to the loss vehicle, and then uses a proprietary algorithm built using literally millions of data points to calculate a valuation amount. Autosource is a robust, time-tested product. Its outputs are critical to ensuring that the promise of indemnity, i.e., that the claimant will be restored to the position they were in prior to their loss, is met, and that the settlement process is equitable for both policyholder and insurer alike. Over the past 18-24 months, aggregate analyses suggested that actual cash value amounts were trending upward (See Figure 1.) during a period when inflation was negligible and other economic factors such as GDP growth, the price of oil, employment, and the value of the Canadian dollar were either soft or declining. In an environment where most indicators suggest that prices should hold steady or perhaps even decline, the trend in ACV seems counterintuitive.
  • 4. 4 | U N D E R S T A N D I N G R E C E N T T R E N D S I N A C V s From a client perspective, confidence in ACV is critical. They need to know that the data used is both representative and that the calculations used weight key factors appropriately. For Audatex, generating valuations is not a static process, but more an evolutionary one that necessitates continual re-evaluation of data, methods, assumptions and external factors that may be impactful. This study was undertaken to identify key drivers of recent trends and to confirm that generated valuations continue to accurately reflect the marketplace and are not artefacts of an imperfect methodology. FIGURE 1 For Audatex, generating valuations is not a static process, but more an evolutionary one.
  • 5. U N D E R S T A N D I N G R E C E N T T R E N D S I N A C V s | 5 Research Design The research design for this study comprises two components: a statistical analysis of 2015 ACV data; and a literature search focused primarily on reports generated by government agencies and commercial market research firms. Autosource data were extracted for 20151 and various data mining techniques were applied, including a cluster analysis, the construction of a linear regression model, a correlation analysis of expected vs. observed outcomes, and profiling of the identified clusters. The dataset included latest ACV values aggregated by month, province, region of origin, make, and vehicle category as well as vehicle age and mileage. Only data from typical instant, i.e., system-generated, valuations were included. A linear regression model built off the dataset also incorporated additional variables such as the value of the Canadian dollar over time. Part of the dataset from the first half of the year was used to “train” or fine tune the model while the remainder was reserved to test its predictive ability against observed results. Valuable insights were gained from a variety of sources accessed during the literature search conducted for the study. Because vehicle markets develop over multi-year, or even longer, timescales the search was not limited to only the most recent published material but also included analyses of economic events and trends stretching back for the better part of the last decade. Material from government entities such as the Financial Consumer Agency of Canada and Statistics Canada, as well as from the research arms of major financial institutions such as Scotiabank, was reviewed. Reports from specialist automotive research companies on both sides of the border, such as the U.S.-based National Automobile Dealers Association (NADA) and DesRosiers Automotive Consultants in Canada, were also examined. Business news reports published by mainstream media outlets such as The Globe & Mail or The Financial Post provided additional, relevant information. As a starting point for the research and subsequent analytical activity, it was hypothesized that ACVs are proxies for used vehicle market prices and that any long-term movement or identifiable trend in ACVs will mirror real-world events, price movements, and trends in those markets. As such, the drivers of the used vehicle market will also drive ACVs. 1 Obtaining current data for the used car market in Canada can be challenging. For example, there is a two-three-month lag for Statistics Canada price data and seasonal adjustments are made to prior entries with each new entry. Volume data are not readily accessible except in year-end summaries. The ability to provide an “up to the minute” snapshot of the market is, therefore, constrained.
  • 6. 6 | U N D E R S T A N D I N G R E C E N T T R E N D S I N A C V s A strong correlation between changes to ACVs and changes in $CAD/$USD exchange rate is a suprising find. Research Findings Data Analytics Through the initial data analysis, fourteen clusters were defined. Each cluster contained vehicle makes and models that share similar characteristics. A multiple linear regression model was developed and trained with a subset of the data as planned. The model was then used to forecast results for the remainder of the dataset. Actual ACVs for the latter half of the year were then compared with the forecast ACVs, exceeding them by an average of $674 at year-end. Two of the fourteen clusters defined were weakly correlated with overall ACV and two others, clusters 4 and 8, were negatively correlated, meaning that the actual results for these clusters moved in the opposite direction to what the model predicted. Clusters 4 and 8 accounted for 36% of the valuations in the dataset which suggests that they strongly influenced the difference between actual and model results. Examining the composition of these clusters revealed that 50% of the vehicles in Cluster 4 are classified as “Economy-Domestic” while an additional 14% are “Economy-Import”. In terms of vehicle makes, Cluster 4 contains a disproportionate number of vehicles from defunct brands; Pontiac, Saturn, and Oldsmobile account for 42%, 11% and 8% of the cars in the cluster, respectively. These brands are overrepresented in the cluster relative to their distribution within the dataset overall. Within Cluster 8, “Economy-Import” at 47%, and “Mid-Foreign” at 27% are the predominant categories, and Toyota, Honda, Nissan and Volkswagen are notable brands (See Figure 2.). At shares of 29%, 13%, 10% and 9%, respectively, these makes account for nearly two thirds of the vehicles in the cluster. FIGURE 2
  • 7. U N D E R S T A N D I N G R E C E N T T R E N D S I N A C V s | 7 A strong correlation discovered between changes to ACVs and changes in the $CAD/$USD exchange rate is a somewhat surprising finding. Although the U.S. is Canada’s largest trading partner, there is no obvious reason that the value of the dollar should correlate with, or have any influence upon Canadian used vehicle prices as these are domestic assets being bought and sold in the domestic market with domestic currency. A separate analysis was conducted comparing ACVs for both cars and light trucks for 2014 through the first quarter of 2016 with the Consumer Price Index (CPI)1 over the same period. The following charts (Figures 3. & 4.) illustrate a generally positive correlation, particularly for cars, with overall price inflation in the Canadian economy. 1 Source for CPI data: www.statcan.gc.ca FIGURE 3 FIGURE 4
  • 8. 8 | U N D E R S T A N D I N G R E C E N T T R E N D S I N A C V s Literature Research The purpose of the literature search was twofold: identify current marketplace trends and the key macroeconomic factors that drive them; and provide historical context by reviewing and analyzing recent, relevant economic events. Notable findings: Over the 2012-2015 time frame, the total value of used car sales in Canada increased 18%, while the average price increased 20%1 and total unit volume declined 2%2 (Figure 5). • Following near-record new car sales in 2012, record sales were seen in 2013, 2014 and 2015 • There are still approximately ten million cars ten years old or older on Canadian roads – replacement demand continues to fuel a very active new car market in 2016 • Consumer preference has shifted to light trucks and crossovers – sales of subcompact and compact cars have declined • Low fuel prices plus favourable purchase financing and leasing options contribute to changing preferences • While the overall value of used cars sold in Canada has risen over the past few years the number of units sold has declined slightly meaning that average values have increased 1 Statistics Canada, CANSIM 080-0020, 2016 2 DesRosiers Automotive Consultants Inc., 2016 FIGURE 5
  • 9. U N D E R S T A N D I N G R E C E N T T R E N D S I N A C V s | 9 • There is a used car shortage that is putting upward pressure on prices – particularly within specific categories • Industry-watchers expect the shortage to ease as the effects of multiple factors, e.g., changing consumer preferences or changes in financing, impact supply • Used vehicle sales from Canada to the U.S. have soared as the value of the Canadian dollar has declined • The recession in 2008-09 profoundly impacted auto sales on both sides of the border • Post-recession, new vehicle financing changed significantly1 • In 2007 in Canada, leasing had a 42.4% share of new vehicle financing – this collapsed to a 7.1% share in 2009 • Leasing has been rebounding steadily – in 2015, 28.8% of new cars in Canada were financed with leases • During the recession, some automakers, notably GM Corp. and Chrysler LLC, suspended leasing altogether while others limited its availability to certain market segments • Chrysler did not offer leasing in Canada from 2008 until 2013, and GM from 2008 until 2011 • To maintain affordability, the market shifted to extended-term loans (ETLs) – average terms have increased by two months annually since 2010 reaching 74 months in 2015 • 84- and 96-month ETLs are now commonplace • There is increasing concern about an “auto bubble” – ETLs and broader availability of leasing options contribute to ever-higher levels of consumer debt – the frothy new car market of recent years could contract sharply under certain scenarios which would have an impact on used car markets a few years down the road Interpretaion & Analysis The results of the data analytics and literature search point in the same direction. Recent increases in ACVs mirror a rise in average used car prices that is driven by multiple factors. Principal among these is a shortage in supply that has its roots in the recession of 2008-09. Off-lease vehicles are an important source of supply to the used car market. Lease financing terms are typically 36-60 months in length meaning that many late-model used cars are lease returns. The cessation or sharp curtailing of leasing by major manufacturers during the recession directly affected used car supply 3-5 years later. As noted by the Financial Consumer Agency of Canada, consumer purchase decisions hinge on affordability, or more correctly, on the regular payment amount needed to finance the vehicle2 . In fact, much vehicle advertising highlights the payment amount while burying the full retail price and other payment terms in fine print. 1 For the purposes of this document, loans, leases and cash are all considered as different forms of purchase financing. 2 Auto Finance: Market Trends, Financial Consumer Agency of Canada, March 2016
  • 10. 1 0 | U N D E R S T A N D I N G R E C E N T T R E N D S I N A C V s In order to continue to provide car shoppers with attractive, “affordable” financing options in the absence of leasing programs, manufacturers turned to extended term loans, low interest rates and more frequent payments. Previously, typical car loans had 36-48 month terms paid monthly. Post-recession, ETLs became the norm with terms of 60, 72, 84, and, more recently, 96 months. In addition, bi-weekly, or even weekly repayment schedules have become commonplace. Advertising focused on the payment amount and the low, or even 0% interest rates being offered. Consumer choice has also been affected by ETL financing. Purchasers who focus on the regular payment rather than on the total cost of financing have a tendency to buy up and purchase “more car”, or possibly a different type of vehicle such as a crossover or compact SUV (Figure 6). The increasing prevalence of ETLs has played a part in shifting consumer preference away from conventional passenger cars toward light trucks. In an expanding market over the period 2011–2015 where the total number of units sold has risen from 1,585,519 to 1,898,485, the passenger car share of market has slipped from 43.8% to 37.7% while the light truck share of market has grown from 56.2% to 62.3%1 . Many consumers find themselves in a negative equity position because of ETLs – they owe more than their car is worth for much of the loan term – the average amount of ETL negative equity is -$6,7002 . For some car owners, being in a negative equity position is a disincentive to sell or trade their vehicle before they have finished paying for it which effectively delays the addition of these vehicles to the used vehicle market. When GM and Chrysler went into bankruptcy protection in 2008 they suspended their leasing programs. This action would have had the effect of limiting the supply of vehicles from these manufacturers to the used vehicle marketplace in the short- to medium-term, as purchasers would have been forced to migrate to longer-term ETLs for affordable financing. The recession also impacted new vehicle sales overall (see Figure 7, below). Total sales volume for new passenger cars and light trucks collapsed from about 1.69 million units in 2007 to 1.48 million in 20093 . The market has steadily rebounded since, achieving successive new records in the past three years. These changes in sales volume, financing and consumer preference affect the market 1 DesRosiers Automotive Consultants Inc., 2016 2 Financial Consumer Agency of Canada, March 2016 3 Statistics Canada, CANSIM 079-0003, 2016 FIGURE 6
  • 11. U N D E R S T A N D I N G R E C E N T T R E N D S I N A C V s | 1 1 unevenly, i.e., by region, vehicle type, make and model, but the overall effect post-recession was a slow erosion of the supply of used vehicles to the Canadian market. Figure 8., below, maps the changes in finance options against overall unit sales. It shows that leasing peaked in 2005 and then suffered a 38% drop in share of finance by the end of 20091 . Unit sales of used vehicles, rose for four years until 2011, after which they began to decline, suggesting, first, an increase in supply between 2005 and 2011, and then a subsequent tightening of supply. Three years later, used sales were again on the rise, fueled by steadily increasing supplies of off-lease vehicles as leasing rebounded over the intervening years, plus the addition of vehicles purchased post-recession using conventional financing. 1 DesRosiers Automotive Consultants Inc., 2016 FIGURE 7 …leasing peaked in 2005 and then suffered a 38% drop in share of finance by the end of 2009. In the broadest terms, the expected response to a reduction in supply is upward pressure on pricing. The cluster analysis provides support for this. As discussed in the Data Analytics section earlier, cluster 8 accounted for 30% of the valuations in the dataset. The largest vehicle categories in the cluster are “Economy-Import” at 47%, “Mid-Foreign” at 27%, “Minivans” at 11%, and “Economy- Domestic” at 8%. On a brand basis, Toyota, Honda, and Nissan account for 29%, 13%, and 10% of the vehicles in the clusterwhile Ford, Dodge and Volkswagen have 9% each. Notably, Toyota and Volkswagen were overrepresented in the cluster relative to their distribution within the dataset overall.
  • 12. 1 2 | U N D E R S T A N D I N G R E C E N T T R E N D S I N A C V s Cluster 8 ACVs are negatively correlated with model predictions meaning that they are higher than projected. Taking into account the various factors influencing supply, it is reasonable to posit that fewer domestic vehicles would have been added to the used vehicle market as lease returns dried up. This would have a twofold impact on pricing as the limited supply of domestic vehicles would lend buoyancy to prices for those vehicles and, in turn, consumers looking for domestics but finding fewer to choose from would look for substitutes, i.e., similar imported vehicles. The increased demand for a limited supply of imported, foreign vehicles would put price pressure on those vehicles. A reduction in supply of one category leads to increased demand for a substitute category and both categories experience upward price pressure. Recent changes in the $CAD/$USD exchange rate only served to exacerbate the problem. As noted previously, the rise in ACVs is also negatively correlated with the decline in the value of the Canadian dollar versus the US dollar. In 2015, Americans bought 200,000 used vehicles in Canada and exported them to the U.S. - 7% of the total number of used vehicles sold in Canada1 . The favourable exchange rate makes Canadian used autos very attractive to U.S. buyers; dealers are reported to be paying asking prices at auction and shipping truckloads of vehicles south. The impact on the Canadian market is a reduction in the supply of late model used vehicles contributing to increased retail prices. Exports from every province climbed in 2015, but Ontario was the dominant supplier suggesting that impacts might be experienced differently by region2 . Looking forward, the ongoing resurgence of leasing post-recession bodes well for used car buyers. Analyses of the U.S. market suggest that as these vehicles start to come off-lease in 2016-2018 buyers will have greater choice and the increased supply is expected to exert downward pressure on prices3 . These expectations appear to be coming to fruition. 1 Auto Remarketing Canada, 2016 2 Scotiabank, 2015 3 National Automobile Dealers Association, NADA Used Car Guide, under licence by J.D. Power and Associates, 2016 FIGURE 8
  • 13. U N D E R S T A N D I N G R E C E N T T R E N D S I N A C V s | 1 3 The NADA Used Car Guide for August and September report consecutive declines in the Used Vehicle Price Index of 1.1% and 0.4% respectively1 . Similar easing is expected for Canada as well, and a decline was evident in August when average used car prices declined month-over-month by 0.3%2 (see Figure 9.). With increasing supply south of the border, exports of used vehicles to the U.S. may also decline which might further ease pressure on pricing. Conclusion An obvious endpoint for this analysis is that the impressions of industry participants are confirmed; ACVs have been rising and this rise is counterintuitive when considered in the context of how a number of widely reported economic indicators such as inflation, the price of oil, and rates of employment have behaved. In fact, the story is more complex. Although there may be a tendency to view the used car market as static, with a steady supply of vehicles becoming available as the fleet inexorably turns over, it is anything but. The research conducted for this paper reveals that current availability is largely determined by the economic conditions that prevailed several years ago and by the response of the marketplace to those conditions. 1 NADA Used Car Guide, August, September, 2016 2 Auto Remarketing Canada, September, 2016 FIGURE 9
  • 14. 1 4 | U N D E R S T A N D I N G R E C E N T T R E N D S I N A C V s The recession of ’08-’09 dealt a serious blow to overall sales. It also had a dramatic impact on car companies and financing institutions in terms of how they assessed and managed risk. Leasing collapsed and with it a major source of supply to the used car market. To maintain affordability, ETLs became commonplace. These events and the responses to them impacted both short- and longer-term supply. The disequilibrium between the supply and demand of used vehicles in both Canada and the U.S. is a major driver of the recent rise in ACV values; the resurgence in leasing and record sales of new vehicles is expected to reverse that trend in the near-term. If nothing else, this analysis highlights the complexities of new and used vehicle markets and the multiplicity of variables that drive volumes and pricing. A good example is the impact that a declining dollar has had. When the Canadian dollar was at or near par with the U.S. dollar Canadians turned to the U.S. and purchased new vehicles because, even with import costs, lower MSRPs south of the border made it attractive to do so. Now the tables have turned and used Canadian vehicles are seen as bargains by American buyers. Used vehicle exports help ease supply issues in the importing country but exacerbate them in the source country. The challenge this complexity presents for market watchers and forecasters is significant. It is reasonable to broadly predict future trends but exceedingly difficult to determine the delta of marketplace changes with any accuracy. The analysis also highlights that Autosource, which uses current marketplace prices obtained from multiple sources, is an excellent proxy for the market. The cluster analysis reveals how changes in supply and changing consumer preferences impact pricing - Autosource valuations effectively track these changes. There are some emerging trends that are likely to have an impact going forward. New vehicle sales in Canada softened somewhat beginning in July and continuing through August and September, but still remain at historically high levels and in aggregate are up by 3.2% year-over-year1 . The consumer shift away from passenger cars to sport utilities and crossovers continues unabated. Also noteworthy is the long-term trend toward greater negative equity. This will affect the ability of consumers to take on additional debt meaning that some will retain their vehicles longer and others will be pushed into different vehicle and financing choices when they fail to meet the underwriting criteria of lending institutions for the purchase of new vehicles. How these trends will affect the future supply and pricing of used vehicles will only be apparent through continued monitoring and analysis. 1 DesRosiers Automotive Consultants Inc. The disequilibrium between the supply and demand of used vehicles is a major driver of the recent rise in ACV values.
  • 15. Audatex Canada 1210 Sheppard Avenue East, Suite 204 North York, Ontario M2K 1E3 info@audatex.ca Intelligence.BuiltIn. Copyright © 2016 Audatex Canada, All rights reserved. The information contained in this document represents the current view of Audatex on the issue discussed as of the date of publication. Because Audatex must respond to changing market conditions, it should not be interpreted to be a commitment on the part of Audatex, and Audatex cannot guarantee the accuracy of any information presented after the date of publication.