Downloaded 227 times


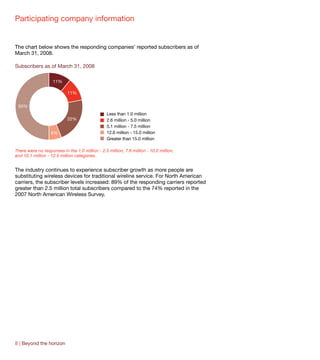
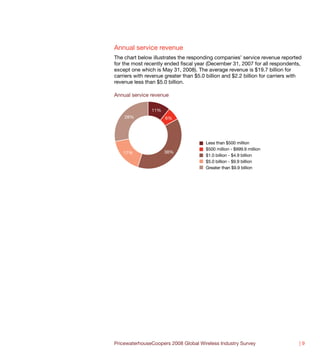
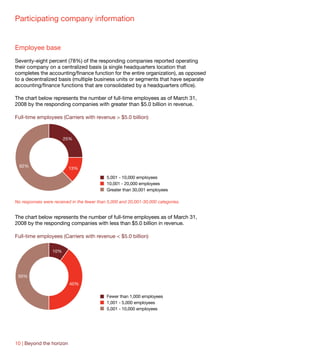
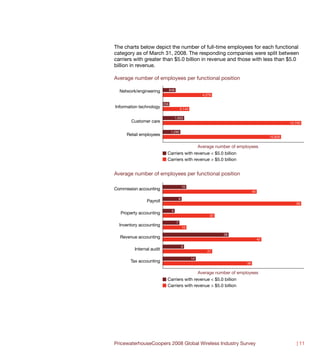

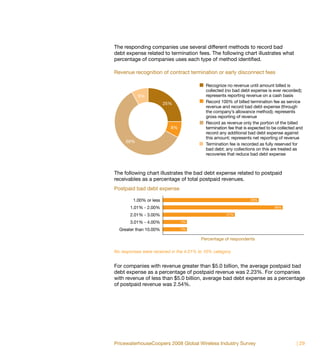
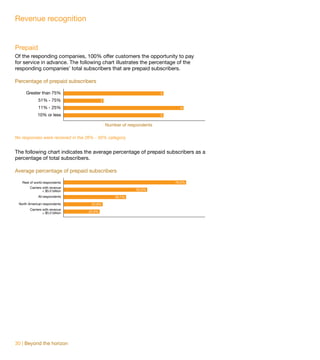
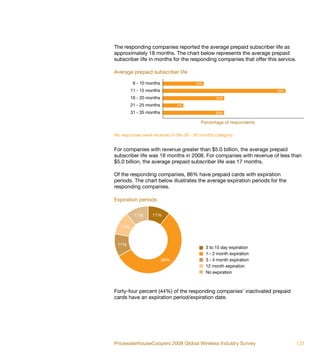
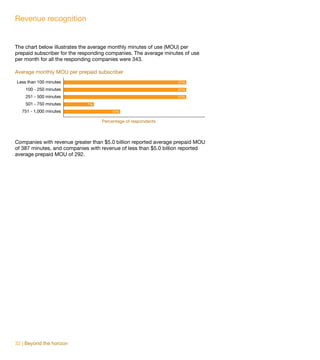
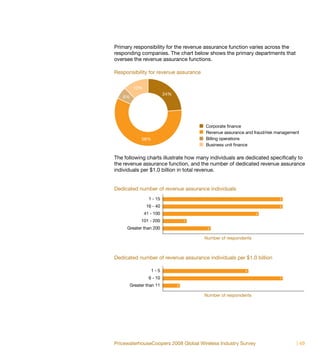


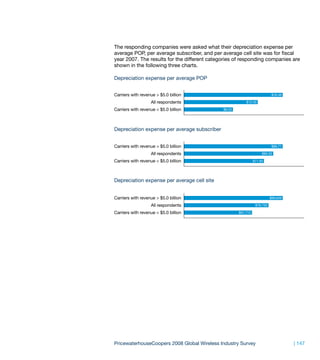

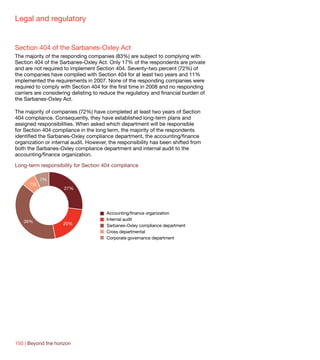
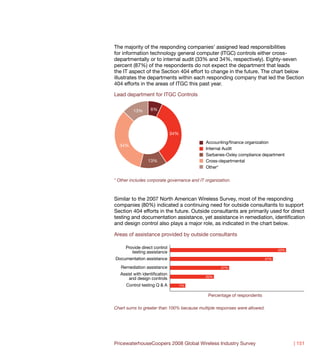


The document provides information about companies that participated in PricewaterhouseCoopers' 2008 Global Wireless Industry Survey. It includes the names of 18 participating companies from the US, Canada, and other parts of the world. It also provides details on the companies' subscribers, revenues, employees, sales locations, and other operating details. The survey aims to understand industry practices and trends in areas like revenue recognition, performance measures, property/equipment, and legal/regulatory issues.


![Sam SCCUR Presentation [228051]-2](https://cdn.slidesharecdn.com/ss_thumbnails/0574e36b-d241-4664-af87-d4bb434e41c5-160504093212-thumbnail.jpg?width=640&height=640&fit=bounds)


![[OEI] Open Energy Institute](https://cdn.slidesharecdn.com/ss_thumbnails/jwhyl5crrw2qnuzzwrku-signature-14cb056c1f41c87fb10932c8dc69b978bf29bb2d666bd105617c67f8fde542d8-poli-140717025021-phpapp01-thumbnail.jpg?width=640&height=640&fit=bounds)


