
Recommended
More Related Content
What's hot
What's hot (17)
Viewers also liked
Similar to Market Matters Monthly Commentary Highlights 2010 Gains
Similar to Market Matters Monthly Commentary Highlights 2010 Gains (13)
More from Martin Leduc
Market Matters Monthly Commentary Highlights 2010 Gains
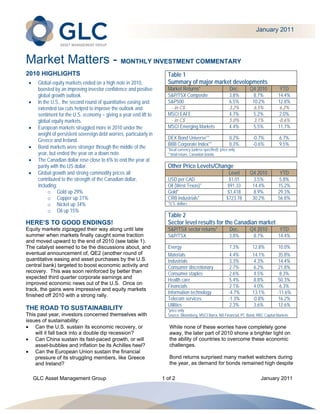
- 1. January 2011 Market Matters - MONTHLY INVESTMENT COMMENTARY 2010 HIGHLIGHTS Table 1 Global equity markets ended on a high note in 2010, Summary of major market developments boosted by an improving investor confidence and positive Market Returns* Dec. Q4 2010 YTD global growth outlook. S&P/TSX Composite 3.8% 8.7% 14.4% In the U.S., the second round of quantitative easing and S&P500 6.5% 10.2% 12.8% extended tax cuts helped to improve the outlook and - in C$ 3.2% 6.5% 6.2% sentiment for the U.S. economy – giving a year-end lift to MSCI EAFE 4.7% 5.2% 2.0% global equity markets. - in C$ 5.0% 3.1% -0.6% European markets struggled more in 2010 under the MSCI Emerging Markets 4.4% 5.5% 11.7% weight of persistent sovereign debt worries, particularly in Greece and Ireland. DEX Bond Universe** 0.2% -0.7% 6.7% BBB Corporate Index** 0.3% -0.6% 9.5% Bond markets were stronger through the middle of the *local currency (unless specified); price only year, but ended the year on a down note. **total return, Canadian bonds The Canadian dollar rose close to 6% to end the year at parity with the US dollar. Other Price Levels/Change Global growth and strong commodity prices all Level Q4 2010 YTD contributed to the strength of the Canadian dollar, USD per CAD $1.01 3.5% 5.8% including: Oil (West Texas)* $91.33 14.4% 15.2% o Gold up 29% Gold* $1,418 8.9% 29.3% o Copper up 31% CRB Industrials* $723.78 30.2% 56.8% o Nickel up 34% *U.S. dollars o Oil up 15% Table 2 HERE’S TO GOOD ENDINGS! Sector level results for the Canadian market Equity markets zigzagged their way along until late S&P/TSX sector returns* Dec. Q4 2010 YTD summer when markets finally caught some traction S&P/TSX 3.8% 8.7% 14.4% and moved upward to the end of 2010 (see table 1). The catalyst seemed to be the discussions about, and Energy 7.3% 12.8% 10.0% eventual announcement of, QE2 (another round of Materials 4.4% 14.1% 35.8% quantitative easing and asset purchases by the U.S. Industrials 3.3% 4.3% 14.4% central bank) targeted to boost economic activity and Consumer discretionary 2.7% 6.2% 21.8% recovery. This was soon reinforced by better than Consumer staples 2.6% 4.5% 8.3% expected third quarter corporate earnings and Health care 5.4% 8.8% 50.3% improved economic news out of the U.S. Once on Financials 2.1% 4.0% 6.3% track, the gains were impressive and equity markets Information technology -4.7% 13.1% -11.6% finished off 2010 with a strong rally. Telecom services -1.3% -0.8% 16.2% Utilities 2.3% 3.6% 12.6% THE ROAD TO SUSTAINABILITY *price only This past year, investors concerned themselves with Source: Bloomberg, MSCI Barra, NB Financial, PC Bond, RBC Capital Markets issues of sustainability: Can the U.S. sustain its economic recovery, or While none of these worries have completely gone will it fall back into a double dip recession? away, the later part of 2010 shone a brighter light on Can China sustain its fast-paced growth, or will the ability of countries to overcome these economic asset-bubbles and inflation be its Achilles heel? challenges. Can the European Union sustain the financial pressure of its struggling members, like Greece Bond returns surprised many market watchers during and Ireland? the year, as demand for bonds remained high despite GLC Asset Management Group 1 of 2 January 2011
- 2. the low yields and the significant periods of equity investor confidence tends to favour the “moderate market strength. However, in the last quarter of approach” when it comes to monetary policy. 2010, the improving economic picture did create a drag on bond prices, and the steady inflow of MATERIAL GAINS investors seeking the safety of fixed-income softened. Taking a closer look at the Canadian S&P/TSX in Overall, however, the results for the year were very 2010 (see table 2), we see the impressive results of respectable for fixed-income investors. the Materials sector – truly a driving force for the Canadian equity market this past year. As concerns North American equity markets managed some of the of a double-dip recession in the U.S. faded, the global strongest 2010 returns, thanks to strong earnings economic outlook improved and commodity prices results from corporations. This highlights that rallied. Precious metals, fertilizer products and base companies have cleaned up their balance sheets and metals all had very strong results in 2010, boosting have more or less fully recovered from the financial the commodity-heavy S&P/TSX, and adding to the crisis – a positive sign towards the eventual pick-up in appeal of our Canadian dollar. Stepping back further, employment. Likewise, the American consumer we can see that the cyclical sectors (like Energy and gradually showed signs of renewed life as evidenced Materials) were stronger than the defensive sectors by improved consumer spending. The good news on (like Utilities, Financials and Consumer Staples), and the U.S. front was quickly translated to good news for smaller companies (measured by capitalization size) Canada, improving our outlook for exports and for outperformed larger companies by a significant commodity demand in general. margin in 2010. Both results highlight that investors became more and more comfortable with taking on THE DRAGON AND THE PIIGS riskier assets in the improving economic environment. European markets on the other hand had a much more difficult time in 2010. Ongoing struggles with MAKING THE BEST OF A ROCKY ROAD sovereign debt continued to surface. As negative Looking forward into 2011, we believe the long-term headlines about Greece faded, worries over Ireland outlook for equity markets is reasonably optimistic, and the other peripheral countries (Spain, Italy, supported by strong corporate earnings, and an Portugal) emerged, disrupting investor confidence for improving situation for U.S. consumers and the U.S. much of 2010. However, as the year unfolded and economy (still a driving force for global economic the European Union dealt with each country’s crisis, health). Having said that, we do expect volatility to the challenges proved not to be game changers for remain high, making it important for investors to overall global growth - helping to ease investors’ consider the benefits of taking a long-term and concerns going into 2011. diversified approach to their portfolios. Why? Because investing can be like a bowl of Rocky Road The focus for emerging market economies continues ice cream; rarely do you get a spoon full of just plain to be squarely on China. Markets responded with vanilla or only pure chocolate. Instead, plan for a mix volatility to worries that the Chinese government of both with a few marshmallows to get you excited, would be too slow, or worse, too heavy-handed in and a few nuts thrown in just to keep it interesting! their efforts to moderate growth and avoid a housing market bubble and/or run-away inflation. Consider that China’s emergence as a major economic world player is still in its early stages (relatively speaking), with little precedents on how the Chinese government is likely to proceed in managing their fast growing economy. While the debate will no doubt rage on in 2011, China appears to be pursuing a moderate approach to tightening lending standards – and Copyright GLC, You may not reproduce, distribute, or otherwise use any of this article without the prior written consent of GLC Asset Management Group The views expressed in this commentary are those of GLC Asset Management Group Ltd. (GLC) as at the date of publication and are subject to change without notice. This commentary is presented only as a general source of information and is not intended as a solicitation to buy or sell specific investments, nor is it intended to provide tax or legal advice. Prospective investors should review the offering documents relating to any investment carefully before making an investment decision and should ask their advisor for advice based on their specific circumstances. GLC Asset Management Group 2 of 2 January 2011