Downloaded 47 times
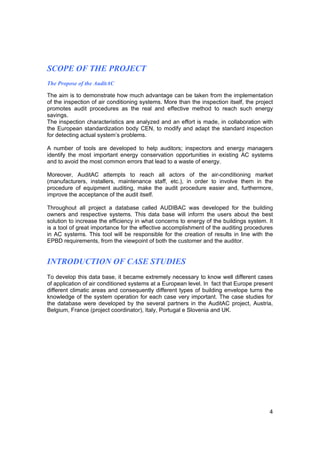

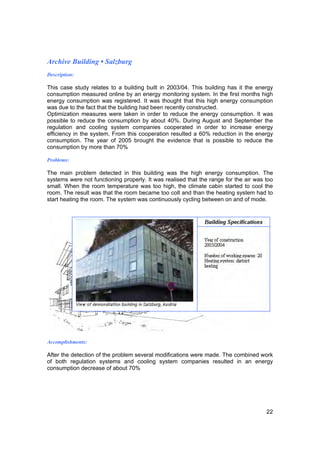
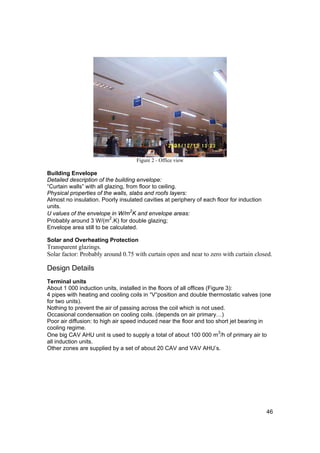
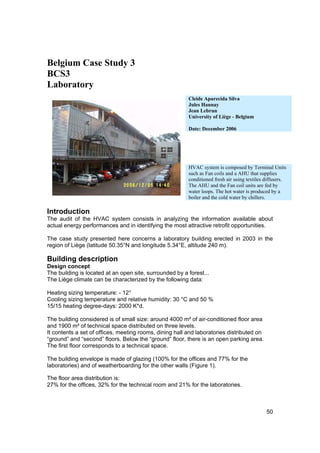
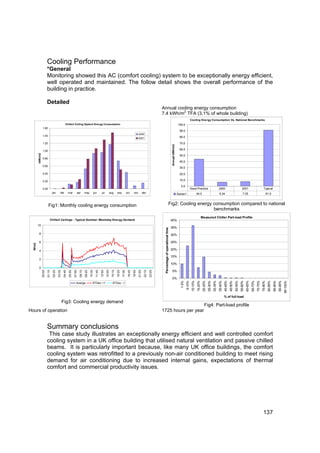
![Office Building • Maribor
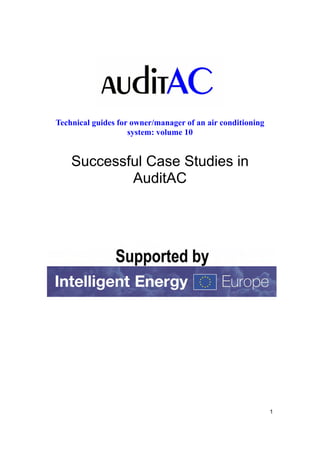
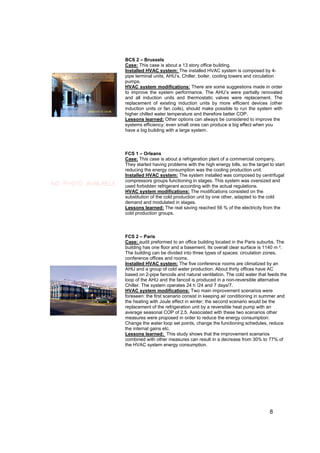
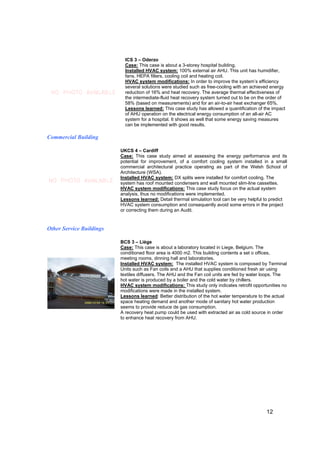
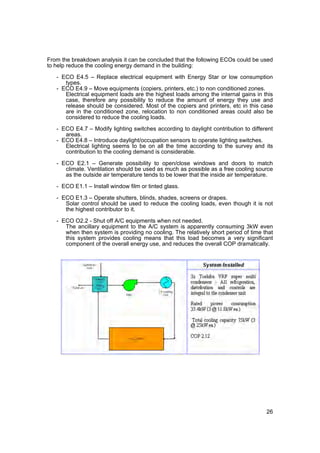
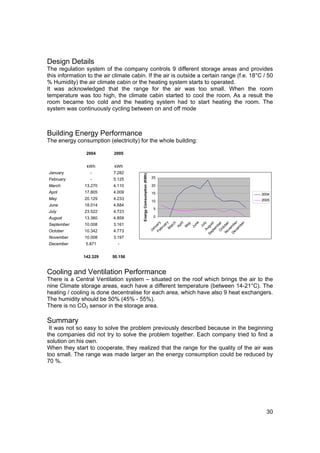
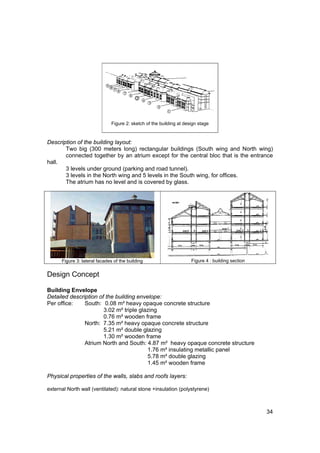
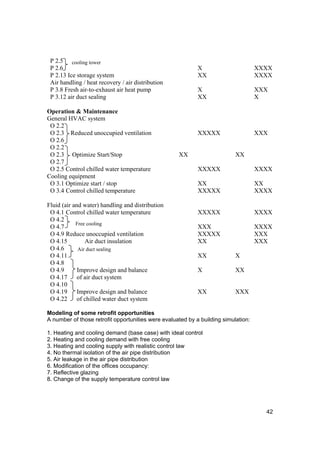
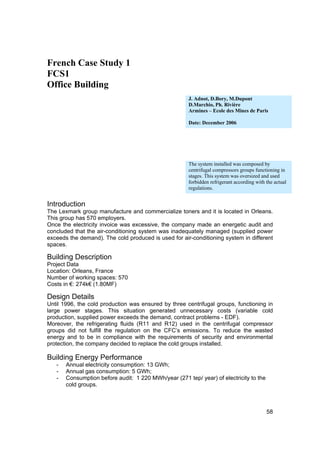
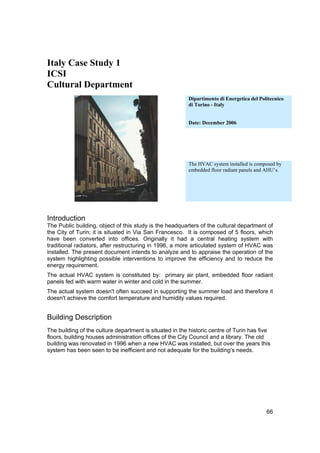
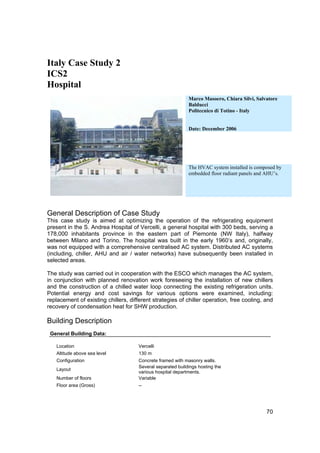
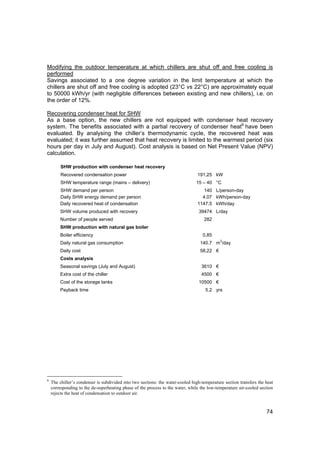
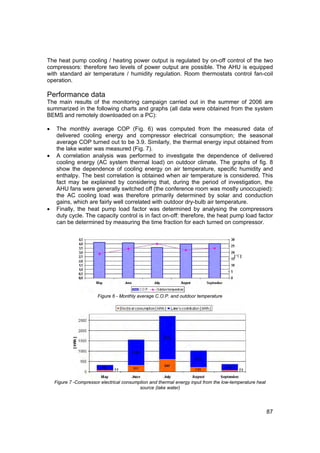
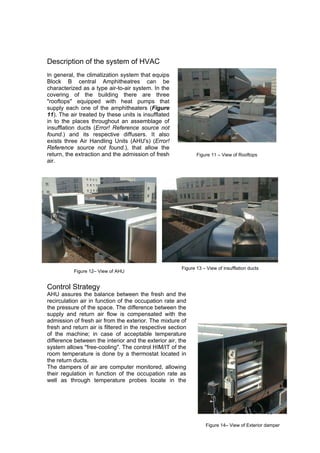
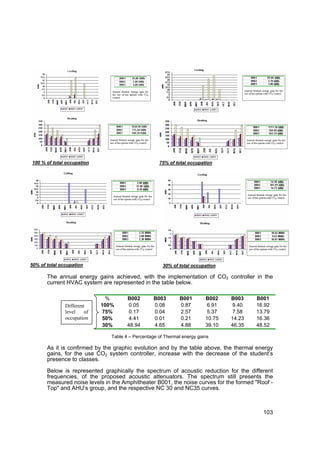
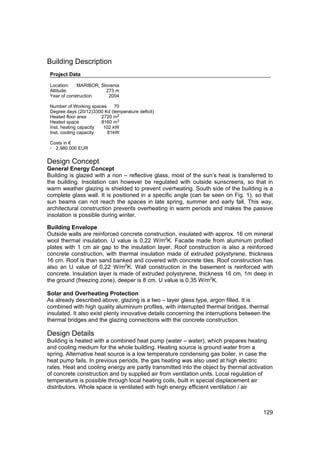
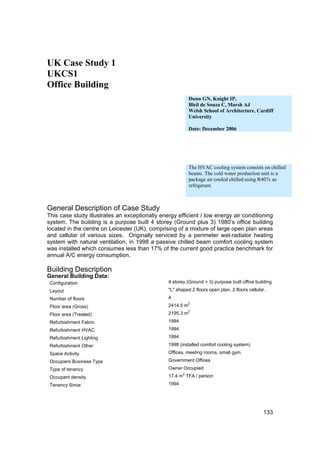
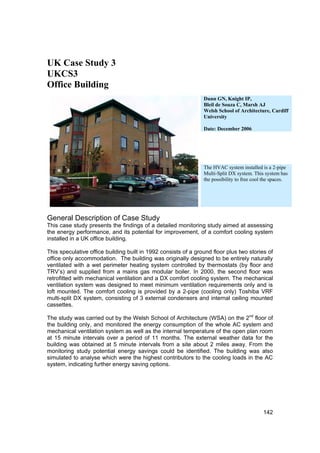
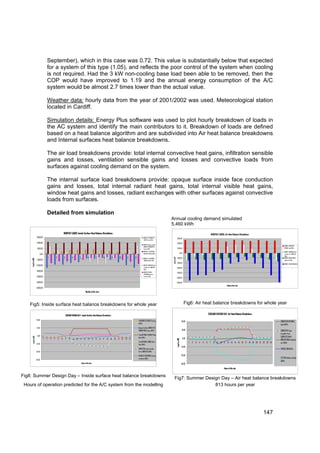
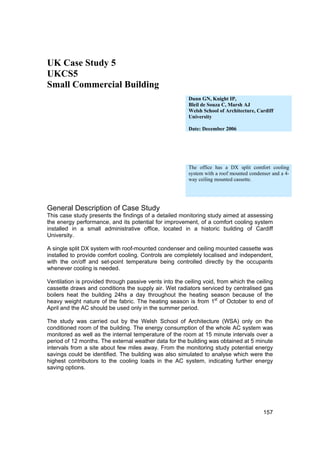
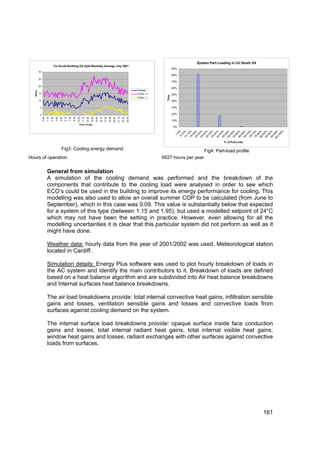
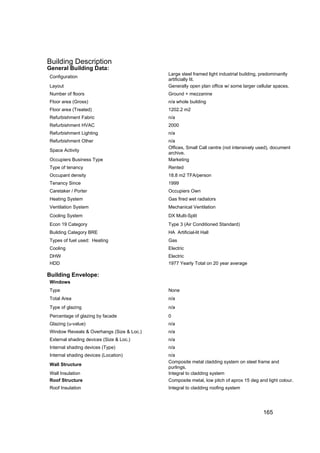
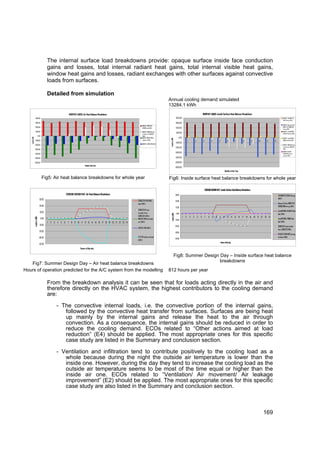
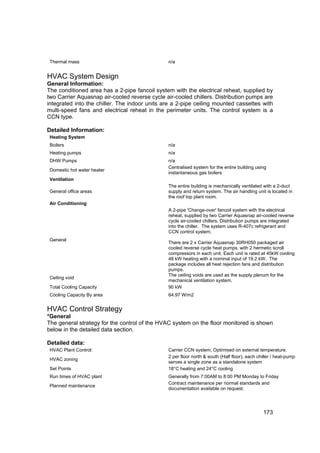
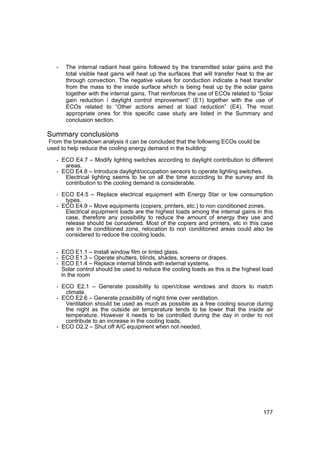
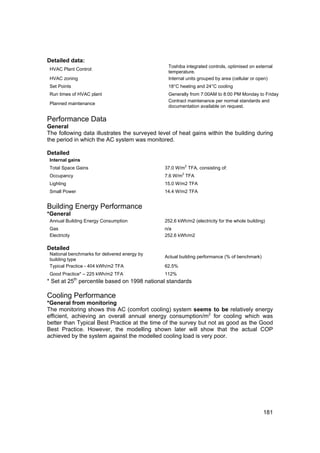
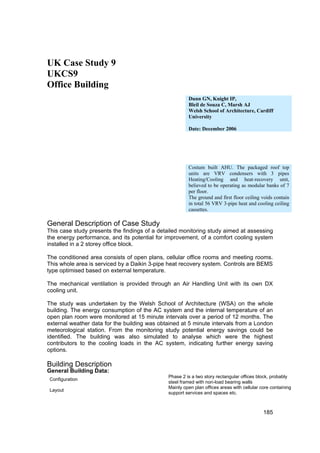
The energy system of an office business building is presented, where at minimal energy
consumption, optimal working conditions are achieved. The investment costs are in the
same range as the investment costs for a traditional building. Building is heated with a
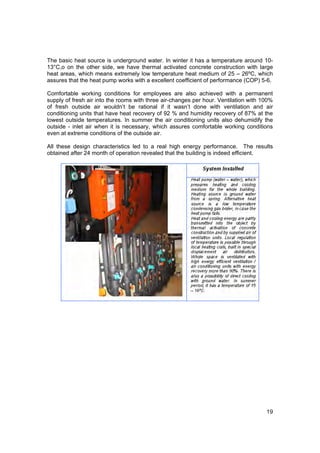
combined heat pump (water – water), which prepares heating and cooling medium for
the whole building. Heating source is ground water from a spring. Heat and cooling
energy are partly transmitted into the object by thermal activation of concrete
construction and by supplied air of ventilation units. Local regulation of temperature is
possible through local heating coils, built in special displacement air distributors. Whole
space is ventilated with high energy efficient ventilation / air conditioning units with
energy recovery more than 90%.
Problems
There are no problems reported for this building. In fact, this case study aims to report
that is possible to combine technology, comfort and reasonable expenses.
Accomplishments:
As said, the building was designed to achieve high energy performance thus reducing
the energy consumption. This global goal was approached by several sides: the building
envelope [sun exposure and wall and glazing materials] and the HVAC systems
installed.
The glazing is a two – layer glass type, argon filled. It is combined with high quality
aluminium profiles, with interrupted thermal bridges, thermal insulated. There is also a lot
of innovative details of interruption of thermal bridges at connections glazing to concrete
constructions.
Performance of the cooling system is optimized for lowest possible energy consumption.
Big amount of sensible heat is cooled with thermal activation of concrete construction it
goes on large surface area, which means high cooling medium temperature – low
energy consumption.
18](https://image.slidesharecdn.com/auditactg10casestudies-120120080701-phpapp01/85/Auditac-tg10-case-studies-18-320.jpg)
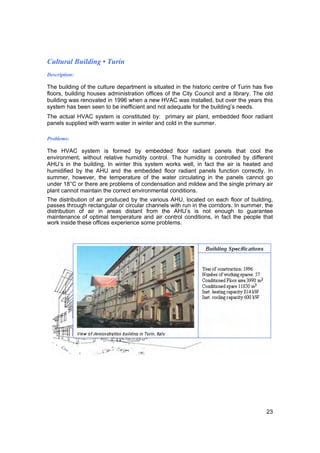
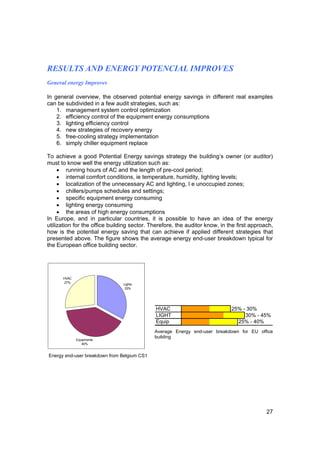
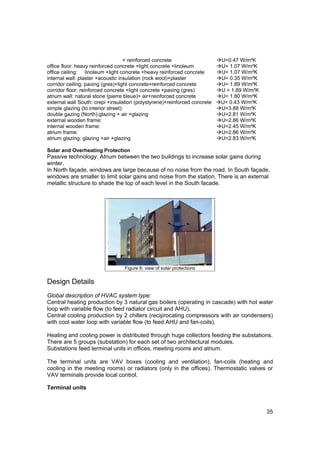
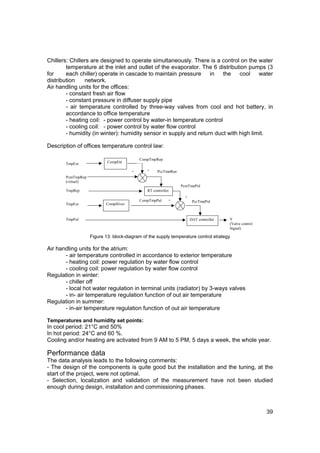
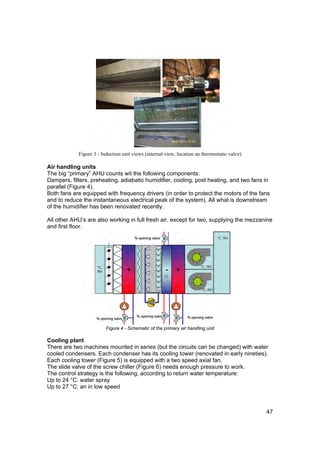
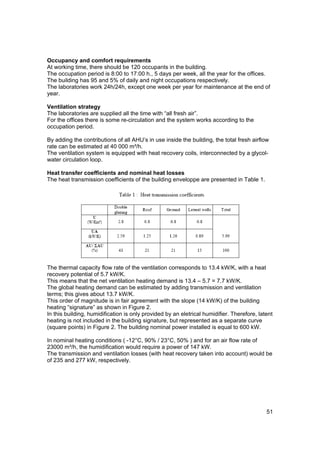
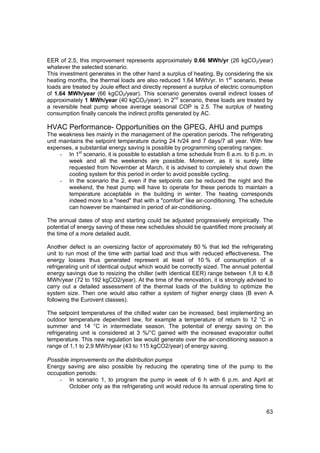
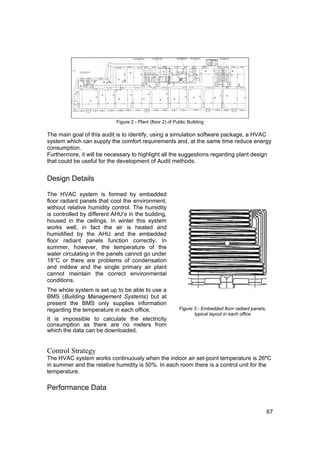

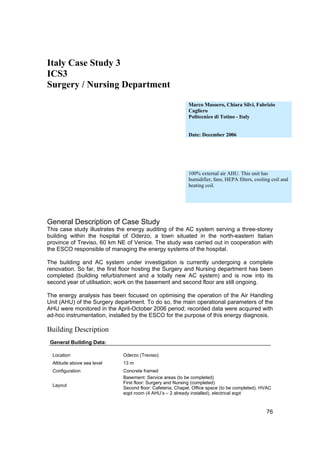
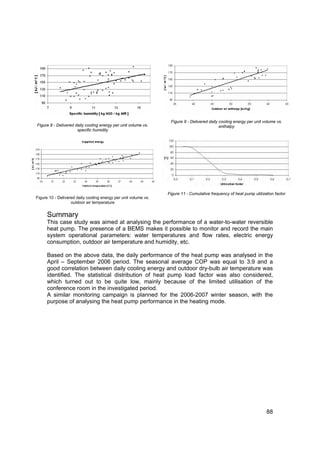
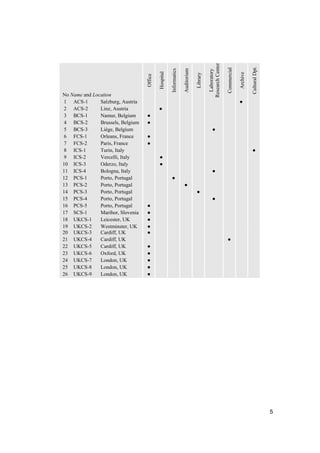
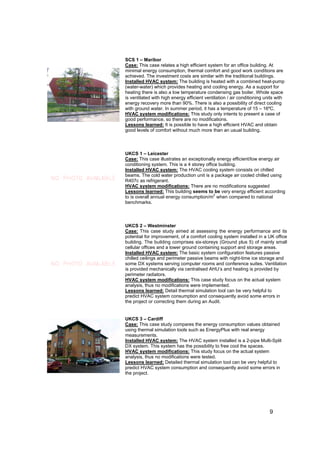
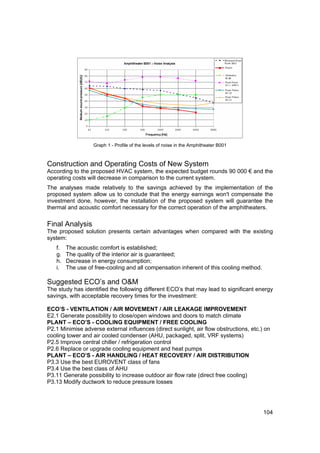
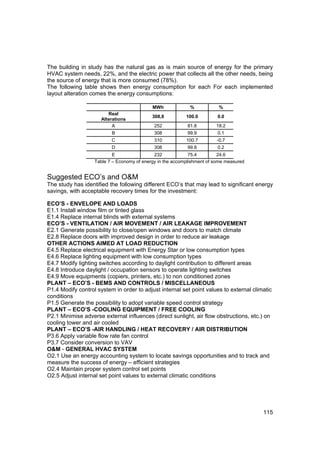
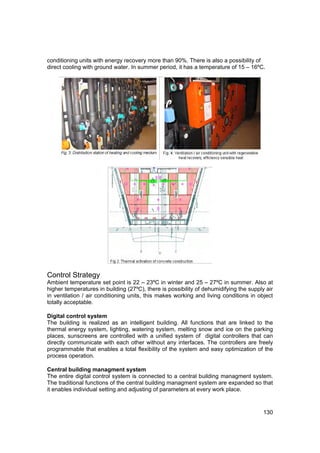
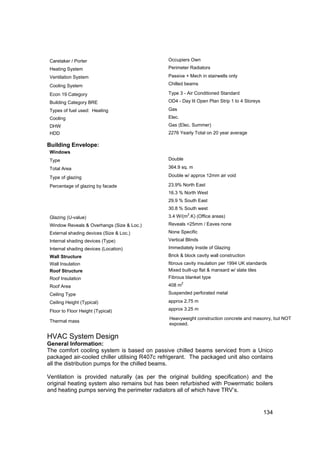
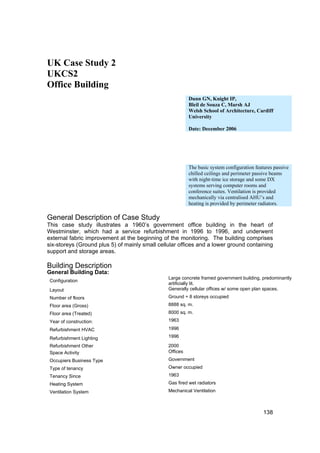
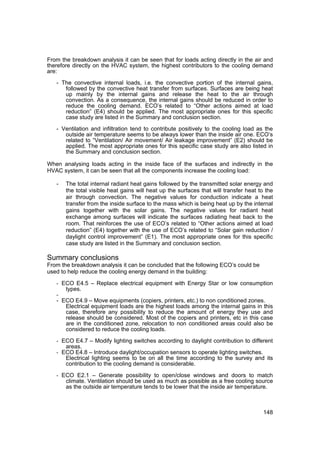
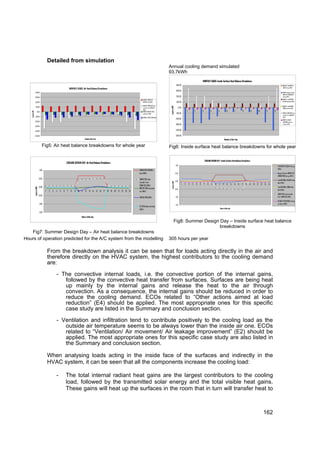
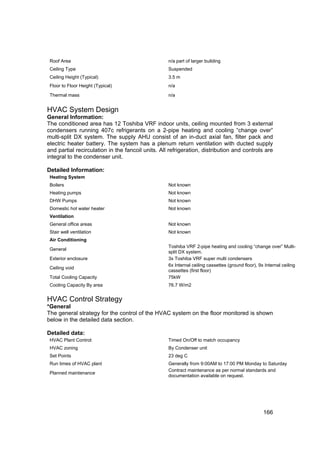
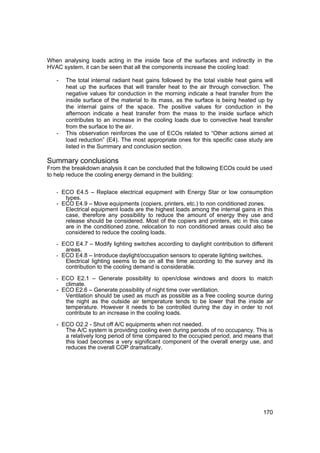
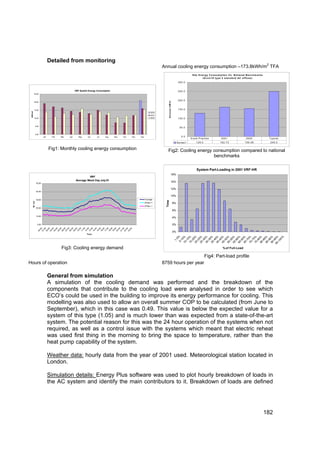
![Design Details
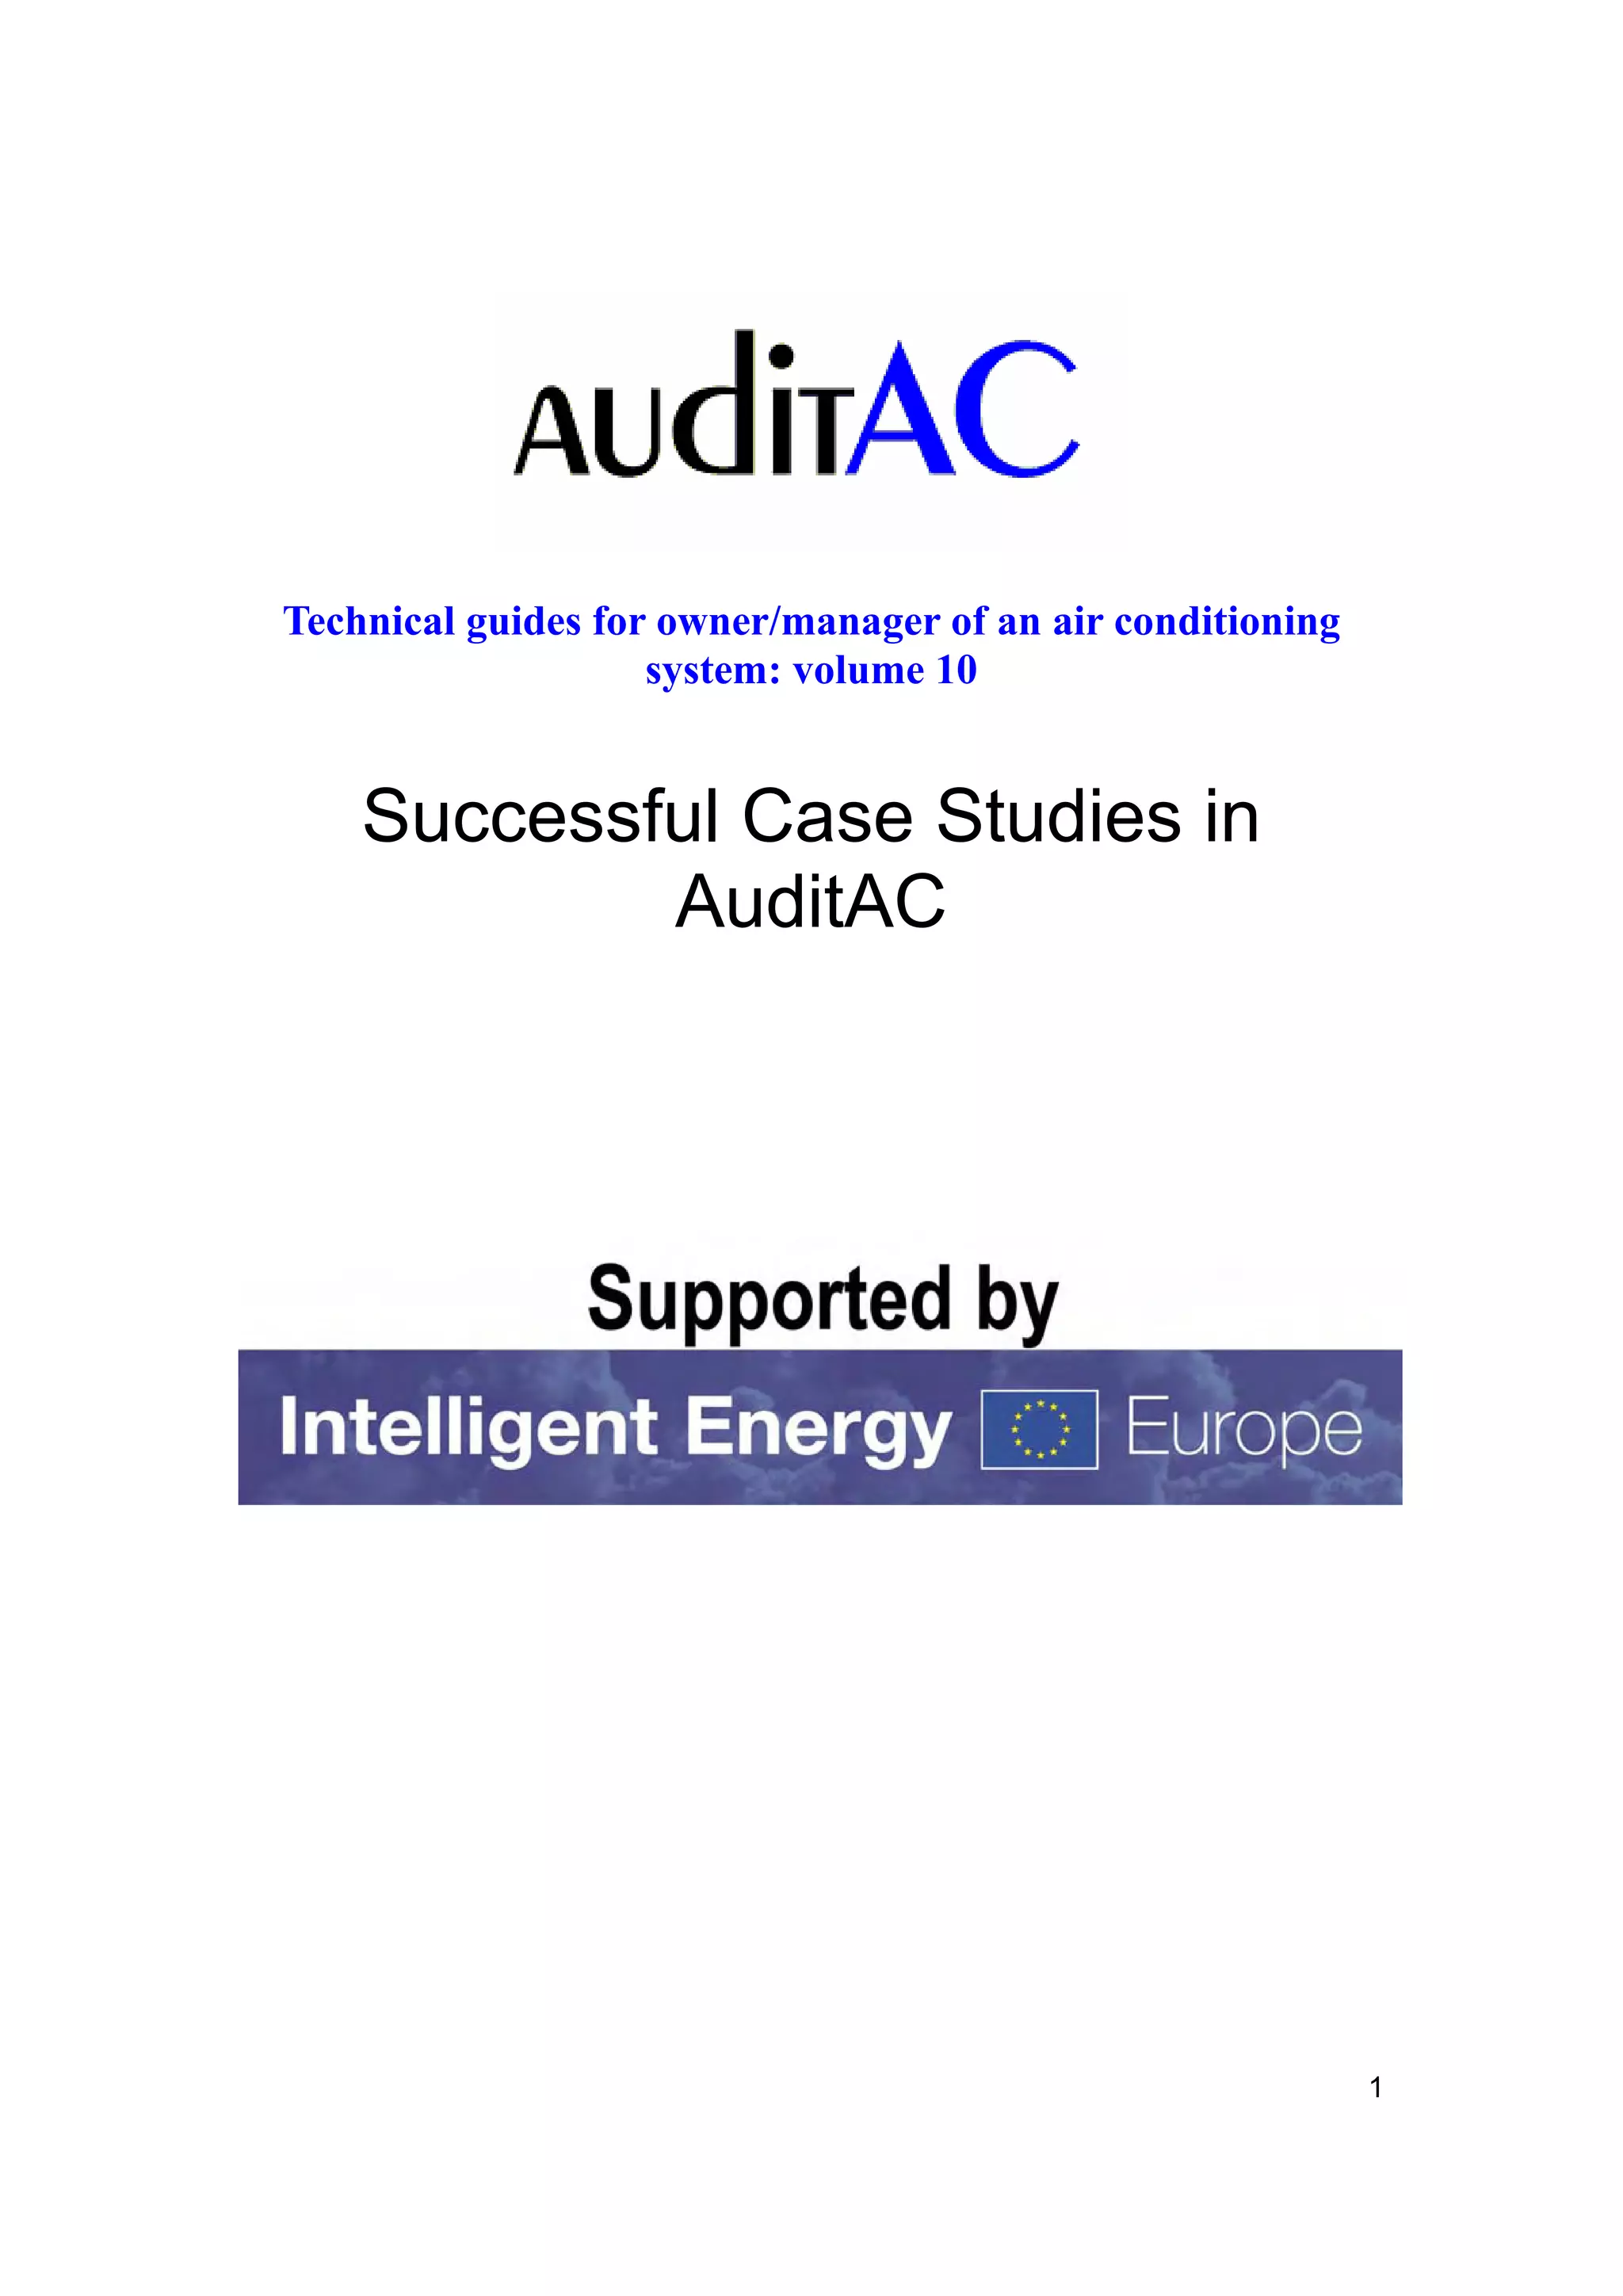
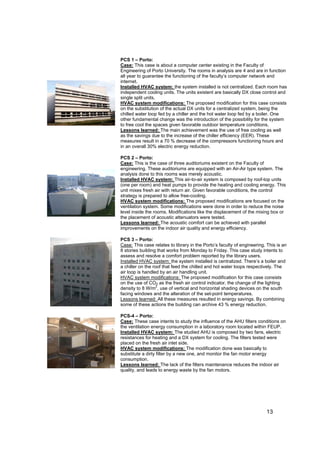
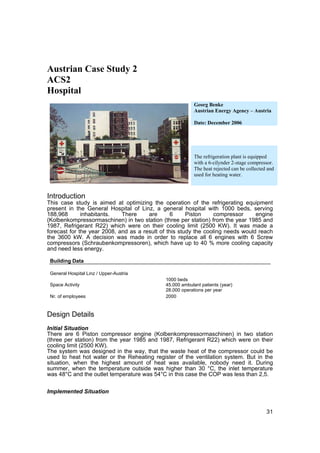
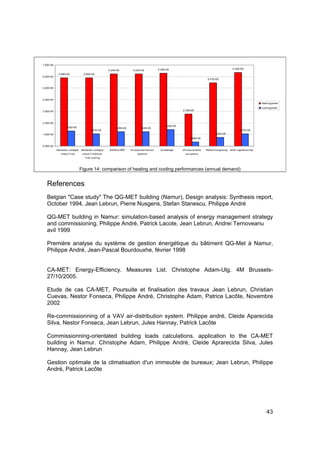
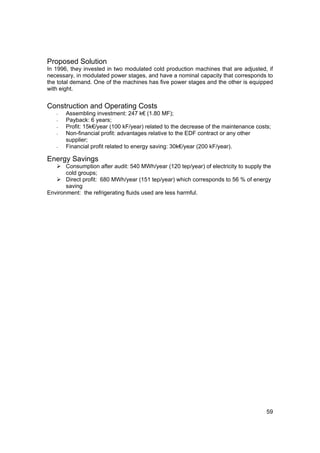
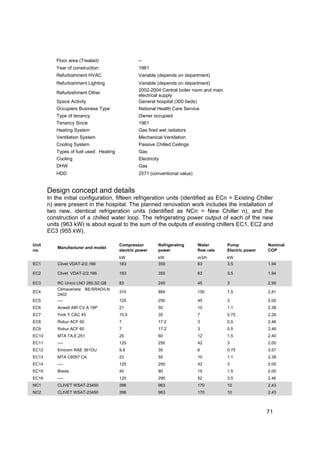
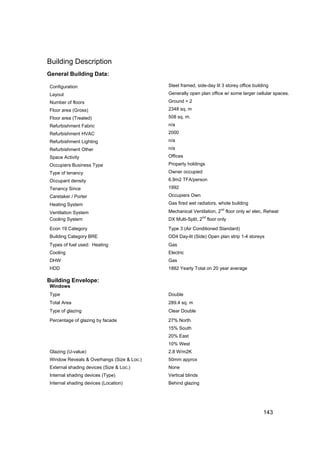
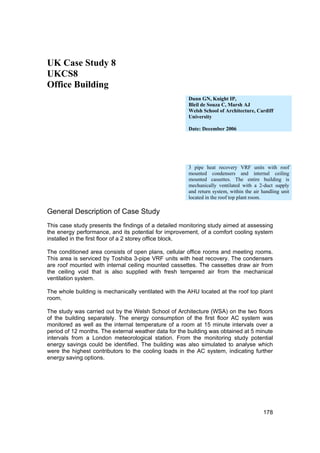
The HVAC system installed in below grade floor of
CICA building is an all refrigerant system, where,
all units work with R22 refrigerant. In D-102 and D-
104 rooms, there are ceiling splits with 5 kW of
cooling power, connected to the condenser units
installed in the building’s rooftop, Error! Reference
source not found.. The rooms, D-101, D103 and D-
104 are equipped with close control units; one unit
in the first two places and two units in the last one,
Error! Reference source not found., an individual
condensing outdoor unit is also located in the
building rooftop. The Close control units allow
humidity control inside the spaces.
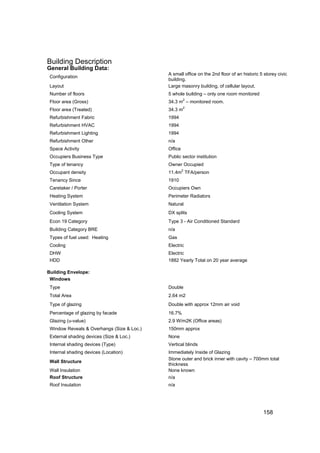
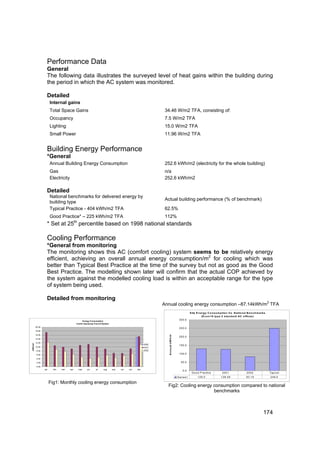
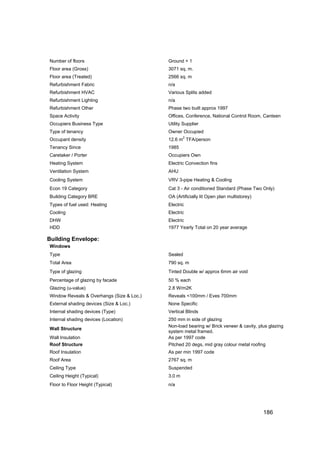
Figure 2 - Schematic of the ventilation
systems distribution
Figure 2 illustrates the functionality of the close
control units installed in the different zones where
reheated /re-cooling air is supply by grids under
the floor.
Figure 3 - Schematic of the close control Figure 4 - Schematic of the condensers existing in the building rooftop
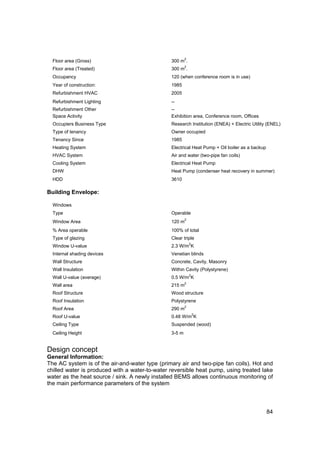
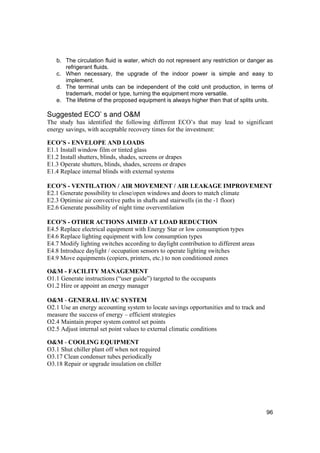
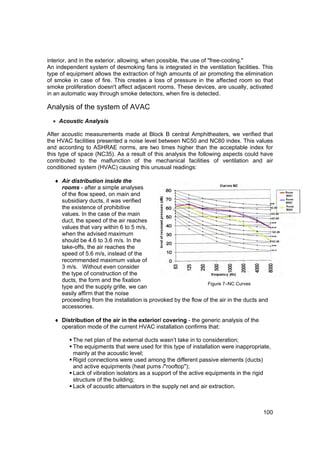
Building envelope
The table below shows the configuration of the building envelope.
External wall e [m] λ [W/mºK]] cp [J/kgºK] ρ [kg/m3] U [W/m2K]
Gypsum 0.015 1.150 837.0 1950.0
Concrete 0.220 1.750 1080.0 2200.0
0.683
Polystyrene 0.040 0.035 1250.0 32.5
Gypsum 0.015 1.150 837.0 1950.0
Internal wall e [m] λ [W/mºK]] cp [J/kgºK] ρ [kg/m3] U [W/m2K]
Gypsum 0.020 1.150 837.0 1950.0
Brick 0.150 1.750 1080.0 2200.0 1.833
Gypsum 0.020 1.150 837.0 1950.0
Internal floor e [m] λ [W/mºK]] cp [J/kgºK] ρ [kg/m3] U [W/m2K]
Linoleum 0.003 0.169 1000.0 1000.0
1.490
Light Slab 0.450 0.931 965.0 1320.0
91](https://image.slidesharecdn.com/auditactg10casestudies-120120080701-phpapp01/85/Auditac-tg10-case-studies-91-320.jpg)
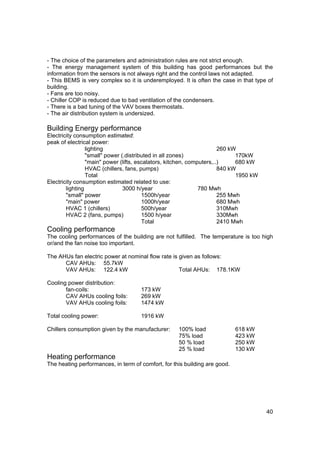
![Ceiling e [m] λ [W/mºK]] cp [J/kgºK] ρ [kg/m3] U [W/m2K]
Plaster 0.050 0.220 1085.0 1680.0 2.517
External floor e [m] λ [W/mºK]] cp [J/kgºK] ρ [kg/m3] U [W/m2K]
Linoleum 0.003 0.169 1000.0 1000.0
Concrete 0.200 1.750 1080.0 2200.0 0.692
Polystyrene 0.040 0.035 1250.0 32.5
False floor e [m] λ [W/mºK]] cp [J/kgºK] ρ [kg/m3] U [W/m2K]
Linoleum 0.003 0.169 1000.0 1000.0
Agglomerated 0.030 0.056 1000.0 300.0 1.374
Aluminium 0.001 200.000 3430.0 2700.0
Table 2 – Building envelope constitution
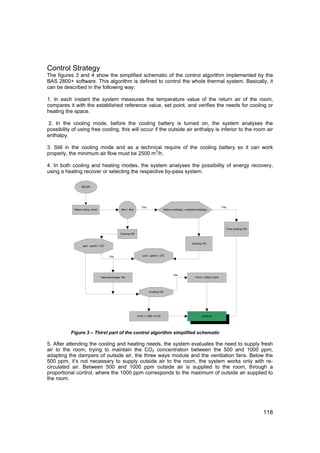
Control Strategy
The HVAC system works in continuous throughout the year where the indoor air set-
point temperature is 25ºC and the relative humidity is 50%. Each close control unit
performs the specified set-point of the air conditioning space.
Control strategy
set-point schedule
Close control 24ºC 24h
Split units 19ºC - 23ºC 9h - 18h
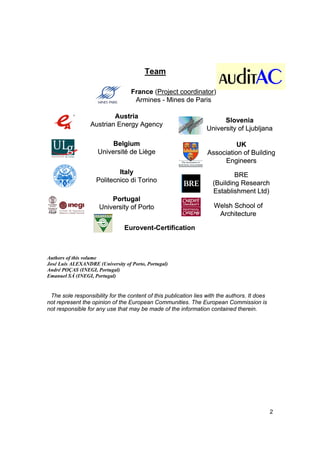
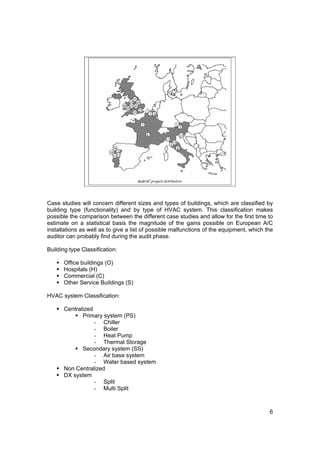
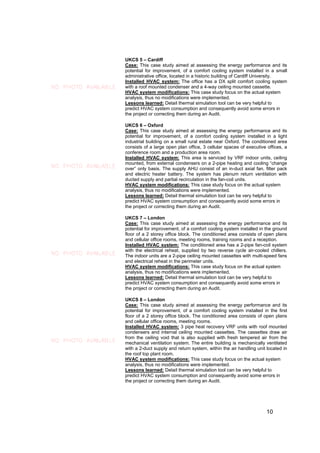
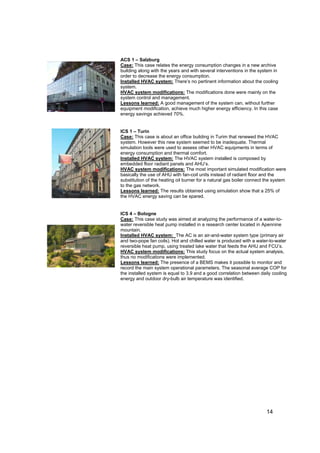
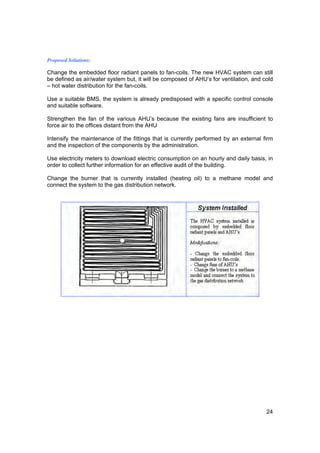
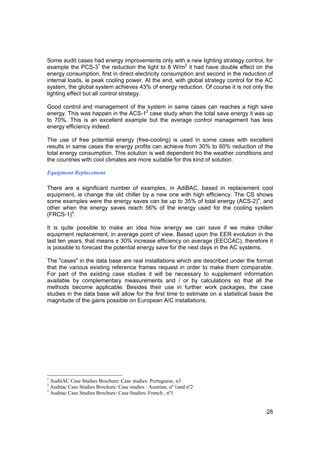
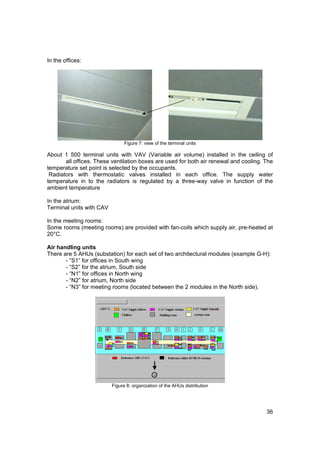
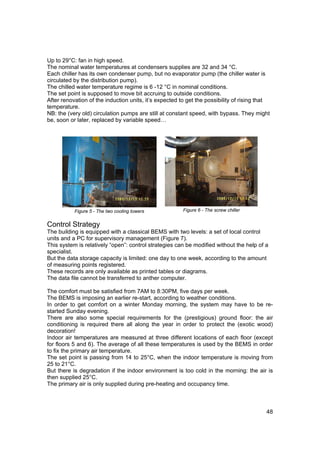
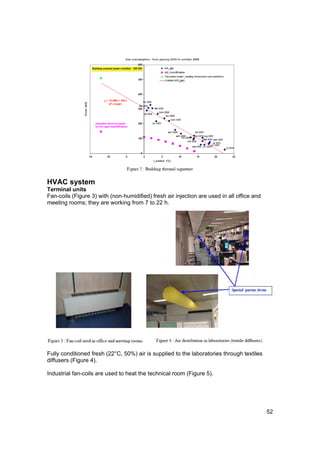
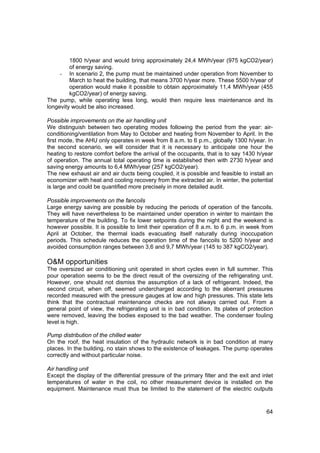
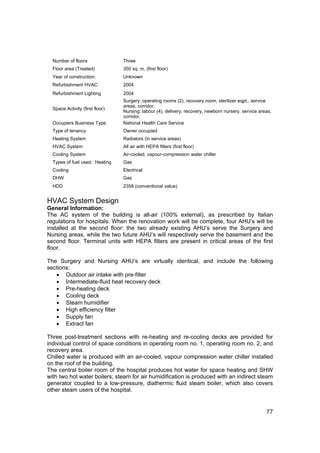
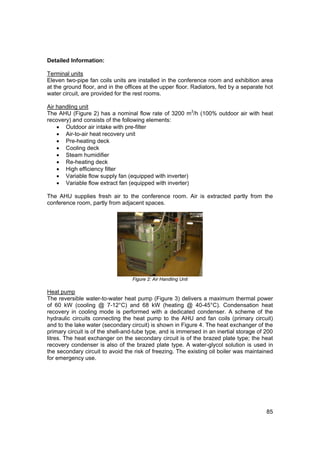
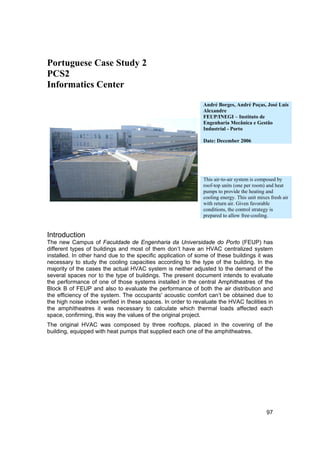
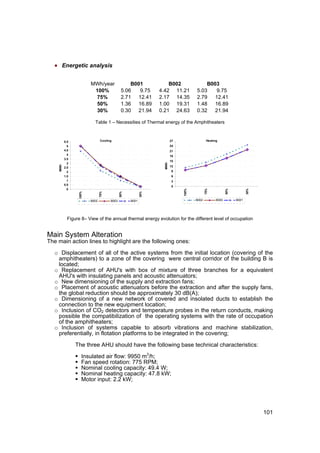
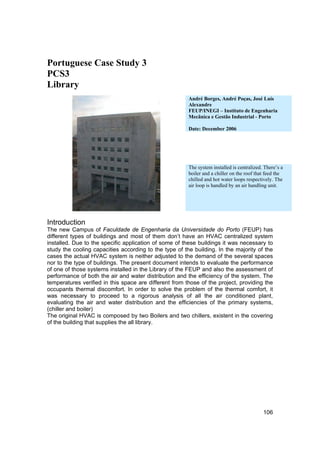
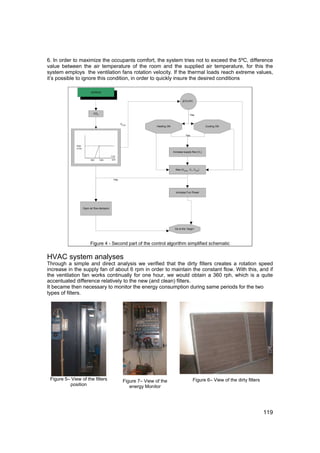
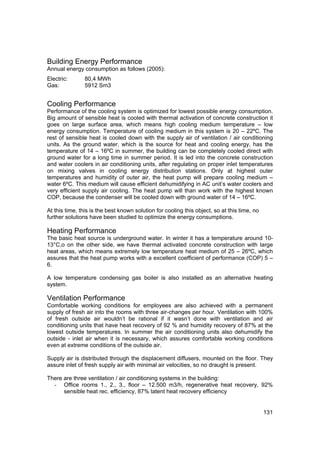
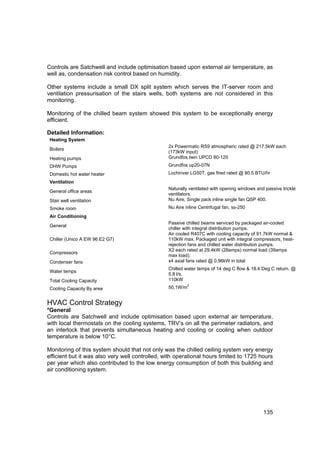
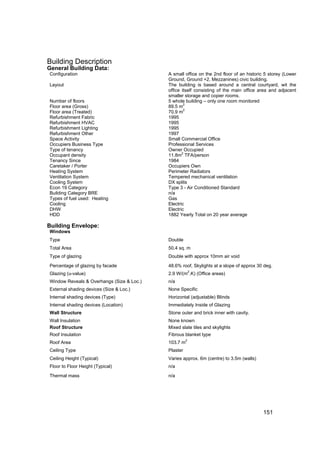
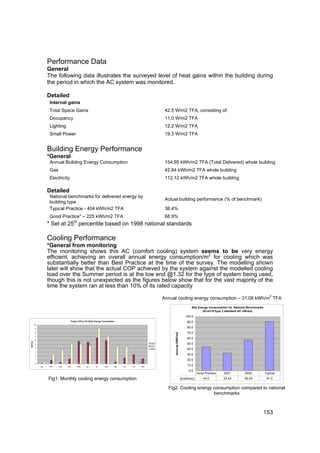
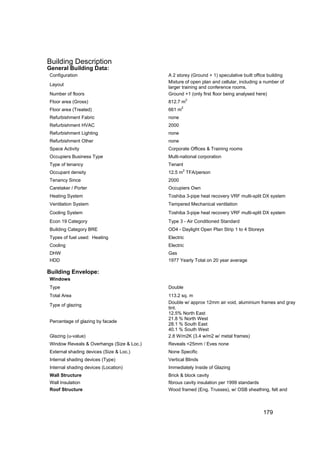
Performance Data
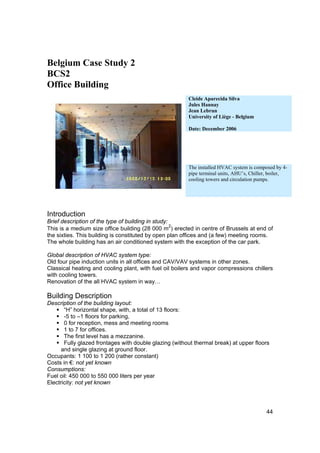
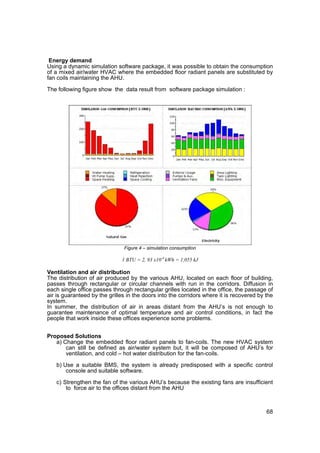
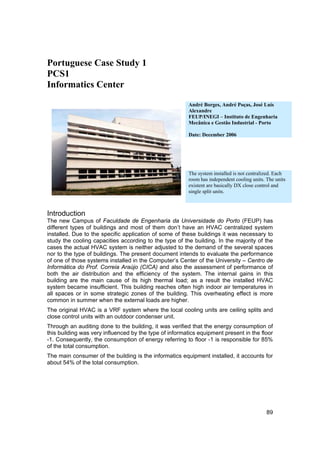
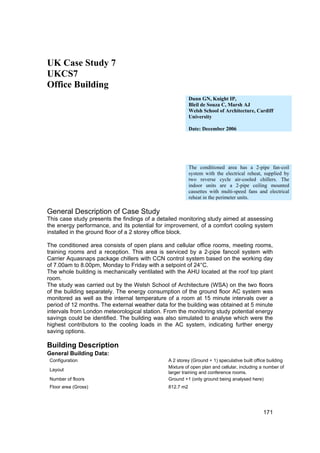
Cooling demand
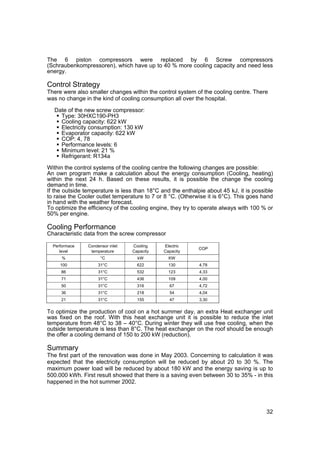
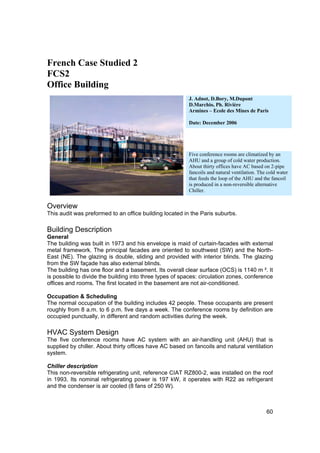
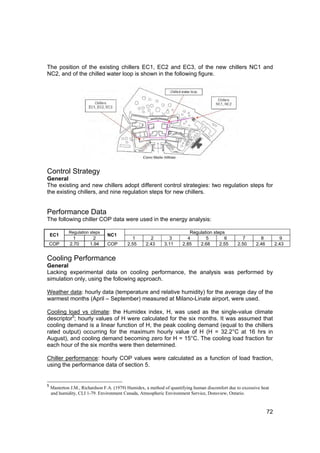
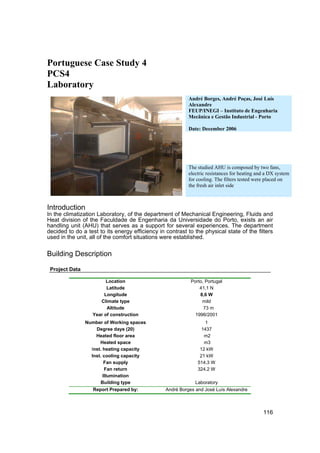
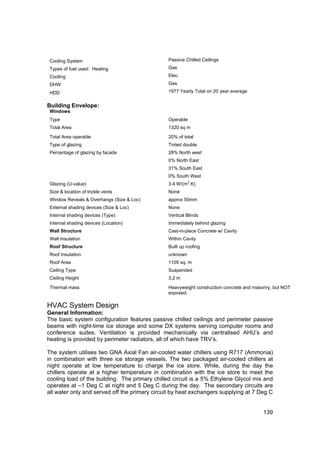
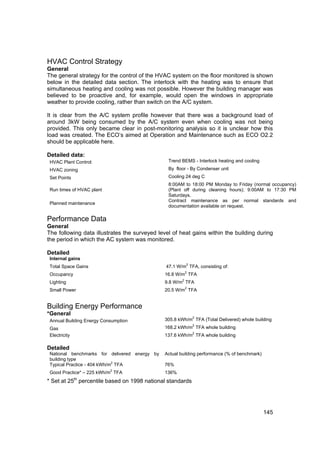
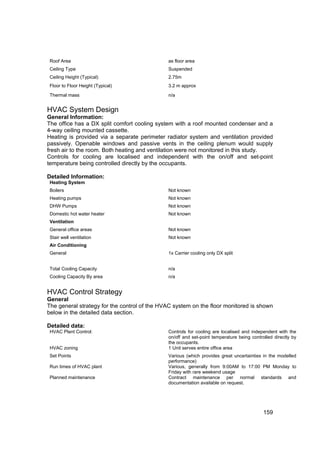
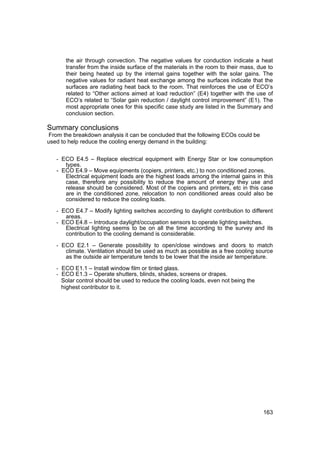
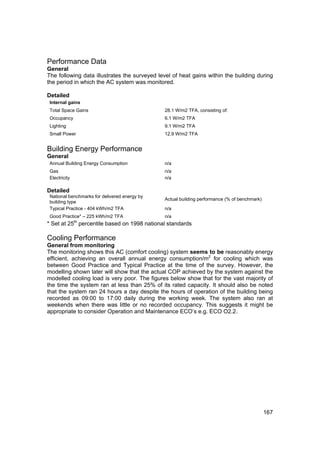
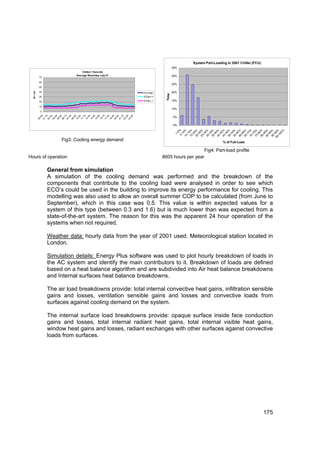
Using a dynamic simulation software package, it was possible to obtain the cooling loads
for each space.
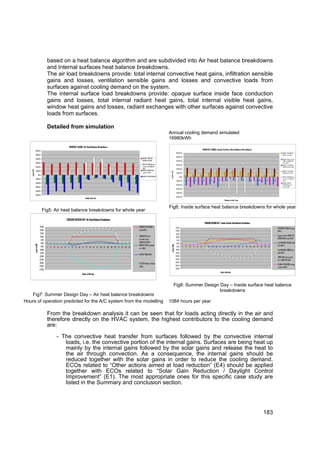
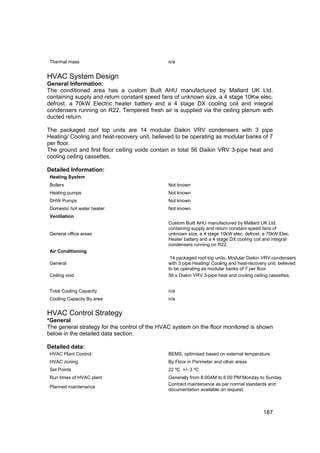
Figure 5 shows the results of the simulation for cooling demand and the sensible cooling
load of the installed systems.
25
20
15
kW
10
5
0
D -101 D -102 D -103 D -104
Installed capacity Sensivel load
Figure 5 – Sensible cooling load
As shown above in figure 6 the installed cooling powers inside the analyzed spaces are
not enough to remove the thermal load, which justifies the overheating that sometimes
occurs.
92](https://image.slidesharecdn.com/auditactg10casestudies-120120080701-phpapp01/85/Auditac-tg10-case-studies-92-320.jpg)
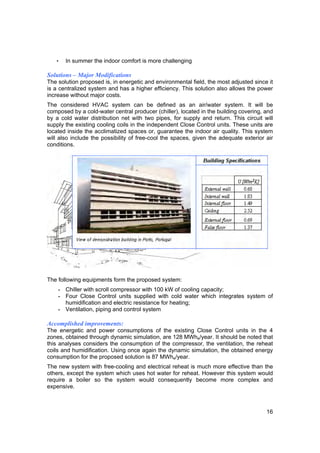
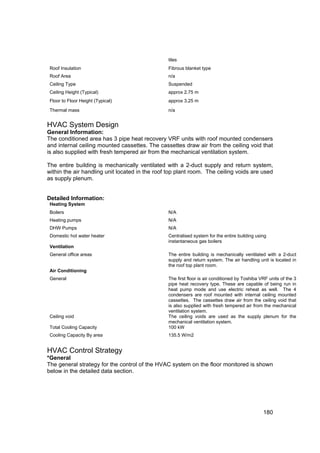
![The considered HVAC system can be defined as an air/water system. It will be
composed by a cold-water central producer (chiller), located in the building covering, and
by a cold water distribution net with two pipes, for supply and return. This circuit will
supply the existing cooling coils in the independent Close Control units. These units are
located inside climatized spaces or, if not possible, near them. An adequate ventilation
system can also be installed to guarantee the indoor air quality. This system will also
include the possibility of free-cooling the spaces, given adequate exterior air conditions.
The following equipments form the proposed system:
- Chiller with scroll compressor with 100 kW of cooling capacity;
- Four Close Control units supplied with cold water which integrates system of
humidification and electric resistance for heating;
- Ventilation, piping and control system…
Performance data
These spaces are characterized by its high internal gains, as shown bellow
Zone UPS -101 FCCN -102 Servers -103 Networks-104
Equipment gains [kW] 6,4 4,6 20,7 13,57
Light gains [W] 108 144 288 288
Occupancy - - - -
2
Overall internal gains [kw//m pav] 0,42 0,15 0,42 0.30
Table 3 – Internal gains
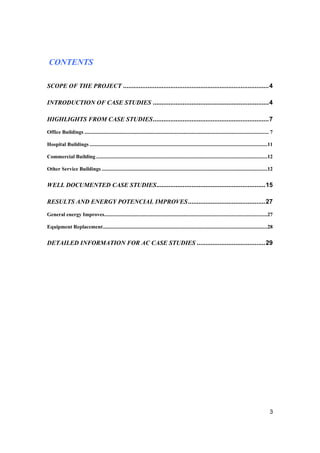
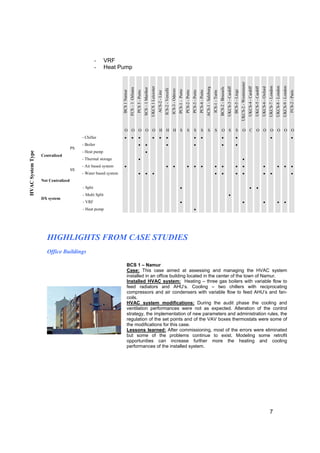
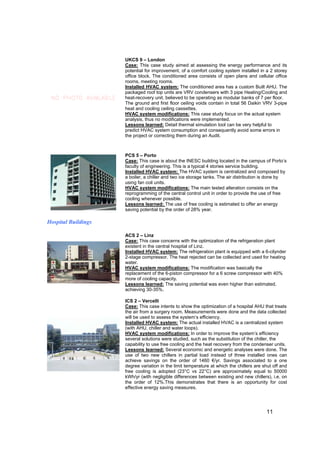
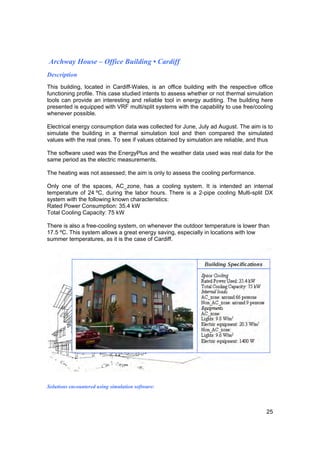
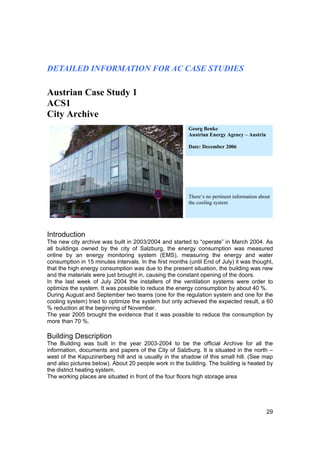
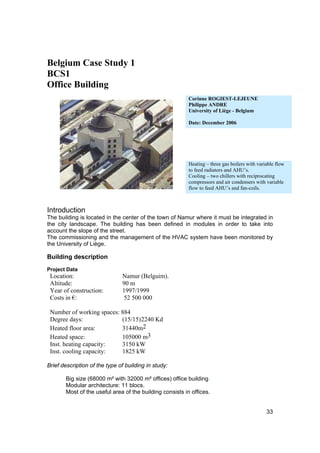
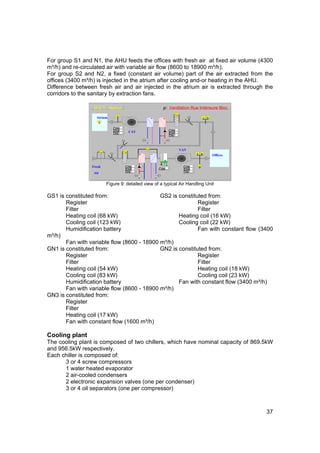
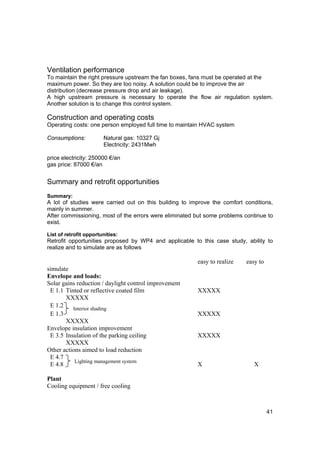
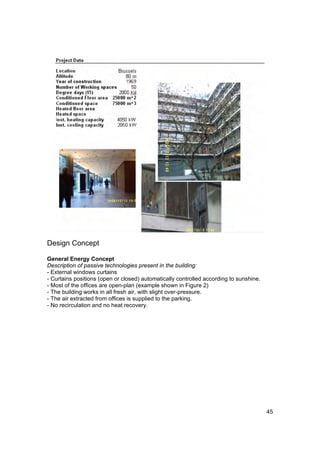
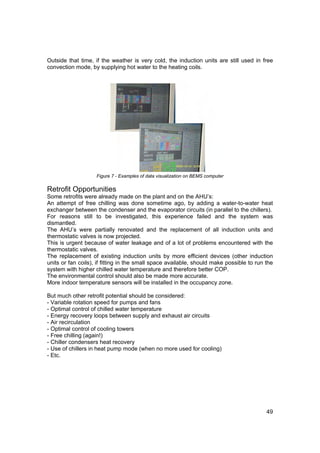
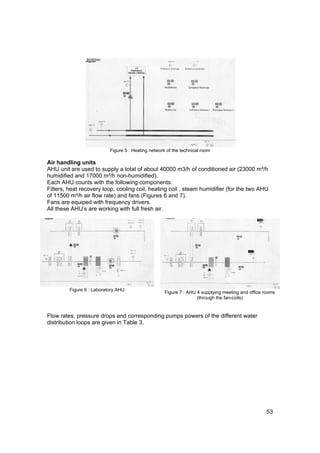
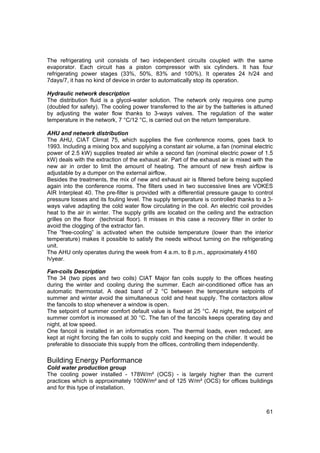
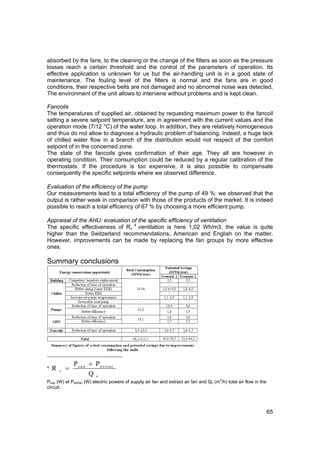
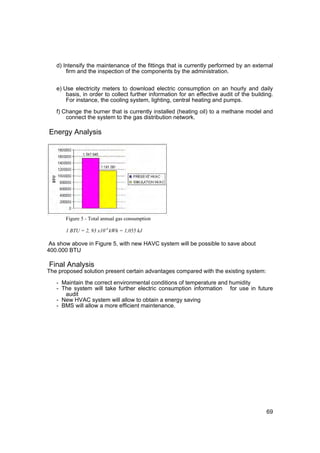
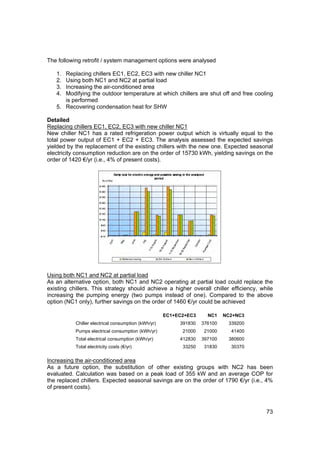
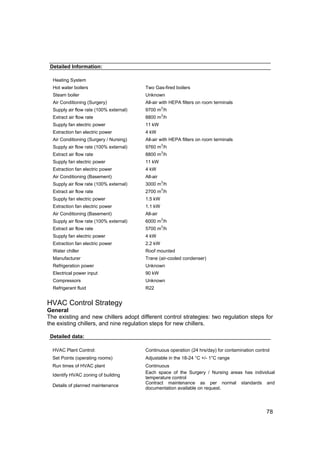
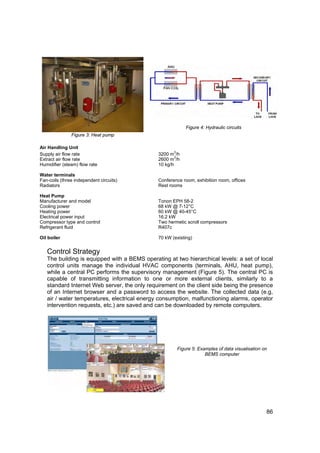
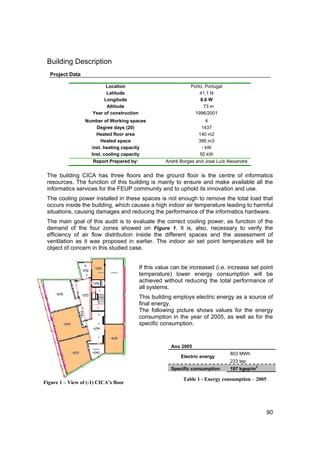
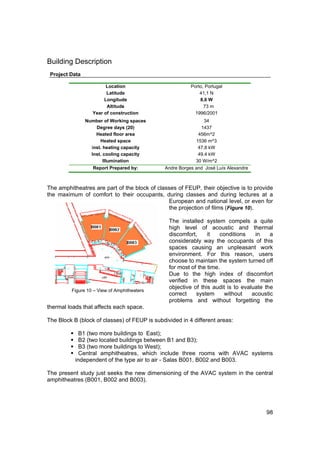
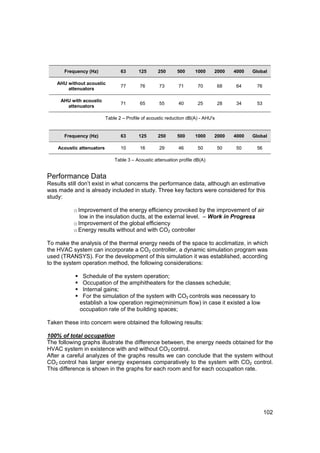
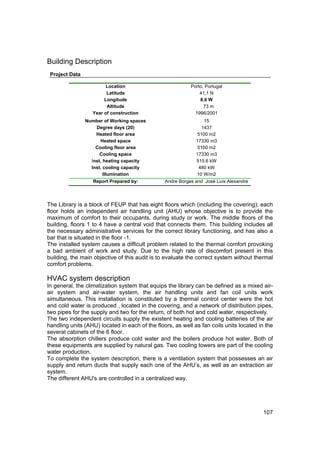
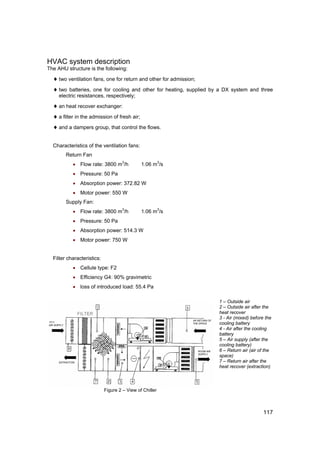
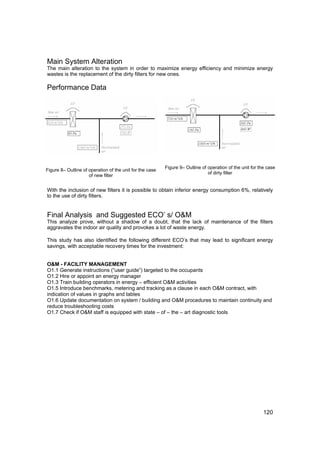
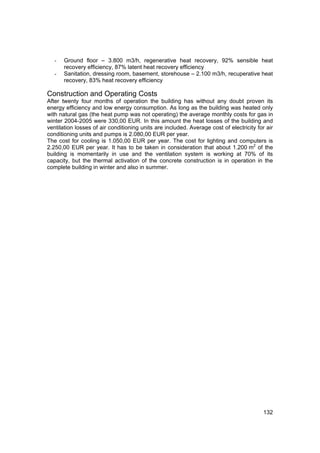
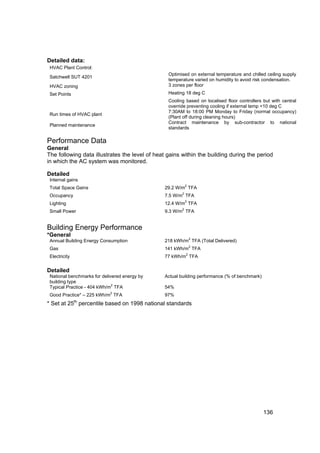
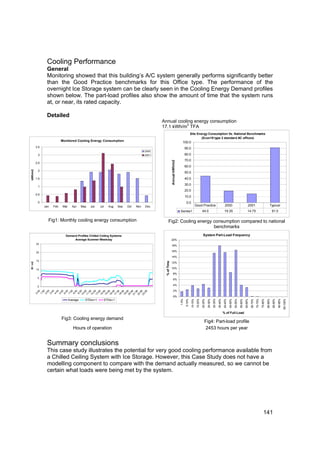
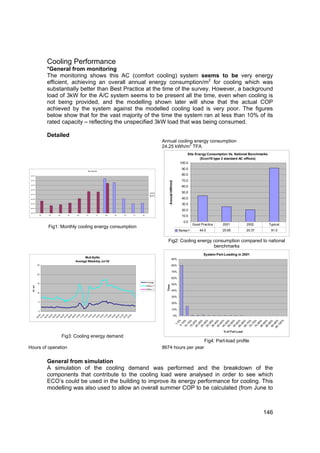
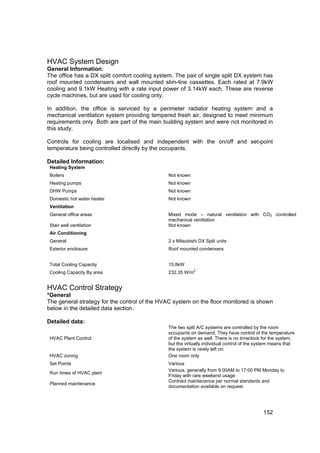
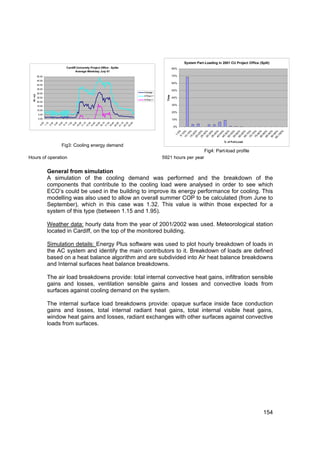
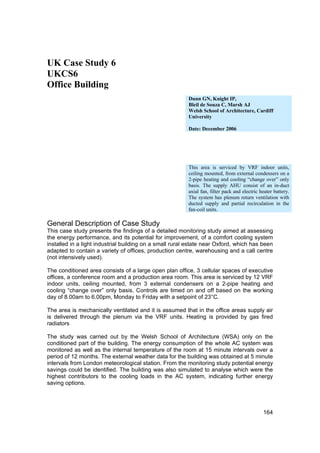
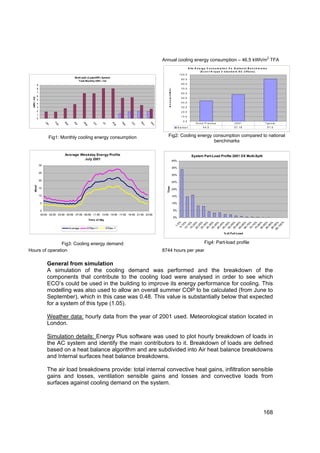
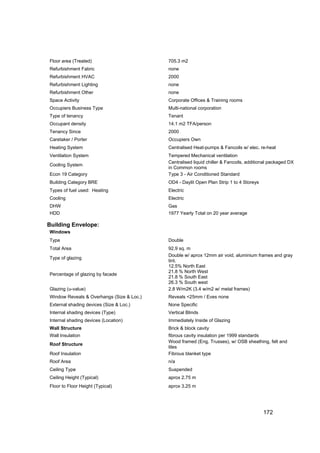
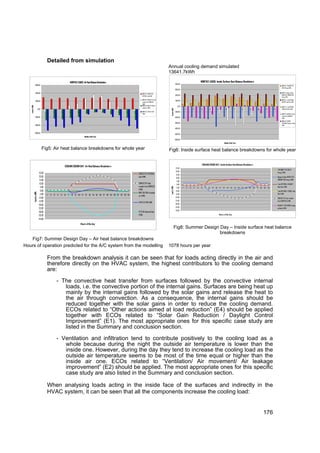
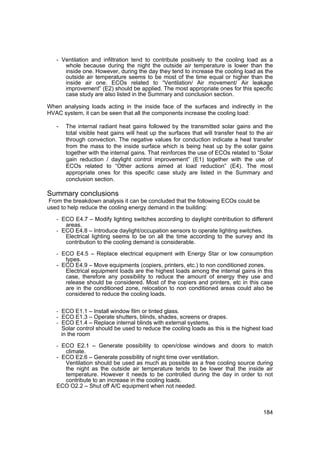
Energetic Analysis
The energetic and power consumptions of the existing Close Control units in the 4
zones, was obtained through dynamic simulation, was 128 MWhe/year. It should be
noted that this analyses considers the consumption of the compressor, the ventilation,
the reheat coils and humidification.
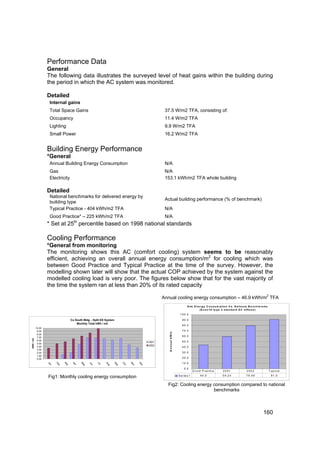
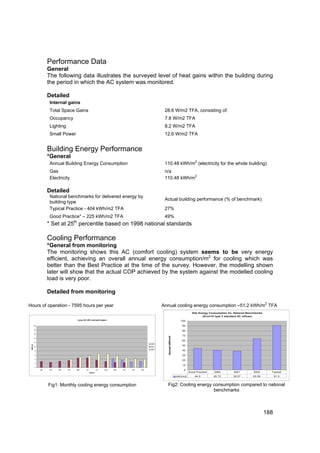
Using once again the dynamic simulation, we could calculate the energy consumption
for the proposed solution, 87 MWhe/year. The following figure shows the comparison
between the solutions.
[MWh(electric)]year [MWh(termal)]year t CO2
180 40.0
160 35.0
140
30.0
CO2 emissions [ton/year]
120
Energy [MWh] year
25.0
100
20.0
80
15.0
60
10.0
40
20 5.0
0 0.0
Electirc resistence Hot Water Electric resistence Hot Water Electric resistence
Actual system New system without free-cooling New system with free-cooling
Figure 8 – Comparison between the simulated systems
94](https://image.slidesharecdn.com/auditactg10casestudies-120120080701-phpapp01/85/Auditac-tg10-case-studies-94-320.jpg)
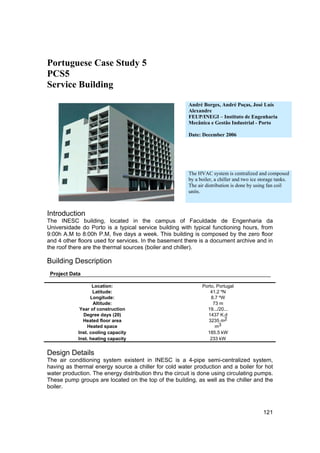
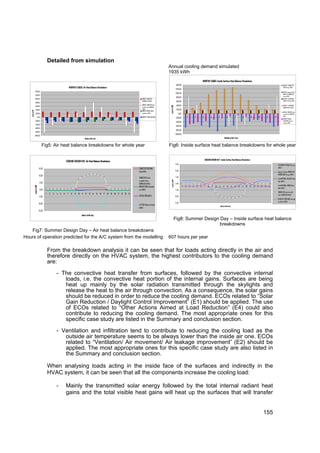
![The new system with free-cooling and electrical reheat is much more effective than the
others, except the system which uses hot water for reheat. However this system would
require a boiler, so the system would consequently become more complex and
expensive.
120
Actual system
100 Centralized system without
Electric anual consumptionl [MWh]
free-cooling
Centralized system with free-
80 cooling
60
40
20
0
Figure 9 – Comparison of cooling electric energy required in the three different simulated systems
Once again is shown that the system with free-cooling is the most effective for this case.
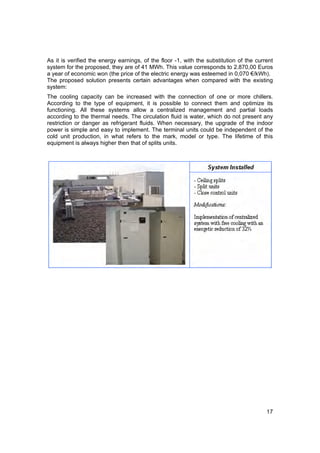
As it is verified by the energy earnings, of the floor -1, with the substitution of the current
system for the proposed one, we can achieve savings of around 41 MWh (Figure 8). This
value correspond to 2.870,00 Euros a year of economic won (the price of the electric
energy was esteemed to be 0,070 €/kWh).
Construction and Operating Costs of New System
According to the proposed HVAC system, the expected budget rounds 80 000 € and the
operating costs will decrease in comparison to the current system.
We shouldn’t forget that the new proposed system will have the responsibility of
climatizing the whole building, therefore we have to make an estimate of earnings for the
whole building, and not only for the floor -1. Having this in mind a new estimate was
obtained, a value of around 7.000,00 euros a year of economics earnings. With such
earnings, it is possible to have a capital return of about 11 years (payback of 11 years),
the lifetime of an HVAC installation of this type is a proximally 20 years, turning the
investment a little more tangible.
Final Analysis
The proposed solution presents certain advantages when compared with the existing
system:
a. The cooling capacity can be increased with the connection of one or more
chillers. According to the type of equipment, it is possible to connect them and
optimize its functioning. All these systems allow a centralized management and
partial loads according to the thermal needs.
95](https://image.slidesharecdn.com/auditactg10casestudies-120120080701-phpapp01/85/Auditac-tg10-case-studies-95-320.jpg)

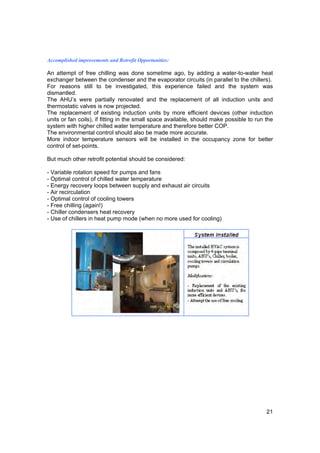
![As a response to the topology of the building there was the need to include direct
expansion units (designated commercially by splits) on the south facade of the building,
middle floors, being used preferentially during the cooling station.
Figure 3 – View of the Chiller Figure 5– View of the Boiler Figure 4–Cooling towers
Building envelope
For better evaluate the energy needs of the building it was necessary to typify the
materials used in the construction of the envelope. The following table describes the
type of building envelope and respective values for the thermal transmission coefficients,
U [w/m2], of each constructive element.
U Umáx
Description 2
(W/m .ºC) RCCTE2006 (I1)
Exterior wall 0.681 1,8
Interior wall 1.833 2
Slab 1.327 1,65
Roof 0.514 1,25
Glazed 4.5
Table 5: Thermal transmission coefficients
Climatic data of the place (external temperature; total monthly incident
radiation). According to RCCTE (Portuguese building thermal regulation) the
building in study is located in the area I2V1 and it presents the following values:
Degree Days (20ºC) 1610
Duration of the heating station (months) 6.7
2
Medium solar energy incident Gsul (kWh/m . month) 108
Exterior Temp. of project (ºC) 30
Thermal width (ºC) 9
Table 6: Climatic data
Control Strategy
The comfort conditions are established for the circulation of air inside the areas to
acclimatize. The circulation of the air is assured by the air distribution system constituted
by AHU’s and ducts.
108](https://image.slidesharecdn.com/auditactg10casestudies-120120080701-phpapp01/85/Auditac-tg10-case-studies-108-320.jpg)
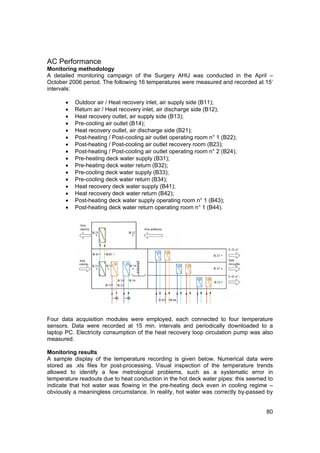
![6.00 Supply 25.00 Supply
5.50
5.00 REAL PROJ. 20.00
Thousands [m^3/h]
4.50
4.00
3.50 15.00
Thousands [m^3/h]
REAL PROJ.
3.00
2.50 10.00
2.00
1.50 5.00
1.00
0.50
-
-
AHU 5.1
AHU 2.1
AHU 3.1
AHU 4.1
AHU 6.1
and 6.2*
to 3.4*
to 4.4*
to 5.4*
AHU_NA 0.1
AHU 0.2
AHU 0.1
AHU_NA 1.1
AHU 1.1
AHU 1.2
AHU 6.3
AHU_NA 6.1
AHU 7.2
AHU 7.1 and
to 2.4
7.3
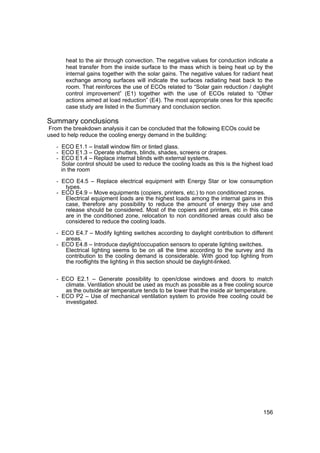
Graph 5 - Comparison between the project and real air Graph 6 - Comparison between the project and real
supply for the floors -1, 0, 5 e 6 air supply for the floors 1,2,3,4 e 6
This results in a impasse situation if the ventilation fans aren’t properly controlled.
There’s a decrease in terms of the thermal comfort. In other hand, if the ventilation fans
are controlled properly there's an acoustic discomfort.
Energy analysis
In the year of 2005 the annual consumption of the Library was the following:
3
MWh m tep
Electric energy 512* - 148
Natural gas - 46869 43
TOTAL 125
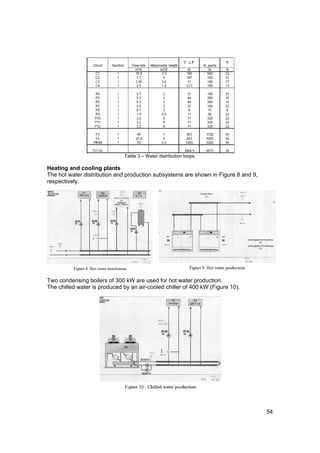
Table 3: Energetic consumption - 2005
* Obtained value based on measurements
The values presented in the previous table are shown in the figure 5. The electric energy
represents the larger consumer of the library global consumption being 78% of the total
consumption.
The natural gas consumption, regarding the AVAC system of the building, is due to the
boilers and chillers, equipments responsible for the production of hot and cold water. All
the remaining energy needs, are established through electric energy.
The energy consumption breakdown showed in figure 5 was based on the measurement
of electric power made during the audit. The main consumers are: illumination,
equipments, ventilation fans of the AHU’s, extraction fans and direct expansion systems
distributed along the building (splits).
112](https://image.slidesharecdn.com/auditactg10casestudies-120120080701-phpapp01/85/Auditac-tg10-case-studies-112-320.jpg)
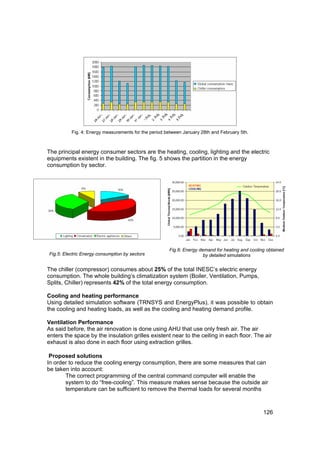
![Cooling Heating
Model Air flow Water temperature 7-12 ºC Water temperature 80-60 ºC
(m3/h)
Total Sensible Dry bulb air Heating Dry bulb air
cooling cooling outlet power outlet
power temperature temperature
(kW) (ºC) (kW) (ºC)
(kW)
VC 1 187 0.8 0.72 12.6 0.96 35.0
VC 2 227 0.9 0.84 13.0 1.10 34.0
VC 3 281 1.03 1.0 13.5 1.65 37.0
VC 4 374 1.2 1.2 14.4 1.98 35.4
VC 5 400 1.79 1.61 12.0 2.50 38.2
VC 6 500 2.19 1.96 12.0 2.89 36.8
VC 7 774 2.33 2.33 15.0 4.55 37.1
VC 8 928 2.67 2.67 15.5 5.0 36.0
VC 9 1062 4.0 3.55 14.0 6.68 38.0
VC 10 1213 4.66 4.0 14.2 7.24 37.0
Ice storage
Designation BG1
Storage capacity (kWh) 670
Max functioning temperature ºC 38
Quantity 2
Building Envelope
The constitution of the building envelope is given in the table bellow
3 2
Exterior Wall e [m] Cp [kJ/kgºK] λ [W/mºK] r [kg/m ] U [W/m K]
Plaster 0.015 0.837 1.150 1950
Concrete 0.3 1.080 1.750 2200
0.560
Polystyrene 0.05 1.250 0.035 32.5
Plaster 0.015 0.837 1.150 1950
3 2
Interior Wall e [m] Cp [kJ/kgºK] λ [W/mºK] r [kg/m ] U [W/m K]
Plaster 0.02 0.837 1.150 1950
Brick 0.15 1.080 1.750 2200 2.774
Plaster 0.02 0.837 1.150 1950
123](https://image.slidesharecdn.com/auditactg10casestudies-120120080701-phpapp01/85/Auditac-tg10-case-studies-123-320.jpg)
![Slab between 3 2
e [m] Cp [kJ/kgºK] λ [W/mºK] r [kg/m ] U [W/m K]
floors
Linoleum 0.002 1.0 0.169 1000.0
Light slab 0.30 0.965 0.931 1320 1.313
Gypsum 0.05 1.085 0.220 1680
3 2
Ground Slab e [m] Cp [kJ/kgºK] λ [W/mºK] r [kg/m ] U [W/m K]
Linoleum 0.002 1.0 0.169 1000.0
Concrete 0.3 1.080 1.750 2200
0.567
Polystyrene 0.05 1.250 0.035 32.5
Plaster 0.015 0.837 1.150 1950
3 2
Door e [m] Cp [kJ/kgºK] λ [W/mºK] r [kg/m ] U [W/m K]
Wood 0.03 2.750 0.150 550 2.703
Solar and Overheating Protection
The glazing constitution and properties are showed in the table below:
3 2
Glazing e [m] Cp [kJ/kg.ºK] λ [W/m.ºK] r [kg/m ] U [W/m K]
Double glass 6mm/6mm 0.850 4000 2800 4.00
Solar transmittance = 0.75
The shading of the building is composed basically by vertical and horizontal shading
devices. There is no interior shading.
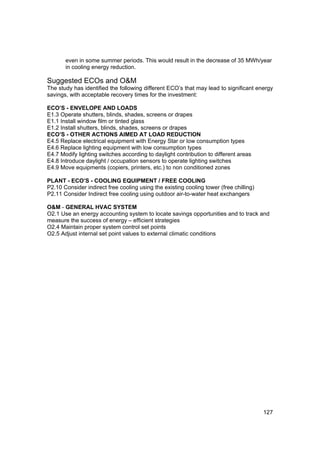
Control Strategy
The HVAC systems works according to a schedule that varies with the rooms
application. The table bellow resumes the different room’s existent in INESC as well as
their typical utilization schedule.
Type of room Functioning schedule
Offices and common areas From 9:00 to 20:00, 5 days a week
Reunion offices and audience rooms From 10:00 to 13:00, once a week
Server rooms and common areas with natural
24 hours a day, 7 days a week
ventilation
124](https://image.slidesharecdn.com/auditactg10casestudies-120120080701-phpapp01/85/Auditac-tg10-case-studies-124-320.jpg)
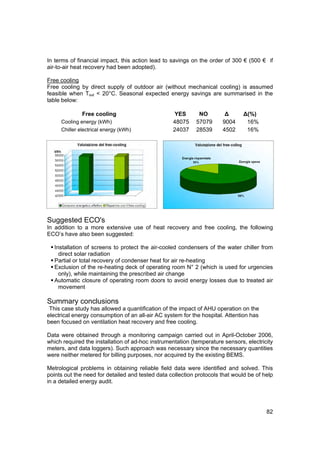
![Fig. 2: Screenshot of the management program
The temperature set points are:
Summer: 25 ºC
Winter: 20 ºC
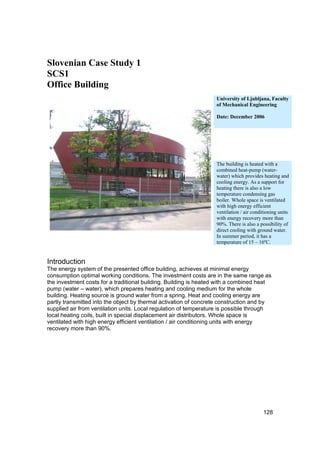
Performance Data
Building Energy Performance
The amount of energy used in the year of 2005 is described below. The natural gas is
used for heating only. Some measurements were done between January 28th and
February 5th. The results showed in fig. 4
INESC Energy consumption for 2005
Electricity Natural gas Natural gas [m3] Electricity [kWh]
[kWh] [m ] 3 50000 1600
45000 1400
January 32774 904 40000
E le c tric ity [k W h ]
1200 N a tu ra l g a s [m 3 ]
February 32836 849 35000
30000 1000
March 34340 855
25000 800
April 42732 396 20000 600
15000
May 37162 41 400
10000
June 43540 2 5000 200
0 0
July 38299 9
ly
ne
ri l
ch
ay
ce r
August 42146 1
y
st
ry
No ber
r
O c er
De be
Ju
ar
Ap
be
Ju
gu
ua
ar
M
b
nu
m
to
m
em
M
Au
br
ve
Ja
Fe
pt
September 40924 4
Se
October 45872 706
November 43766 1243 Fig. 3: Energy consumption for the year of 2005
125](https://image.slidesharecdn.com/auditactg10casestudies-120120080701-phpapp01/85/Auditac-tg10-case-studies-125-320.jpg)


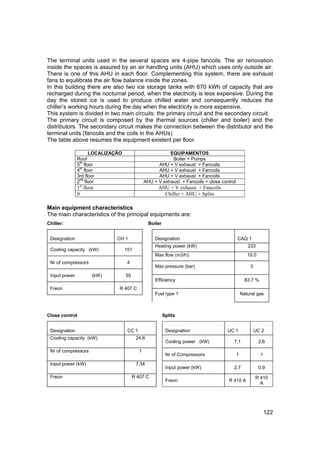
This document provides an introduction to case studies of air conditioning systems that were analyzed as part of the AuditAC project. It describes 22 case studies from various countries in Europe that covered different building types and HVAC system configurations. The case studies aimed to demonstrate real-world examples of different AC systems, potential issues identified, and modifications or improvements that were suggested. Highlights from several of the office building case studies are also provided.


![Getting Started with Apache Spark: Big Data Made Simple [Free Meetup]](https://cdn.slidesharecdn.com/ss_thumbnails/apachesparkgettingstarted-260203175547-8361bcc3-thumbnail.jpg?width=640&height=640&fit=bounds)


