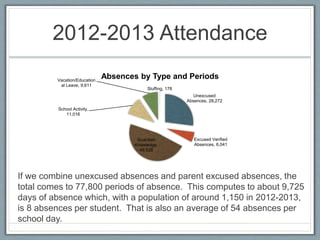
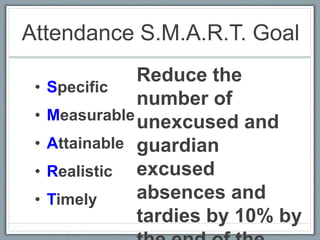
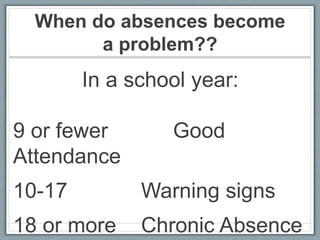
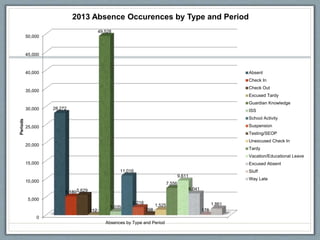
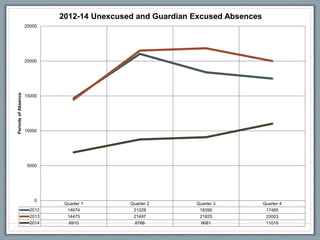
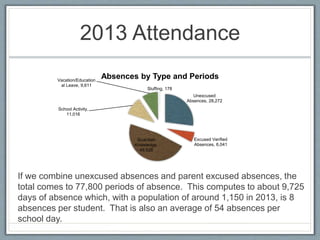
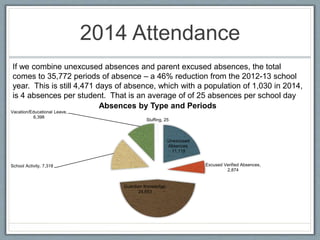
Attendance Program
Every Child, Every Day
South Hills Middle School
2014
Georgia Wing
georgia.wing@jordandistrict.org
801-412-2407
Unexcused
Absences, 28,272
Excused Verified
Absences, 6,041
Guardian
Knowledge,
49,528
School Activity,
11,016
Vacation/Education
al Leave, 9,611
Sluffing, 178
Absences by Type and Periods
2012-2013 Attendance
If we combine unexcused absences and parent excused absences, the
total comes to 77,800 periods of absence. This computes to about 9,725
days of absence which, with a population of around 1,150 in 2012-2013,
is 8 absences per student. That is also an average of 54 absences per
school day.
0
5,000
10,000
15,000
20,000
25,000
30,000
35,000
40,000
45,000
50,000
Absences by Type and Period
28,272
5,1805,629
112
49,528
1,035
11,016
2,218
298
1,525
7,556
9,611
6,041
178
1,861
Periods
2013 Absence Occurences by Type and Period
Absent
Check In
Check Out
Excused Tardy
Guardian Knowledge
ISS
School Activity
Suspension
Testing/SEOP
Unexcused Check In
Tardy
Vacation/Educational Leave
Excused Absent
Sluff
Way Late
Attendance S.M.A.R.T. Goal
• Specific
• Measurable
• Attainable
• Realistic
• Timely
Reduce the
number of
unexcused and
guardian
excused
absences and
tardies by 10% by
Chronically Absent
Students
An Alarming and Largely Overlooked Crisis
is chronically absent students
Hedy Chang Founder and Director of
Attendance Works
Attendanceworks.org
A National initiative committed to addressing
chronic absenteeism
What is Chronically
Absent?
When a student misses 10% or more
of a school year (18 days) they are
chronically absent. That is a red alert
that a student is headed for academic
trouble and eventually for dropping out
of high school.
A summary of key research
on Chronic Absenteeism
• 10-15% of students in the US are chronically absent each year.
• Nationwide at least 1 out of 10 students misses nearly a month of school annually.
• In some cities 1 in 4 students are missing a month of school annually.
• Data suggests that schools may be able to increase student attendance in
elementary school by implementing specific family and community activities.
• The largest statistically significant factor in determining whether a student was
chronically absent was their chronic absence status in the prior year.
• The number of days a student was absent has a significant effect on year-end test
percentiles in both Math and Language Arts for students in grades 3-8 as well as
GPA in high school students.
• Middle and high-achieving students were found to be at greatest risk of academic
decline due to chronic absenteeism.
• A student with 2 or more years of chronic absenteeism has a 50% higher risk of
dropping out.
Secondary Issues
• Attendance in the pivotal freshman year was a key
indicator of whether students would finish high school.
• 9th grade attendance was a better predictor of dropout
than 8th grade test scores.
• Early identification and intervention for students in the
middle grades to prevent student disengagement
increased graduation rates substantially.
• Indicators reflecting poor attendance, misbehavior and
course failure in 6th grade can be used to identify 60% of
the students who will not graduate from high school.
• Too often we think absences aren’t a problem as long as they
are excused or that a child’s learning won’t be affected, unless
they miss a lot of days in a row.
• Research shows missing 10% of the school year, could be just
2-3 days per month. Those days can add up to so much lost
learning time in the classroom that children can’t keep up.
• Poor attendance isn’t just a high school problem. It can start as
early as kindergarten or 1st grade.
• Many of these early absences aren’t truancy or skipping school.
They are excused absences occurring for a variety of reasons.
Even so, they all add up to lost learning time.
• If chronic absence continues year after year, some students
may have missed 1/2 year of instruction by the time they reach
3rd grade.
• Emerging research shows that chronically absent children, in
both kindergarten and 1st grade, are far less likely to read
proficiently at the end of 3rd grade.
When do absences become
a problem??
In a school year:
9 or fewer Good
Attendance
10-17 Warning signs
18 or more Chronic Absence
Sept Oct Nov Dec Jan Feb Mar April May
Daily Student Attendace Percentage
2012/2013
95.37 95.16 93.2 93.14 92.83 92.97 93.53 92.87 93.16
Daily Student Attendace Percentage
2013/2014
95.13 95.19 93.97 93.35 94.62 94.3 94.25 93.62 92.87
91.5
92
92.5
93
93.5
94
94.5
95
95.5
96
Percentage
Daily Student Attendance Percentage
2012-2013 Average Number of Students is 1170
2013-2014 Average Number of Students is 1020
Sept Oct Nov Dec Jan Feb March April May
Days Tardy 2012-2013 0.66 0.76 0.5 0.56 0.69 0.9 0.55 0.75 1.02
Days Tardy 2013-2014 0.43 0.6 0.57 0.39 0.47 0.72 0.78 0.86 0.82
0
0.2
0.4
0.6
0.8
1
1.2
Percentage Average Number of Students Tardy on any Given Period
2012-2013 Average Number of Students is 1170
2013-2014 Average Number of Students is 1020
0
5,000
10,000
15,000
20,000
25,000
30,000
35,000
40,000
45,000
50,000
Absences by Type and Period
22,248
6,694
5,318
51
49,329
1,035
8,385
2,538
146
1,560
7,599
9,464
5,054
147 45
Periods
2012 Absence Occurrence by Type and Period
Absent
Check In
Check Out
Excused Tardy
Guardian Knowledge
ISS
School Activity
Suspension
Testing/SEOP
Unexcused Check In
Tardy
Vacation/Educational Leave
Excused Absent
Sluff
Way Late
0
5,000
10,000
15,000
20,000
25,000
30,000
35,000
40,000
45,000
50,000
Absences by Type and Period
28,272
5,1805,629
112
49,528
1,035
11,016
2,218
298
1,525
7,556
9,611
6,041
178
1,861
Periods
2013 Absence Occurences by Type and Period
Absent
Check In
Check Out
Excused Tardy
Guardian Knowledge
ISS
School Activity
Suspension
Testing/SEOP
Unexcused Check In
Tardy
Vacation/Educational Leave
Excused Absent
Sluff
Way Late
0
5,000
10,000
15,000
20,000
25,000
Absences by Type and Period
11,119
2,8672,910
44
24,653
365
7,318
212 272
886
3,547
6,398
2,874
25 33
Periods 2014 Absence Occurences by Type and Period
Absent
Check In
Check Out
Excused Tardy
Guardian Knowledge
ISS
School Activity
Suspension
Testing/SEOP
Unexcused Check In
Tardy
Vacation/Educational Leave
Excused Absent
Sluff
Way Late
Quarter 1 Quarter 2 Quarter 3 Quarter 4
2012 14674 21028 18390 17485
2013 14475 21497 21825 20003
2014 6910 8766 9081 11015
0
5000
10000
15000
20000
25000
PeriodsofAbsence 2012-14 Unexcused and Guardian Excused Absences
Unexcused
Absences, 28,272
Excused Verified
Absences, 6,041
Guardian
Knowledge,
49,528
School Activity,
11,016
Vacation/Education
al Leave, 9,611
Sluffing, 178
Absences by Type and Periods
2013 Attendance
If we combine unexcused absences and parent excused absences, the
total comes to 77,800 periods of absence. This computes to about 9,725
days of absence which, with a population of around 1,150 in 2013, is 8
absences per student. That is also an average of 54 absences per
school day.
Unexcused
Absences,
11,119
Excused Verified Absences,
2,874
Guardian Knowledge,
24,653
School Activity, 7,318
Vacation/Educational Leave,
6,398
Sluffing, 25
Absences by Type and Periods
If we combine unexcused absences and parent excused absences, the total
comes to 35,772 periods of absence – a 46% reduction from the 2012-13 school
year. This is still 4,471 days of absence, which with a population of 1,030 in 2014,
is 4 absences per student. That is an average of of 25 absences per school day
2014 Attendance
2014 Late Arrivals
Check In, 2,867
Excused Tardies, 44
Unexcused Check In, 886
Unexcused
Tardies, 3,547
Way Late, 33
Late Arrivals by Type and Periods
There were approximately 3.4 tardies per student (pop. 1030) in the 2013-14
school year. That is an average of 20 tardies per day or 2.5 tardies per period.
What is next?
• Continue to implement all attendance
strategies and interventions.
• Hire quality teachers.
• Utilize JPAS tools to develop effective and
highly effective teachers.
• Our goal is to engage every student, every
day, every period.
Questions?

Attendance Presentation-short version

  • 1.
    Attendance Program Every Child,Every Day South Hills Middle School 2014 Georgia Wing georgia.wing@jordandistrict.org 801-412-2407
  • 2.
    Unexcused Absences, 28,272 Excused Verified Absences,6,041 Guardian Knowledge, 49,528 School Activity, 11,016 Vacation/Education al Leave, 9,611 Sluffing, 178 Absences by Type and Periods 2012-2013 Attendance If we combine unexcused absences and parent excused absences, the total comes to 77,800 periods of absence. This computes to about 9,725 days of absence which, with a population of around 1,150 in 2012-2013, is 8 absences per student. That is also an average of 54 absences per school day.
  • 4.
    0 5,000 10,000 15,000 20,000 25,000 30,000 35,000 40,000 45,000 50,000 Absences by Typeand Period 28,272 5,1805,629 112 49,528 1,035 11,016 2,218 298 1,525 7,556 9,611 6,041 178 1,861 Periods 2013 Absence Occurences by Type and Period Absent Check In Check Out Excused Tardy Guardian Knowledge ISS School Activity Suspension Testing/SEOP Unexcused Check In Tardy Vacation/Educational Leave Excused Absent Sluff Way Late
  • 5.
    Attendance S.M.A.R.T. Goal •Specific • Measurable • Attainable • Realistic • Timely Reduce the number of unexcused and guardian excused absences and tardies by 10% by
  • 6.
    Chronically Absent Students An Alarmingand Largely Overlooked Crisis is chronically absent students Hedy Chang Founder and Director of Attendance Works Attendanceworks.org A National initiative committed to addressing chronic absenteeism
  • 7.
    What is Chronically Absent? Whena student misses 10% or more of a school year (18 days) they are chronically absent. That is a red alert that a student is headed for academic trouble and eventually for dropping out of high school.
  • 8.
    A summary ofkey research on Chronic Absenteeism • 10-15% of students in the US are chronically absent each year. • Nationwide at least 1 out of 10 students misses nearly a month of school annually. • In some cities 1 in 4 students are missing a month of school annually. • Data suggests that schools may be able to increase student attendance in elementary school by implementing specific family and community activities. • The largest statistically significant factor in determining whether a student was chronically absent was their chronic absence status in the prior year. • The number of days a student was absent has a significant effect on year-end test percentiles in both Math and Language Arts for students in grades 3-8 as well as GPA in high school students. • Middle and high-achieving students were found to be at greatest risk of academic decline due to chronic absenteeism. • A student with 2 or more years of chronic absenteeism has a 50% higher risk of dropping out.
  • 9.
    Secondary Issues • Attendancein the pivotal freshman year was a key indicator of whether students would finish high school. • 9th grade attendance was a better predictor of dropout than 8th grade test scores. • Early identification and intervention for students in the middle grades to prevent student disengagement increased graduation rates substantially. • Indicators reflecting poor attendance, misbehavior and course failure in 6th grade can be used to identify 60% of the students who will not graduate from high school.
  • 10.
    • Too oftenwe think absences aren’t a problem as long as they are excused or that a child’s learning won’t be affected, unless they miss a lot of days in a row. • Research shows missing 10% of the school year, could be just 2-3 days per month. Those days can add up to so much lost learning time in the classroom that children can’t keep up. • Poor attendance isn’t just a high school problem. It can start as early as kindergarten or 1st grade. • Many of these early absences aren’t truancy or skipping school. They are excused absences occurring for a variety of reasons. Even so, they all add up to lost learning time. • If chronic absence continues year after year, some students may have missed 1/2 year of instruction by the time they reach 3rd grade. • Emerging research shows that chronically absent children, in both kindergarten and 1st grade, are far less likely to read proficiently at the end of 3rd grade.
  • 11.
    When do absencesbecome a problem?? In a school year: 9 or fewer Good Attendance 10-17 Warning signs 18 or more Chronic Absence
  • 16.
    Sept Oct NovDec Jan Feb Mar April May Daily Student Attendace Percentage 2012/2013 95.37 95.16 93.2 93.14 92.83 92.97 93.53 92.87 93.16 Daily Student Attendace Percentage 2013/2014 95.13 95.19 93.97 93.35 94.62 94.3 94.25 93.62 92.87 91.5 92 92.5 93 93.5 94 94.5 95 95.5 96 Percentage Daily Student Attendance Percentage 2012-2013 Average Number of Students is 1170 2013-2014 Average Number of Students is 1020
  • 17.
    Sept Oct NovDec Jan Feb March April May Days Tardy 2012-2013 0.66 0.76 0.5 0.56 0.69 0.9 0.55 0.75 1.02 Days Tardy 2013-2014 0.43 0.6 0.57 0.39 0.47 0.72 0.78 0.86 0.82 0 0.2 0.4 0.6 0.8 1 1.2 Percentage Average Number of Students Tardy on any Given Period 2012-2013 Average Number of Students is 1170 2013-2014 Average Number of Students is 1020
  • 18.
    0 5,000 10,000 15,000 20,000 25,000 30,000 35,000 40,000 45,000 50,000 Absences by Typeand Period 22,248 6,694 5,318 51 49,329 1,035 8,385 2,538 146 1,560 7,599 9,464 5,054 147 45 Periods 2012 Absence Occurrence by Type and Period Absent Check In Check Out Excused Tardy Guardian Knowledge ISS School Activity Suspension Testing/SEOP Unexcused Check In Tardy Vacation/Educational Leave Excused Absent Sluff Way Late
  • 19.
    0 5,000 10,000 15,000 20,000 25,000 30,000 35,000 40,000 45,000 50,000 Absences by Typeand Period 28,272 5,1805,629 112 49,528 1,035 11,016 2,218 298 1,525 7,556 9,611 6,041 178 1,861 Periods 2013 Absence Occurences by Type and Period Absent Check In Check Out Excused Tardy Guardian Knowledge ISS School Activity Suspension Testing/SEOP Unexcused Check In Tardy Vacation/Educational Leave Excused Absent Sluff Way Late
  • 20.
    0 5,000 10,000 15,000 20,000 25,000 Absences by Typeand Period 11,119 2,8672,910 44 24,653 365 7,318 212 272 886 3,547 6,398 2,874 25 33 Periods 2014 Absence Occurences by Type and Period Absent Check In Check Out Excused Tardy Guardian Knowledge ISS School Activity Suspension Testing/SEOP Unexcused Check In Tardy Vacation/Educational Leave Excused Absent Sluff Way Late
  • 21.
    Quarter 1 Quarter2 Quarter 3 Quarter 4 2012 14674 21028 18390 17485 2013 14475 21497 21825 20003 2014 6910 8766 9081 11015 0 5000 10000 15000 20000 25000 PeriodsofAbsence 2012-14 Unexcused and Guardian Excused Absences
  • 22.
    Unexcused Absences, 28,272 Excused Verified Absences,6,041 Guardian Knowledge, 49,528 School Activity, 11,016 Vacation/Education al Leave, 9,611 Sluffing, 178 Absences by Type and Periods 2013 Attendance If we combine unexcused absences and parent excused absences, the total comes to 77,800 periods of absence. This computes to about 9,725 days of absence which, with a population of around 1,150 in 2013, is 8 absences per student. That is also an average of 54 absences per school day.
  • 23.
    Unexcused Absences, 11,119 Excused Verified Absences, 2,874 GuardianKnowledge, 24,653 School Activity, 7,318 Vacation/Educational Leave, 6,398 Sluffing, 25 Absences by Type and Periods If we combine unexcused absences and parent excused absences, the total comes to 35,772 periods of absence – a 46% reduction from the 2012-13 school year. This is still 4,471 days of absence, which with a population of 1,030 in 2014, is 4 absences per student. That is an average of of 25 absences per school day 2014 Attendance
  • 25.
    2014 Late Arrivals CheckIn, 2,867 Excused Tardies, 44 Unexcused Check In, 886 Unexcused Tardies, 3,547 Way Late, 33 Late Arrivals by Type and Periods There were approximately 3.4 tardies per student (pop. 1030) in the 2013-14 school year. That is an average of 20 tardies per day or 2.5 tardies per period.
  • 27.
    What is next? •Continue to implement all attendance strategies and interventions. • Hire quality teachers. • Utilize JPAS tools to develop effective and highly effective teachers. • Our goal is to engage every student, every day, every period.
  • 28.