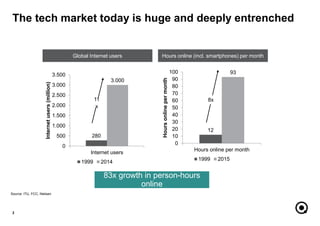
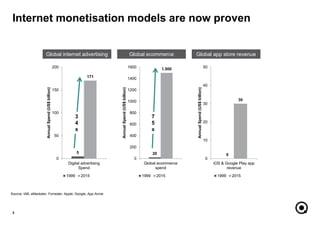
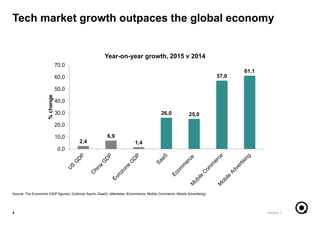
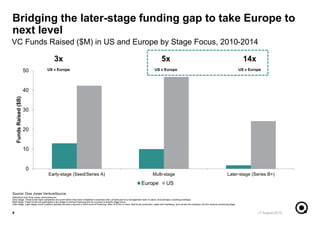
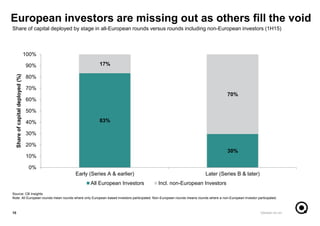
The future of the digital economy
NOAH London – 13 November 2015
Version nn.nn1
The tech market today is huge and deeply entrenched
2
Source: ITU, FCC, Nielsen
280
3.000
0
500
1.000
1.500
2.000
2.500
3.000
3.500
Internet users
Internetusers(million)
1999 2014
12
93
0
10
20
30
40
50
60
70
80
90
100
Hours online per month
Hoursonlinepermonth
1999 2015
Global Internet users Hours online (incl. smartphones) per month
83x growth in person-hours
online
11
x
8x
Source: IAB; eMarketer; Forrester. Apple, Google, App Annie
Internet monetisation models are now proven
3
5
171
0
50
100
150
200
Digital advertising
Spend
AnnualSpend(US$billion)
1999 2015
20
1.500
0
200
400
600
800
1000
1200
1400
1600
Global ecommerce
spend
AnnualSpend(US$billion)
1999 2015
0
30
0
10
20
30
40
50
iOS & Google Play app
revenue
AnnualSpend(US$billion)
1999 2015
Global internet advertising Global ecommerce Global app store revenue
3
4
x
7
5
x
Tech market growth outpaces the global economy
2,4
6,9
1,4
26,0 25,0
57,0
61,1
0,0
10,0
20,0
30,0
40,0
50,0
60,0
70,0
%change
Year-on-year growth, 2015 v 2014
Version 14
Source: The Economist (GDP figures), Goldman Sachs (SaaS), eMarketer (Ecommerce, Mobile Commerce, Mobile Advertising)
Shifting incentives mean companies are staying
private longer
Version 15
Source: VentureSource; CB Insights
3
7
0
5
10
Median age at IPO
Yearsfromfirstfounding
2000 2014
45 47
10 14
28
44
0
20
40
60
80
100
US China India Europe Rest of
World
#of$100m+investmentrounds
VC-backed companies staying private
longer
$100m+ rounds in Internet & Software
Companies since 2013
CaliforniaRestofUS
1
3
6
14
26
0
10
20
30
40
$B+companiesfoundedsince2003
European $B+ companies founded since 2003 by year surpassed $B+ milestone
6
40 European $B+ companies founded since 2003
More global winners now coming from Europe
Source: Atomico
40
Major Sectors Remain Largely Undisrupted
7
Source: Atomico research.
6%
2%
0%
7%
3%
6%
8%
6%
3%
18%
10%
8% 8%
6%
2% 2%
1% 1%
0%
2%
4%
6%
8%
10%
12%
14%
16%
18%
20%
Share of GDP Share of $B companies
8
97% of Europe’s $B+ companies today were founded in 2011 or earlier
Source: Atomico
A defining moment for Europe and technology
5
16
11
1
0
2
4
6
8
10
12
14
16
18
2003-2005 2006-2008 2009-2011 2012-14
$B+companiesbyyearfounded
European $B+ founded since 2013 companies by year founded
17 August 2015
Bridging the later-stage funding gap to take Europe to
next level
9
0
10
20
30
40
50
Early-stage (Seed/Series A) Multi-stage Later-stage (Series B+)
FundsRaised($B)
Europe US
3x
US v Europe
5x
US v Europe
14x
US v Europe
Source: Dow Jones VentureSource
Definitions from Dow Jones VentureSource:
Early-stage: These funds back companies at a point where they have completed a business plan, at least part of a management team in place, and perhaps a working prototype
Multi-stage: These funds will participate in any stage of venture financing and do not have a specific stage focus
Later stage: Later-stage round investors typically provide a second or third round of financing, often of $10m or more, that funds production, sales and marketing, and carries the company into the revenue-producing stage.
17 August 2015
VC Funds Raised ($M) in US and Europe by Stage Focus, 2010-2014
83%
30%
17%
70%
0%
10%
20%
30%
40%
50%
60%
70%
80%
90%
100%
Early (Series A & earlier) Later (Series B & later)
Shareofcapitaldeployed(%)
All European Investors Incl. non-European Investors
Version nn.nn10
Share of capital deployed by stage in all-European rounds versus rounds including non-European investors (1H15)
Source: CB Insights
Note: All European rounds mean rounds where only European-based investors participated. Non-European rounds means rounds where a non-European investor participated.
European investors are missing out as others fill the void
Version nn.nnINTERNAL | Do not distribute11
Focus on Leading European Internet companies
Covering over 400 companies across 25
online verticals, a broad range of over 500
investors as well as 100+ online-focused
corporates
Deep understanding of industry dynamics
Ability to add value beyond banking advice
Facilitates overall process and minimizes
management distraction
NOAH Advisors is globally well connected
and has direct access to virtually all key
players in the industry
Knowledge of and strong relationships
with potential buyers’ key decision makers
Proactively finds and unlocks attractive
investment opportunities for leading
investors
Annual NOAH Conference in its 8th year
Over 40 years of combined relevant M&A
experience
Routine execution of M&A and financing
transactions with sizes of several billion
euros
22 successfully completed NOAH Advisors
transactions underline successful transfer of
M&A competencies to the Internet sector
Entrepreneurial mind-set, focused on growing the
business and establishing a reputation for
excellence
Ability to deliver top results in short time frames
Highly success-based compensation structures
align interests of clients and NOAH Advisors,
and demonstrate conviction to deliver top results
Creative deal solutions
September 2015 December 2014
September 2014October 2014
May 2014 February 2013
May 2012 April 2011
Sale of a 70% stake in
to
Exclusive Financial Advisor to
Drushim and its Shareholders
Sale of 100% of
for $800m to
Exclusive Financial Advisor to
Fotolia and the Selling Shareholders
Sale of 100% of
for €80m to
Exclusive Financial Advisor to
Trovit and its Shareholders
Sale of controlling stake in
to
Exclusive Financial Advisor to
Facile.it and its Shareholders
sold 100% of
for $228m to a joint venture between
Exclusive Financial Advisor to Yad2
and its Shareholders
Growth equity investment from
for a 30% stake alongside Softonic’s Founders
and Angel Investors at a valuation of €275m
Exclusive Financial Advisor to
Softonic and its shareholders
150 million growth equity investment from
for a 50% stake alongside Fotolia’s Founders and
Additional $150 million senior debt financing
Total $300 million investment
Financial Advisor to Fotolia and its Shareholders
have acquired a majority stake in
for $350m from
Exclusive Advisor to Summit Partners and TA Associates
Selected Completed
NOAH Transactions
Unique Industry Know-How
Unmatched Network and Relationships
Strong Investment Banking Competence
Full Commitment - We Are Entrepreneurs!
EUROPE’S LEADING INTERNET CORPORATE FINANCE BOUTIQUE
®

Atomico - NOAH15 London

  • 1.
    The future ofthe digital economy NOAH London – 13 November 2015 Version nn.nn1
  • 3.
    The tech markettoday is huge and deeply entrenched 2 Source: ITU, FCC, Nielsen 280 3.000 0 500 1.000 1.500 2.000 2.500 3.000 3.500 Internet users Internetusers(million) 1999 2014 12 93 0 10 20 30 40 50 60 70 80 90 100 Hours online per month Hoursonlinepermonth 1999 2015 Global Internet users Hours online (incl. smartphones) per month 83x growth in person-hours online 11 x 8x
  • 4.
    Source: IAB; eMarketer;Forrester. Apple, Google, App Annie Internet monetisation models are now proven 3 5 171 0 50 100 150 200 Digital advertising Spend AnnualSpend(US$billion) 1999 2015 20 1.500 0 200 400 600 800 1000 1200 1400 1600 Global ecommerce spend AnnualSpend(US$billion) 1999 2015 0 30 0 10 20 30 40 50 iOS & Google Play app revenue AnnualSpend(US$billion) 1999 2015 Global internet advertising Global ecommerce Global app store revenue 3 4 x 7 5 x
  • 5.
    Tech market growthoutpaces the global economy 2,4 6,9 1,4 26,0 25,0 57,0 61,1 0,0 10,0 20,0 30,0 40,0 50,0 60,0 70,0 %change Year-on-year growth, 2015 v 2014 Version 14 Source: The Economist (GDP figures), Goldman Sachs (SaaS), eMarketer (Ecommerce, Mobile Commerce, Mobile Advertising)
  • 6.
    Shifting incentives meancompanies are staying private longer Version 15 Source: VentureSource; CB Insights 3 7 0 5 10 Median age at IPO Yearsfromfirstfounding 2000 2014 45 47 10 14 28 44 0 20 40 60 80 100 US China India Europe Rest of World #of$100m+investmentrounds VC-backed companies staying private longer $100m+ rounds in Internet & Software Companies since 2013 CaliforniaRestofUS
  • 7.
    1 3 6 14 26 0 10 20 30 40 $B+companiesfoundedsince2003 European $B+ companiesfounded since 2003 by year surpassed $B+ milestone 6 40 European $B+ companies founded since 2003 More global winners now coming from Europe Source: Atomico 40
  • 8.
    Major Sectors RemainLargely Undisrupted 7 Source: Atomico research. 6% 2% 0% 7% 3% 6% 8% 6% 3% 18% 10% 8% 8% 6% 2% 2% 1% 1% 0% 2% 4% 6% 8% 10% 12% 14% 16% 18% 20% Share of GDP Share of $B companies
  • 9.
    8 97% of Europe’s$B+ companies today were founded in 2011 or earlier Source: Atomico A defining moment for Europe and technology 5 16 11 1 0 2 4 6 8 10 12 14 16 18 2003-2005 2006-2008 2009-2011 2012-14 $B+companiesbyyearfounded European $B+ founded since 2013 companies by year founded 17 August 2015
  • 10.
    Bridging the later-stagefunding gap to take Europe to next level 9 0 10 20 30 40 50 Early-stage (Seed/Series A) Multi-stage Later-stage (Series B+) FundsRaised($B) Europe US 3x US v Europe 5x US v Europe 14x US v Europe Source: Dow Jones VentureSource Definitions from Dow Jones VentureSource: Early-stage: These funds back companies at a point where they have completed a business plan, at least part of a management team in place, and perhaps a working prototype Multi-stage: These funds will participate in any stage of venture financing and do not have a specific stage focus Later stage: Later-stage round investors typically provide a second or third round of financing, often of $10m or more, that funds production, sales and marketing, and carries the company into the revenue-producing stage. 17 August 2015 VC Funds Raised ($M) in US and Europe by Stage Focus, 2010-2014
  • 11.
    83% 30% 17% 70% 0% 10% 20% 30% 40% 50% 60% 70% 80% 90% 100% Early (Series A& earlier) Later (Series B & later) Shareofcapitaldeployed(%) All European Investors Incl. non-European Investors Version nn.nn10 Share of capital deployed by stage in all-European rounds versus rounds including non-European investors (1H15) Source: CB Insights Note: All European rounds mean rounds where only European-based investors participated. Non-European rounds means rounds where a non-European investor participated. European investors are missing out as others fill the void
  • 12.
    Version nn.nnINTERNAL |Do not distribute11
  • 13.
    Focus on LeadingEuropean Internet companies Covering over 400 companies across 25 online verticals, a broad range of over 500 investors as well as 100+ online-focused corporates Deep understanding of industry dynamics Ability to add value beyond banking advice Facilitates overall process and minimizes management distraction NOAH Advisors is globally well connected and has direct access to virtually all key players in the industry Knowledge of and strong relationships with potential buyers’ key decision makers Proactively finds and unlocks attractive investment opportunities for leading investors Annual NOAH Conference in its 8th year Over 40 years of combined relevant M&A experience Routine execution of M&A and financing transactions with sizes of several billion euros 22 successfully completed NOAH Advisors transactions underline successful transfer of M&A competencies to the Internet sector Entrepreneurial mind-set, focused on growing the business and establishing a reputation for excellence Ability to deliver top results in short time frames Highly success-based compensation structures align interests of clients and NOAH Advisors, and demonstrate conviction to deliver top results Creative deal solutions September 2015 December 2014 September 2014October 2014 May 2014 February 2013 May 2012 April 2011 Sale of a 70% stake in to Exclusive Financial Advisor to Drushim and its Shareholders Sale of 100% of for $800m to Exclusive Financial Advisor to Fotolia and the Selling Shareholders Sale of 100% of for €80m to Exclusive Financial Advisor to Trovit and its Shareholders Sale of controlling stake in to Exclusive Financial Advisor to Facile.it and its Shareholders sold 100% of for $228m to a joint venture between Exclusive Financial Advisor to Yad2 and its Shareholders Growth equity investment from for a 30% stake alongside Softonic’s Founders and Angel Investors at a valuation of €275m Exclusive Financial Advisor to Softonic and its shareholders 150 million growth equity investment from for a 50% stake alongside Fotolia’s Founders and Additional $150 million senior debt financing Total $300 million investment Financial Advisor to Fotolia and its Shareholders have acquired a majority stake in for $350m from Exclusive Advisor to Summit Partners and TA Associates Selected Completed NOAH Transactions Unique Industry Know-How Unmatched Network and Relationships Strong Investment Banking Competence Full Commitment - We Are Entrepreneurs! EUROPE’S LEADING INTERNET CORPORATE FINANCE BOUTIQUE ®