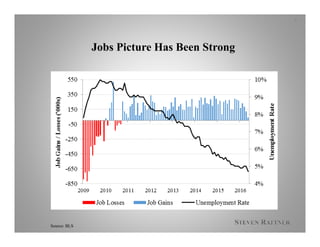
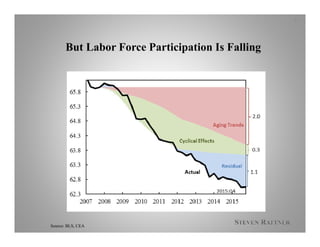
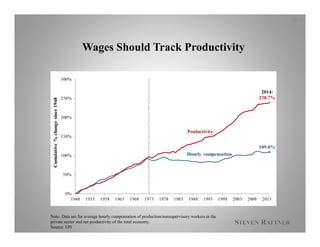
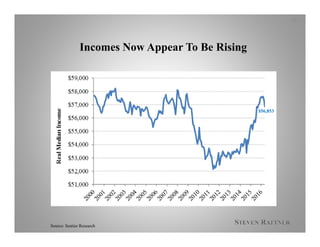
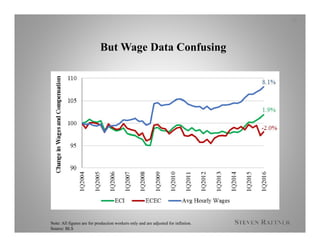
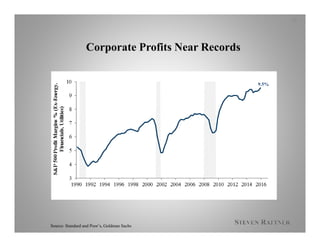
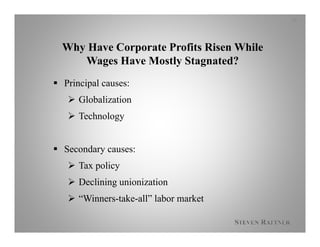
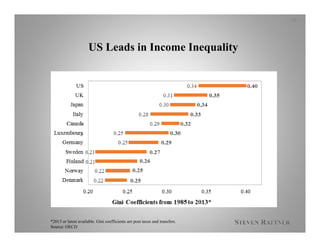
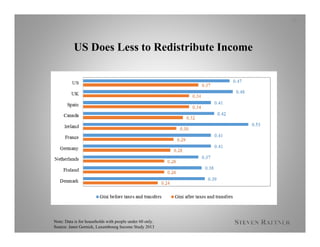
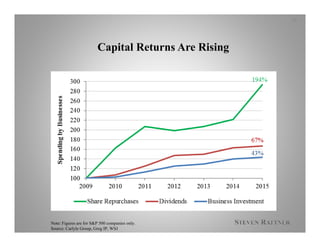
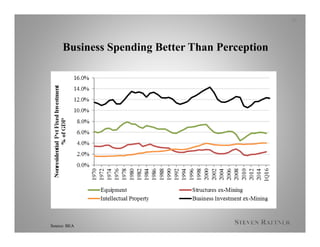
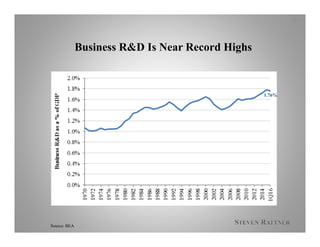
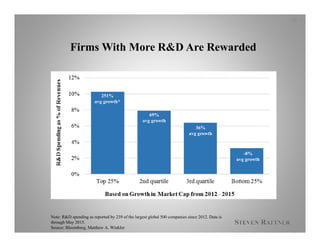
Steven Rattner
June 30, 2016
Is Capitalism Working?
1
Agenda
 Jobs
 Wages
 Income Inequality
 Corporate Short-termism
2
Jobs
3
Jobs Picture Has Been Strong
Source: BLS
4
But Labor Force Participation Is Falling
Source: BLS, CEA
5
The Missing Prime-Age Men
Source: OECD
6
Less Educated More Likely To Drop Out
Source: CEA, BLS
7
Gig Economy Is Growing But Still Small
8
Source: JP Morgan Chase Institute, BLS
…But Barely Register Among Self-EmployedGig Workers Have Been Increasing…
Wages
9
Wages Should Track Productivity
Note: Data are for average hourly compensation of production/nonsupervisory workers in the
private sector and net productivity of the total economy.
Source: EPI
10
Incomes Now Appear To Be Rising
Source: Sentier Research
11
$56,853
But Wage Data Confusing
12
Note: All figures are for production workers only and are adjusted for inflation.
Source: BLS
Corporate Profits Near Records
Source: Standard and Poor’s, Goldman Sachs
13
9.5%
Why Have Corporate Profits Risen While
Wages Have Mostly Stagnated?
 Principal causes:
 Globalization
 Technology
 Secondary causes:
 Tax policy
 Declining unionization
 “Winners-take-all” labor market
14
Income Inequality
15
US Leads in Income Inequality
*2013 or latest available. Gini coefficients are post taxes and transfers.
Source: OECD
16
US Does Less to Redistribute Income
17
Note: Data is for households with people under 60 only.
Source: Janet Gornick, Luxembourg Income Study 2013
Are Companies Too Short-Term?
18
Capital Returns Are Rising
19
Note: Figures are for S&P 500 companies only.
Source: Carlyle Group, Greg IP, WSJ
Business Spending Better Than Perception
20
Source: BEA
Business R&D Is Near Record Highs
21
Source: BEA
1.76%
Firms With More R&D Are Rewarded
22
Note: R&D spending as reported by 239 of the largest global 500 companies since 2012. Data is
through May 2015.
Source: Bloomberg, Matthew A. Winkler
251%
avg growth*
69%
avg growth
36%
avg growth
-8%
avg growth
Thank You For Listening
23

AspenPresentation_SteveRattner

  • 1.
    Steven Rattner June 30,2016 Is Capitalism Working? 1
  • 2.
    Agenda  Jobs  Wages Income Inequality  Corporate Short-termism 2
  • 3.
  • 4.
    Jobs Picture HasBeen Strong Source: BLS 4
  • 5.
    But Labor ForceParticipation Is Falling Source: BLS, CEA 5
  • 6.
    The Missing Prime-AgeMen Source: OECD 6
  • 7.
    Less Educated MoreLikely To Drop Out Source: CEA, BLS 7
  • 8.
    Gig Economy IsGrowing But Still Small 8 Source: JP Morgan Chase Institute, BLS …But Barely Register Among Self-EmployedGig Workers Have Been Increasing…
  • 9.
  • 10.
    Wages Should TrackProductivity Note: Data are for average hourly compensation of production/nonsupervisory workers in the private sector and net productivity of the total economy. Source: EPI 10
  • 11.
    Incomes Now AppearTo Be Rising Source: Sentier Research 11 $56,853
  • 12.
    But Wage DataConfusing 12 Note: All figures are for production workers only and are adjusted for inflation. Source: BLS
  • 13.
    Corporate Profits NearRecords Source: Standard and Poor’s, Goldman Sachs 13 9.5%
  • 14.
    Why Have CorporateProfits Risen While Wages Have Mostly Stagnated?  Principal causes:  Globalization  Technology  Secondary causes:  Tax policy  Declining unionization  “Winners-take-all” labor market 14
  • 15.
  • 16.
    US Leads inIncome Inequality *2013 or latest available. Gini coefficients are post taxes and transfers. Source: OECD 16
  • 17.
    US Does Lessto Redistribute Income 17 Note: Data is for households with people under 60 only. Source: Janet Gornick, Luxembourg Income Study 2013
  • 18.
    Are Companies TooShort-Term? 18
  • 19.
    Capital Returns AreRising 19 Note: Figures are for S&P 500 companies only. Source: Carlyle Group, Greg IP, WSJ
  • 20.
    Business Spending BetterThan Perception 20 Source: BEA
  • 21.
    Business R&D IsNear Record Highs 21 Source: BEA 1.76%
  • 22.
    Firms With MoreR&D Are Rewarded 22 Note: R&D spending as reported by 239 of the largest global 500 companies since 2012. Data is through May 2015. Source: Bloomberg, Matthew A. Winkler 251% avg growth* 69% avg growth 36% avg growth -8% avg growth
  • 23.
    Thank You ForListening 23