Download as PDF, PPTX


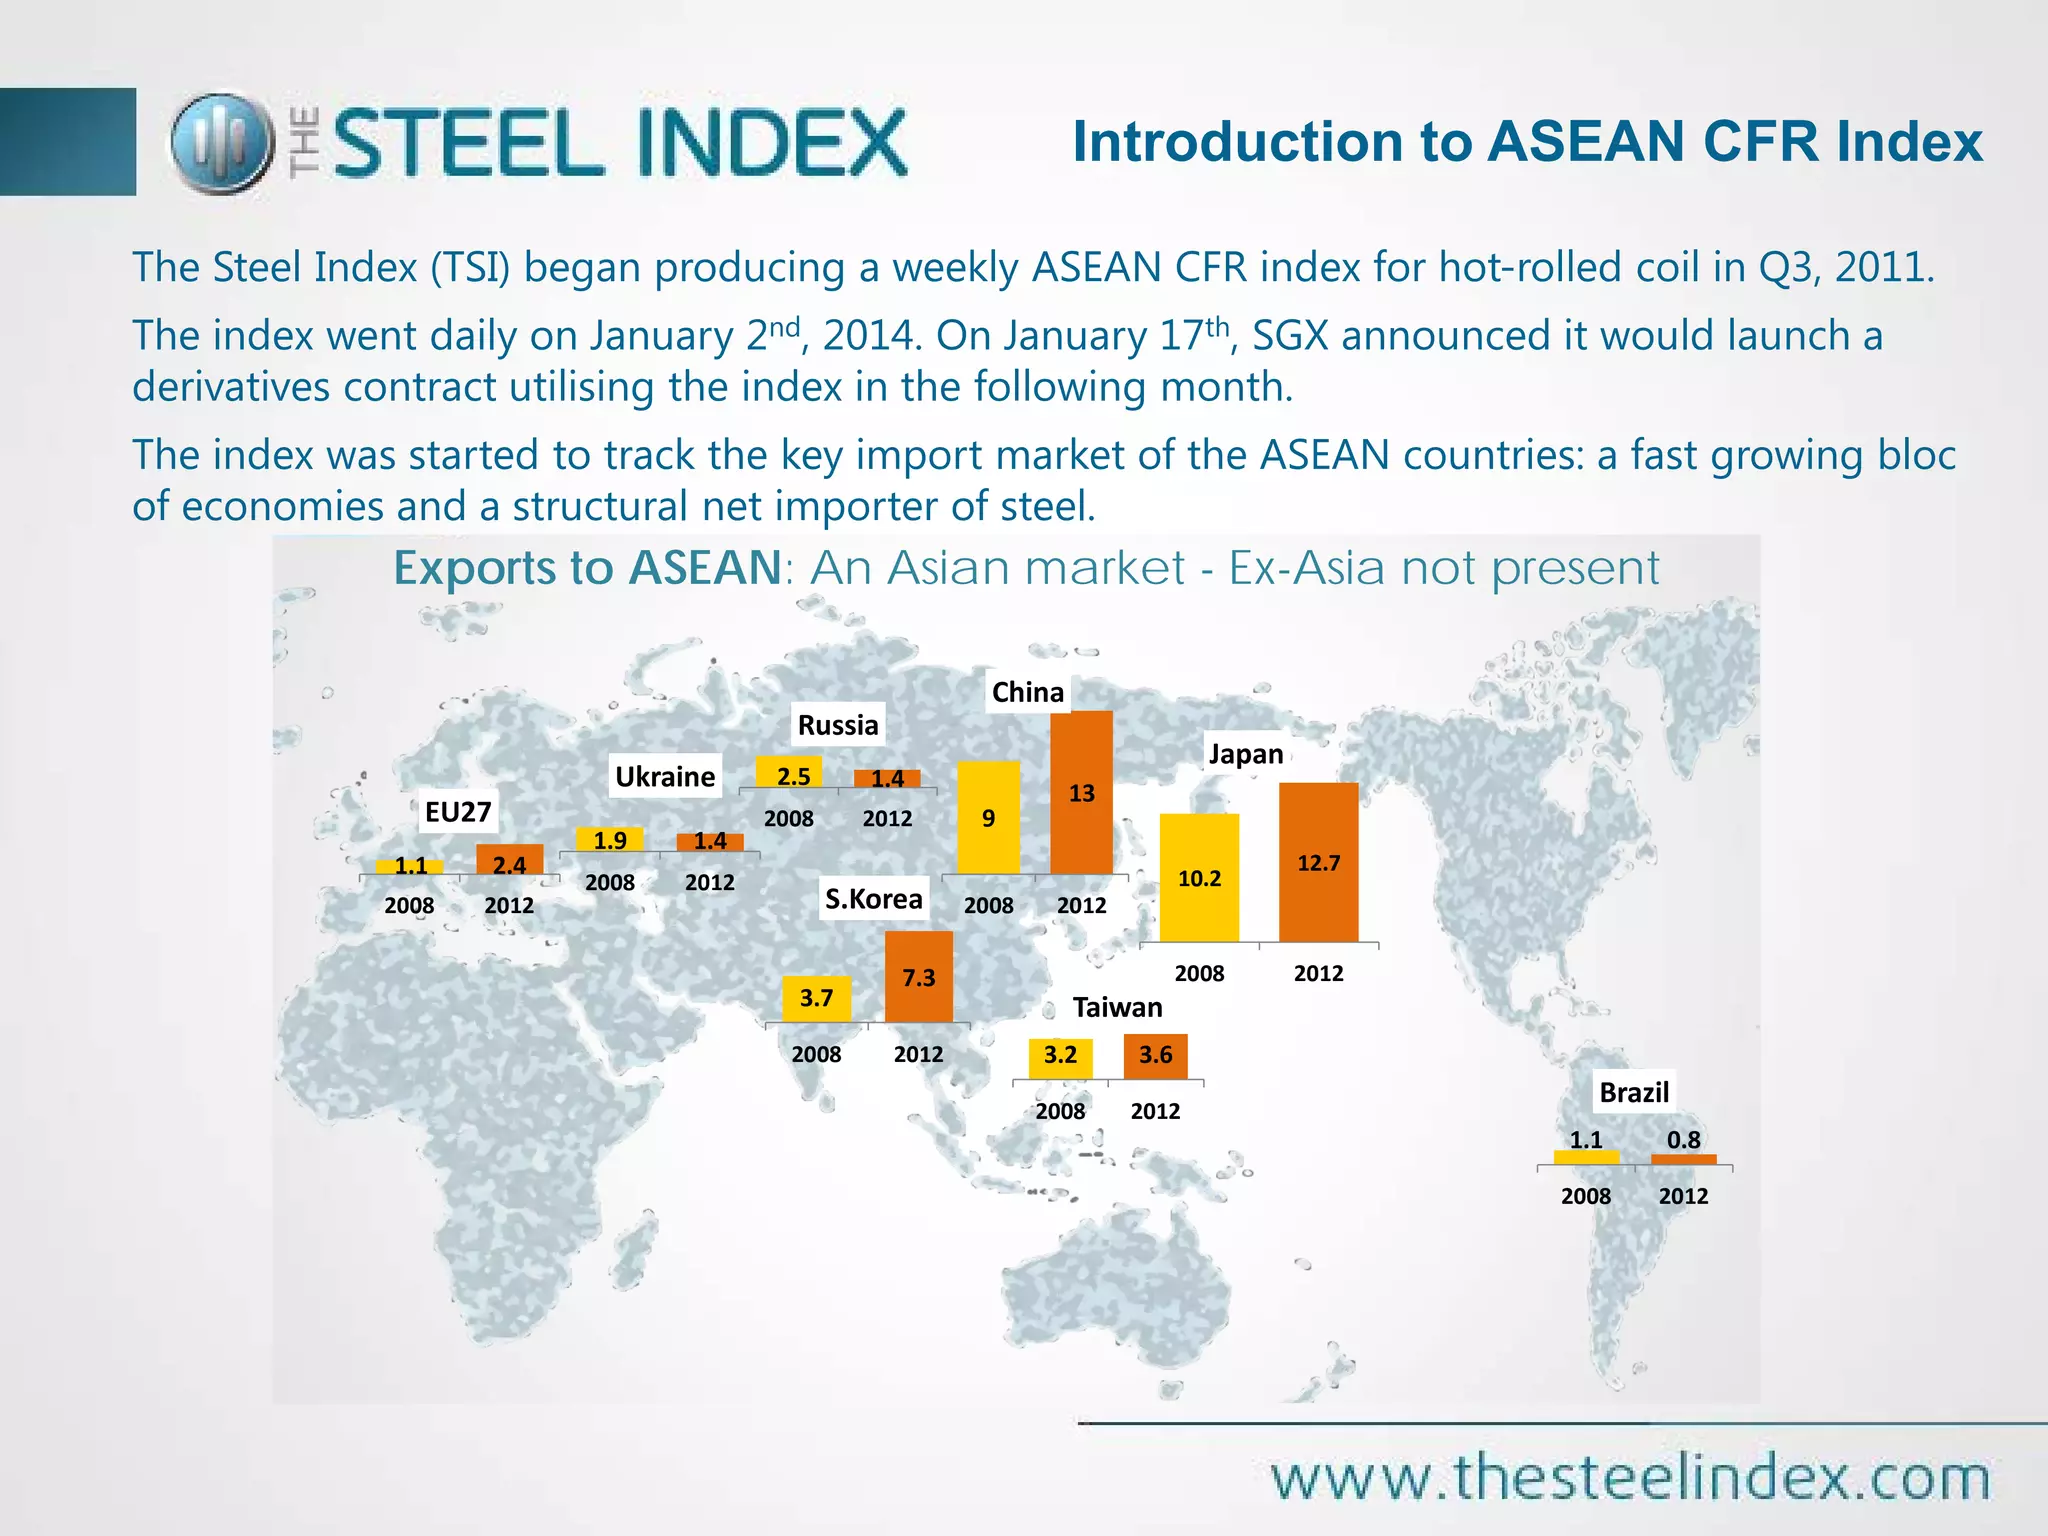


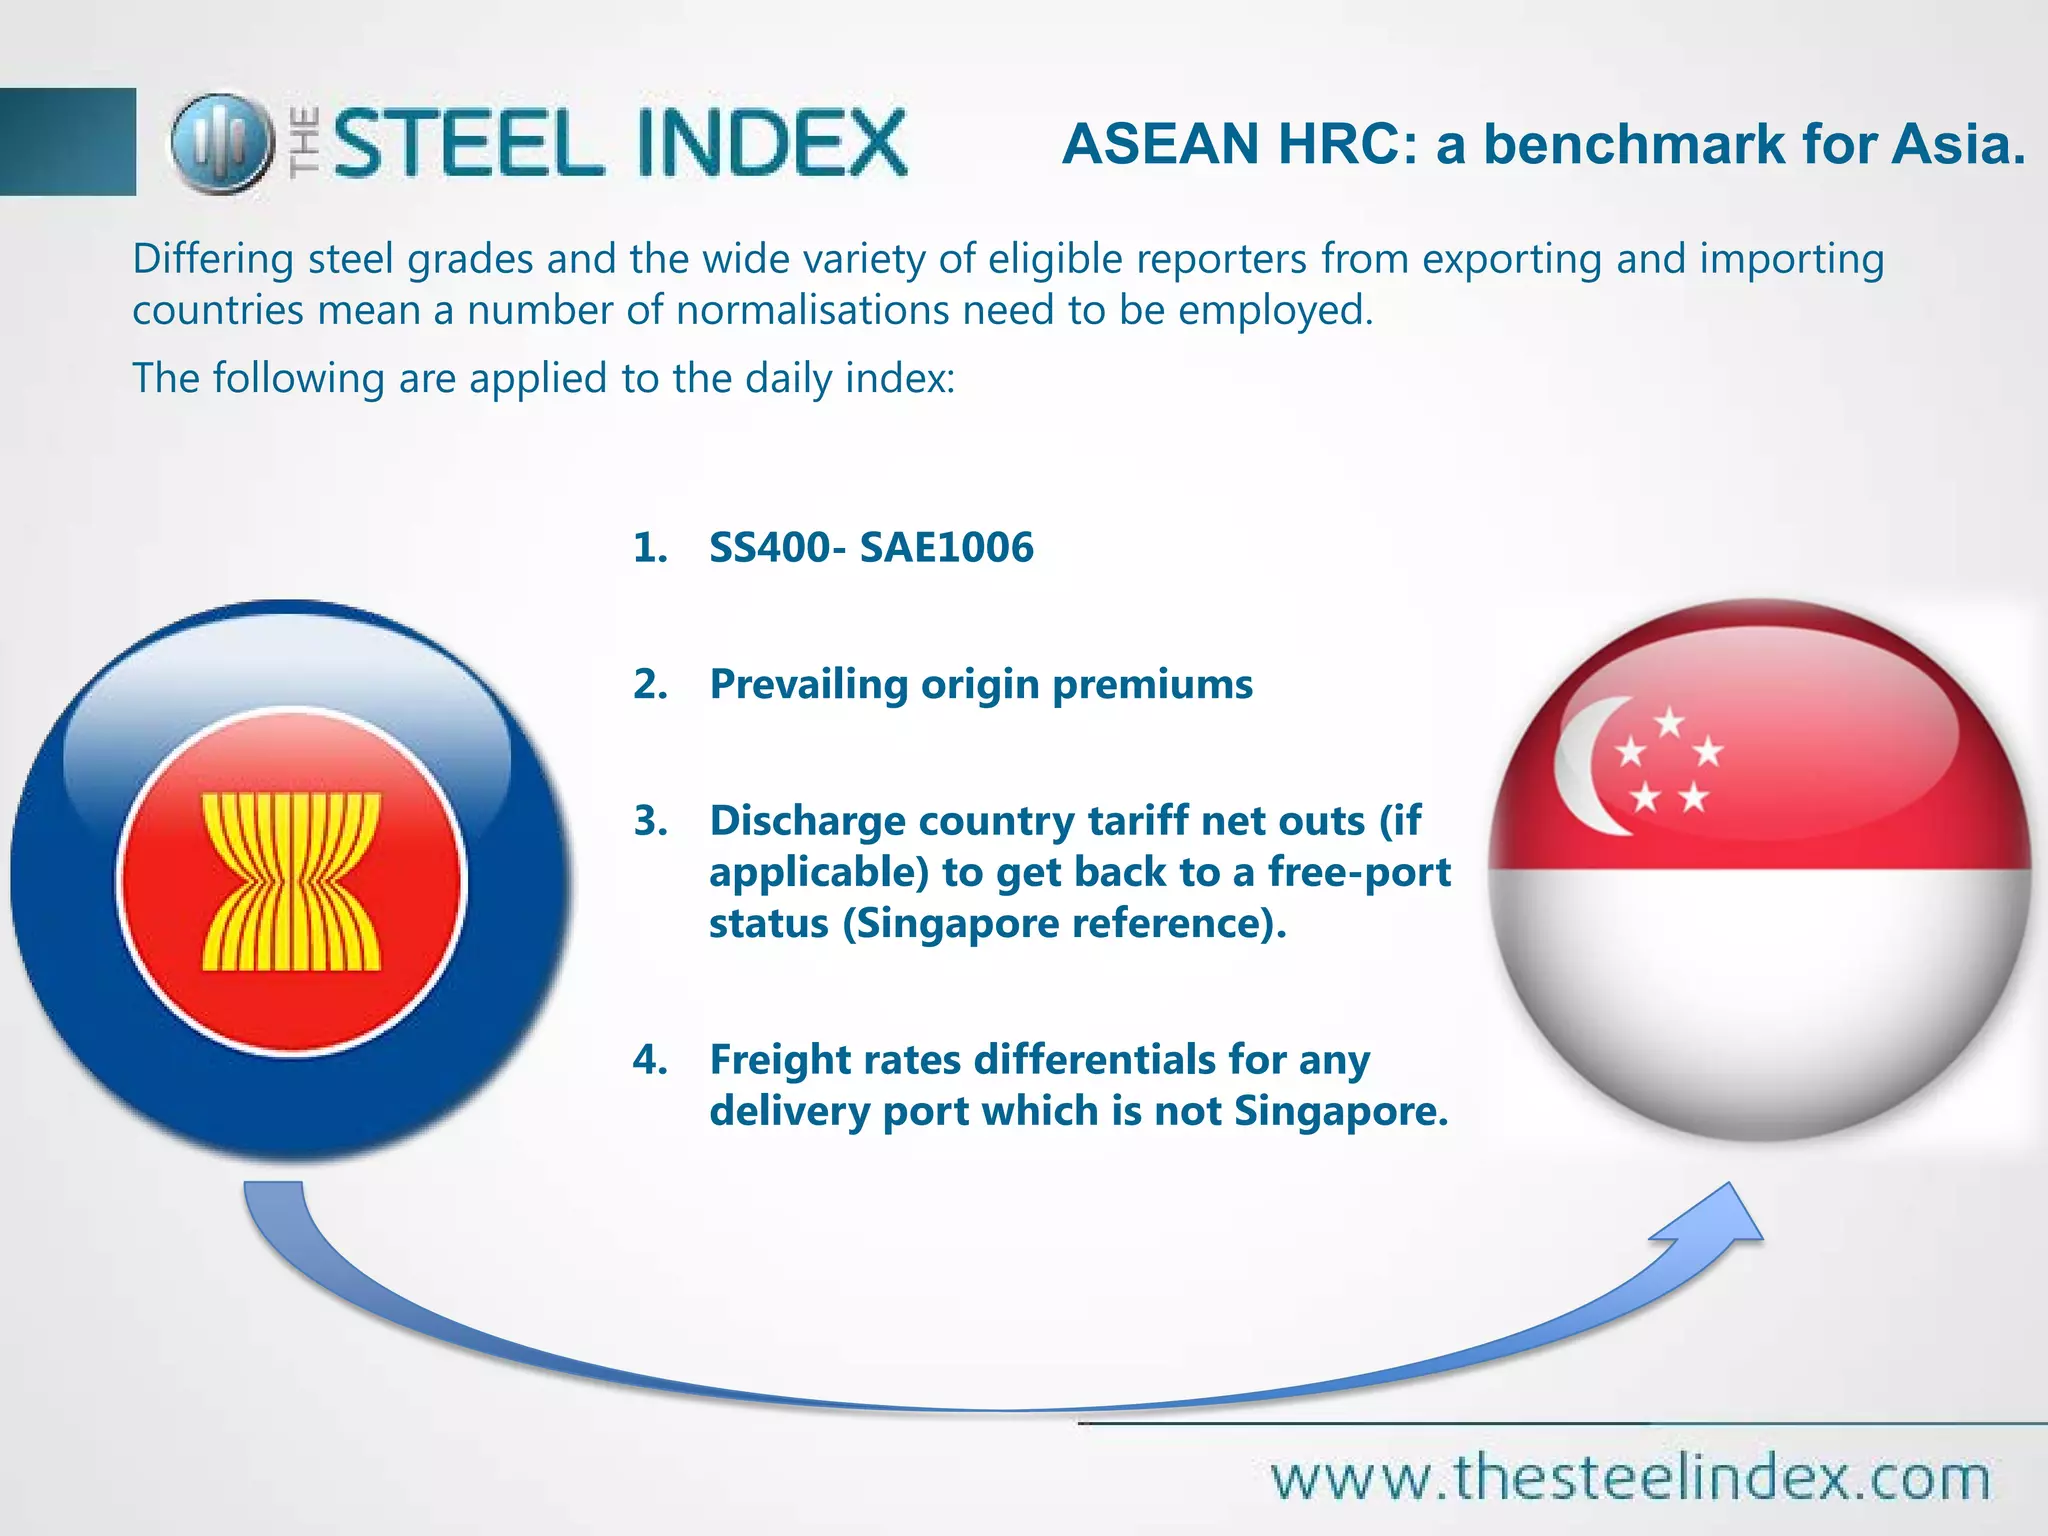
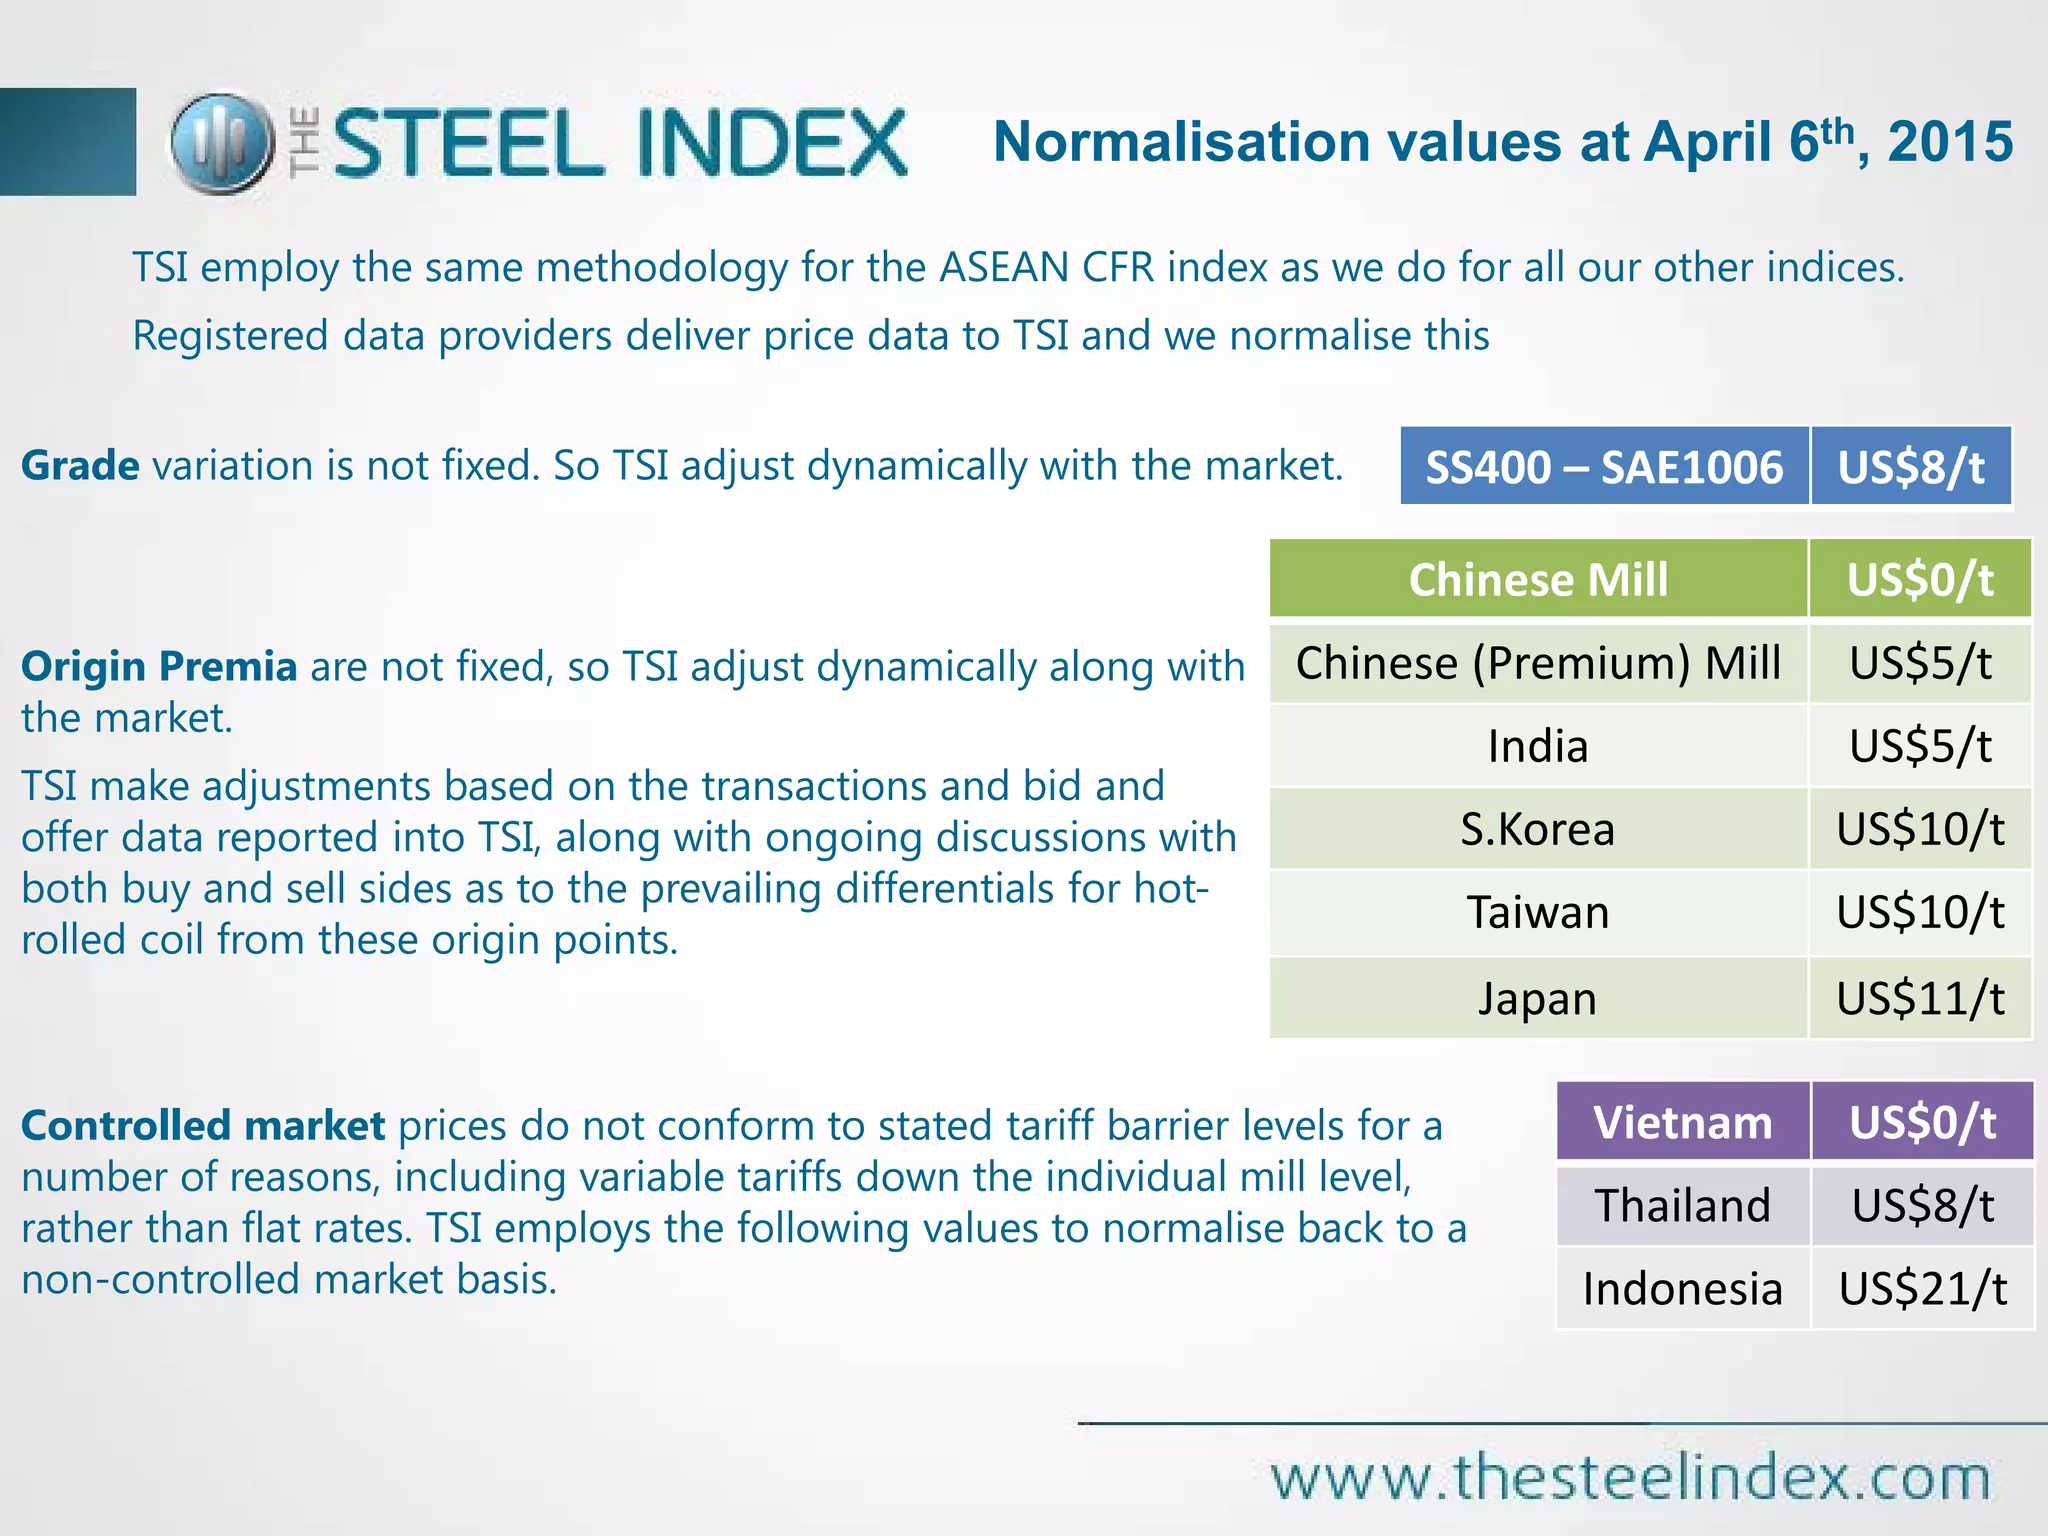


TSI uses a consistent methodology to compile its ASEAN CFR index for hot-rolled coil. They maximize industry participation and data accuracy while minimizing manipulation. Data providers submit actual transaction data confidentially, which TSI then cleans by excluding outliers and normalizing for factors like grade, origin, and tariffs before calculating a daily volume-weighted average price. The ASEAN index aims to benchmark Asian HRC prices with participation from major exporters and importers in the region.


