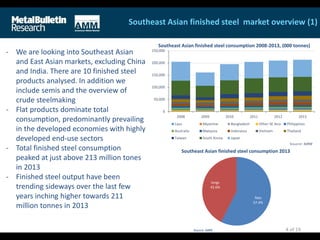
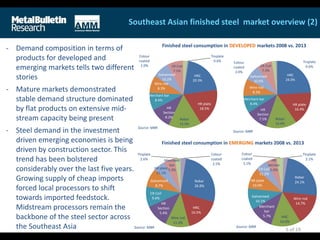
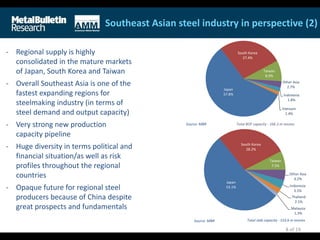
1
Southeast Asia Steel: Key trends and
prospects amid the dominance of China
July 2014
Roman Kucinskij Metal Bulletin Research
MBR’s global focus on steel and steel
raw materials sectors
Since the 90’s MBR began market research into the global steel and steel raw
material industry via our monthly Trackers that analyse the markets.
Today MBR is one of the leading market research providers to global steel,
aluminium and steel raw materials markets.
Company published a number of different metals dedicated regular publications.
Soon enough we realised the growing interest from the industry for trustworthy
independent source of market intelligence. MBR started to address such demand by
offering the long term strategic market studies.
MBR consultancy is a well acclaimed provider of the bespoke strategic market
studies enforced by extensive global contact base, meticulous and proprietary
research techniques as well as highly regarded team of consultants backed by years
of professional expertise
2 of 19
The report
An in-depth industry driven approach resulted in a detailed strategic forecast study of
Southeast Asian steel and steel raw materials sectors
- A seven-year outlook of the Southeast and East Asian finished steel and steel raw
materials markets out to 2020. The comprehensive top to bottom approach allowed
MBR to outline a detailed historic & forecast production, net trade, and consumption
by country and by individual products. There are also detailed insights in the
individual steel end-using sectors (by country) as well as analysis of the steel raw
materials markets. MBR estimates it covers more than 95% of regional consumption
and production
- China’s role in the regional supply and issues of the surging boron containing steel
exports
- A comprehensive database of the antidumping tariffs imposed against steel products
originated in each individual country
- Insightful and easy to use analysis of the trade data
- Report also contains profiles of more than 150 companies operating on the market,
analysis of their corporate activity, mill-by-mill capacity, in addition to lots of
exclusive, proprietary data obtained through over 6 months of the rigorous research
process 3 of 19
Southeast Asian finished steel market overview (1)
Southeast Asian finished steel consumption 2008-2013, (000 tonnes)
Southeast Asian finished steel consumption 2013
4 of 19
0
50,000
100,000
150,000
200,000
250,000
2008 2009 2010 2011 2012 2013
Laos Myanmar Bangladesh Other SE Asia Philippines
Australia Malaysia Indonesia Vietnam Thailand
Taiwan South Korea Japan
Source: MBR
flats
57.4%
longs
42.6%
Source: MBR
- We are looking into Southeast Asian
and East Asian markets, excluding China
and India. There are 10 finished steel
products analysed. In addition we
include semis and the overview of
crude steelmaking
- Flat products dominate total
consumption, predominantly prevailing
in the developed economies with highly
developed end-use sectors
- Total finished steel consumption
peaked at just above 213 million tones
in 2013
- Finished steel output have been
trending sideways over the last few
years inching higher towards 211
million tonnes in 2013
Southeast Asian finished steel market overview (2)
5 of 19
- Demand composition in terms of
products for developed and
emerging markets tells two different
stories
- Mature markets demonstrated
stable demand structure dominated
by flat products on extensive mid-
stream capacity being present
- Steel demand in the investment
driven emerging economies is being
driven by construction sector. This
trend has been bolstered
considerably over the last five years.
Growing supply of cheap imports
forced local processors to shift
towards imported feedstock.
Midstream processors remain the
backbone of the steel sector across
the Southeast Asia
Finished steel consumption in EMERGING markets 2008 vs. 2013
Rebar
26.8%
HRC
16.5%
Wire rod
11.3%
HR plate
11.1%
CR Coil
9.6%
Galvanised
8.7%
HR
Section
5.4%
Merchant
bar
5.3%
Tinplate
2.6%
Colour
coated
2.5%
Source: MBR
Rebar
24.1%
Wire rod
14.7%
HRC
14.0%
CR Coil
11.2%
Galvanised
10.1%
HR plate
10.0%
Merchant
bar
5.7%
HR
Section
5.0%
Colour
coated
3.1%
Tinplate
2.1%
Source: MBR
Finished steel consumption in DEVELOPED markets 2008 vs. 2013
HRC
20.3%
HR plate
18.5%
Rebar
15.9%
Galvanised
10.2%
Merchant bar
8.4%
Wire rod
8.3%
HR
Section
8.2%
CR Coil
7.5%
Colour
coated
2.0%
Tinplate
0.6%
Source: MBR
HRC
24.0%
HR plate
16.4%
Rebar
14.9%
Galvanised
10.6%
Merchant bar
8.4%
Wire rod
8.2%
HR
Section
7.5%
CR Coil
7.3%
Colour
coated
2.0%
Tinplate
0.6%
Source: MBR
Regional Economic Background
6 of 19
- Markets within the Southeast Asian
region = one of the strongest
growth rates globally
- One of the strongest
macroeconomic fundamentals
projection, including GDP,
population growth, bolstering
urbanisation, growing consumption
- At the same time, the developed
market of East Asia (Japan, S.Korea,
Taiwan) are facing severe
headwinds in terms of economic
development, translating into
anaemic growth
- Steel is the quintessential
underlyning material necessary for
economic expansion in emerging
and mature markets alike
China
Japan
Indonesia
South Korea
Taiwan
Malaysia
Philippines
Vietnam
Thailand
Bangladesh
Myanmar
Laos
New Zealand
0.0%
2.0%
4.0%
6.0%
8.0%
10.0%
-0.5% 0.0% 0.5% 1.0% 1.5% 2.0%
IPgrowth,%y-on-y
Population growth, % y-on-y
Australia
Source: MBR, various The size of the bubble represents GDP PPP in 2020 in USD bns
Location of China data point
Location of Japan data point
11.5
10.2
8.0 7.9
6.4
5.0
4.1
3.5
2.2
1.8 1.7
10.9
9.6
8.5
7.3
4.8
2.6 2.2
1.5
9.7
5.9
4.8
1.6
2.1
5.6
4.0 4.0
1.9
-0.1
-1.8
6.3
10.8
4.0
1.4
0.9
0.0
1.7
0.9
7.2
6.6
4.9
6.3
4.9
3.9
5.1 5.1
2.5 2.8
3.4
5.1
8.3 7.8
4.4
2.0
1.4
4.0 3.8
-4
-2
0
2
4
6
8
10
12
14
AverageIndustrialProductionGrowth,%
2000-2007
2008-2013
2014-2020
Source: MBR, various
South East Asia (inc. China) Rest of the World
Southeast Asian steel industry in perspective (1)
7 of 19
Philippines, 106%
Malaysia, 205%
Indonesia, 154%
Australia, 182%
New Zealand, 210%
Vietnam, 152%
Thailand, 174%
Myanmar, 9%
Bangladesh, 111%
Nepal, 46%
Cambodia, 0%
Taiwan, 230%
Japan, 277%South Korea, 189%
Laos, 0%
Singapore, 24%
Source: MBR
Country’s capacity sufficiency ratio
Imports penetration 80-100% 50-79% 30-49% <29%
- Uneven market development
patterns with a mature industry in
East Asia and emerging in the rest of
the region
- Underdevelopment of the
Southeast Asia market (EAF
steelmaking, midstream
overcapacity, long structural
products orientation, high cost of
production, industry limitations)
- Rise of China (overcapacity, growing
pressure from cheap supply of
commoditised material, “boron
steel”)
- Regional developments in SE Asia
(affiliation, upstream capacity
expansion, limited exposure to
higher quality products)
Southeast Asian steel industry in perspective (2)
8 of 19
- Regional supply is highly
consolidated in the mature markets
of Japan, South Korea and Taiwan
- Overall Southeast Asia is one of the
fastest expanding regions for
steelmaking industry (in terms of
steel demand and output capacity)
- Very strong new production
capacity pipeline
- Huge diversity in terms political and
financial situation/as well as risk
profiles throughout the regional
countries
- Opaque future for regional steel
producers because of China despite
great prospects and fundamentals
Japan
57.8%
South Korea
27.4%
Taiwan
8.9%
Other Asia
2.7%
Indonesia
1.8%
Vietnam
1.4%
Source: MBR Total BOF capacity - 166.3 m tonnes
Japan
53.1%
South Korea
28.2%
Taiwan
7.5%
Other Asia
4.2%
Indonesia
3.5%
Thailand
2.1%
Malaysia
1.3%
Source: MBR Total slab capacity - 153.6 m tonnes
China’s steel industry potential
9 of 19
- Largest capacity globally - about 1
billion tpy of crude capacity
- Country’s steel sector is plagued by
overcapacity and associated debt
problems
- Government continuously proclaims
actions against excess capacity
- At the same time, subsidisation
export support is still in place
- Despite that, total export volumes
are trending negatively way below
recorded pre-crisis levels
- 40% of total China’s exports are
addressed to Southeast Asia
0
5,000
10,000
15,000
20,000
25,000
30,000
35,000
40,000
45,000
50,000
2006 2007 2008 2009 2010 2011 2012 2013
000tonnes
Wire rod
HR sections
Merchant bar
Rebar
HDG
Colour Coated
Tinplate
CR Coil
HR Plate
HRC
Source: MBR, Customs statistics
Finished steel Chinese carbon steel by product exports (official data
not including boron) 2006- 2013, ('000 tonnes)
China’s factor or “the boron steel conundrum”
10 of 19
- At the same time, market players are
facing expanding share of the boron-
containing steel deliveries
- Its scale and impact on the markets are
vaguely addressed due to opaque nature
of the transaction, problematic
compatibility with international HS system
- Undoubtedly, the use of boron implies that
the real export volumes – unofficially as
opposed to what is officially reported in
customs statistics – is substantially higher
- MBR assessed the scale of boron steel
deliveries for major commoditised
products on a country-by-country basis. As
a result, updated realistic projections of
the deliveries from China are provided in
the report
0
100
200
300
400
500
600
700
800
900
1,000
2007 2008 2009 2010 2011 2012 2013
000tonnes
Official statistics Boron steel
Source: MBR, Customs statistics
0
50
100
150
200
250
300
350
400
450
500
2007 2008 2009 2010 2011 2012 2013
000tonnes
Official statistics Boron steel
Source: MBR, Customs statistics
Thai wire rod imports 2007 - 2013 ('000 tonnes)
Vietnamese wire rod imports 2007 - 2013 ('000 tonnes)
Country example - Vietnam
11 of 19
Company Location Product Start-up Capacity
('000t)
Capex
($m)
Supplier
Formosa Heavy Industries Vung Ang Slab 2015 2,700 n/a Siemens VAI
Formosa Heavy Industries Vung Ang Billet 2015 1,200 n/a Siemens VAI
Formosa Heavy Industries Vung Ang Bloom 2015 1,500 n/a Siemens VAI
Formosa Plastics Group Vung Ang, phase I BF, BOF, HRC, wire rod 2015 7,000 10,000 n/a
Formosa Plastics Group Vung Ang, phase II BF, BOF, HRC, wire rod 2020 21,850 10,000 n/a
JFE Steel :: E United Dung Quat Econ. Zone EAF, HRC 2016 3,500 n/a n/a
Kyoei Steel Vietnam Company (KSVC) Hanoi EAF 2015 500 n/a n/a
Kyoei Steel Vietnam Company (KSVC) Hanoi Rebar / wire rod 2015 500 n/a n/a
Posco Phu My HRC 2015 3,000 n/a n/a
Posco Phu My HDG 2015 400 n/a n/a
Posco Specialty Steel Phu My EAF 2014 1,000 620 n/a
Posco Specialty Steel Phu My Sections 2014 1,000 800 n/a
SeAH Steel Dong Nai ERW 2014 50 n/a n/a
Southern Steel Sheet Corp Dong Nai Colour coat 2014 200 n/a n/a
Thai Nguyen Iron and Steel (TISCO) Thai Nguyen EAF 2016 500 383 n/a
Thai Nguyen Iron and Steel (TISCO) Thai Nguyen Billet 2016 500 n/a n/a
Ton Dong A (TDA) Binh Duong CRC 2014 200 n/a n/a
Ton Dong A (TDA) Binh Duong HDG 2014 200 n/a n/a
Ton Dong A (TDA) Binh Duong Colour coat 2016 120 n/a n/a
Ton Dong A (TDA) Binh Duong HDG 2016 150 n/a n/a
Vietnam Steel / Kunming Lao Cai BF, BOF 2013 500 n/a n/a
Vietnam-China Mineral Resources Lao Cai EAF 2015 1,000 307 n/a
Vina Kyoei Steel Vung Tau EAF 2014 500 200 n/a
Vina Kyoei Steel Vung Tau Rebar 2014 100 n/a n/a
Vina Kyoei Steel Vung Tau Wire rod 2014 400 n/a n/a
Vina Kyoei Steel Vung Tau Billet 2014 500 n/a n/a
Source: MBR
New capacity in Vietnam (000 tonnes)
Country example - Vietnam
Vietnamese CR coil market ('000 tonnes)
12 of 19
2008 2009 2010 2011 2012 2013
Shipments 432 631 1,720 1,473 1,747 1,780
Net exports (720) (709) (46) 137 10 (221)
Apparent consumption 380 522 828 153 916 1,119
% change consumption 37.2% 58.5% (81.5%) 498.9% 22.2%
Source: Companies, customs data, MBR
2008 2009 2010 2011 2012 2013
Off-Highway 1 1 1 1 1 1
Automotive 6 6 8 6 7 6
Shipbuilding 0 0 0 0 0 0
Construction 123 170 270 48 299 367
Other 250 346 548 98 608 745
Apparent consumption 380 522 828 153 916 1,119
% change consumption 37.2% 58.5% (81.5%) 498.9% 22.2%
Source: MBR
Vietnamese CR coil demand split by end-use sector ('000 tonnes)
Key Findings - Supply
13 of 19
• Total Southeast Asian finished steel output is expected to peak at above 260 million tonnes in 2020. Production
growth rate is forecasted at about 2.5-3% CAGR. Growth pattern will be different for mature and emerging
economies
- Output in mature markets will witness fairly anaemic growth rate of just 1-1.5% CAGR. Domestic steel demand
is expected to remain restrained in terms of the slow downstream end-using sector output development
(primarily automotive and construction). Export deliveries across the region to the affiliated re-rollers will
continue gathering weight. At the same time the export markets will be under constant pressure from the
cheaper Chinese material. Growing self-sufficiency coupled with bolstering protectionism will have further
downside effect on shares in the primary export markets across Southeast Asia
- The emerging markets are expected to enjoy growth rate of 9-9.5% CAGR. Domestic output is understood to be
directly related to country’s ability to adjust import regulation framework aimed to address cheaper Chinese
material flows. Governments retain a direct/indirect interest and steelmaking continues to be seen as in the
national interest supporting new domestic market entrants in tackling conversion costs disadvantage due to
rising labour and energy costs
- Share of the Chinese material maintaining a stable export volume share across the region in the near to mid-
term at close to and at times even below marginal costs, before reducing in the long-term to coincide with
improved management of China’s domestic supply/demand balance
- Chronic ramping up of import penetration resulted in the one of the largest new planned capacity pipelines
worldwide. With the condition of favourable business environment, new supply growth from the newly formed
manufacturing hubs is expected to outpace demand growth rate in these markets. Therefore as demand grows
(albeit more slowly), utilisation rates should improve.
Key Findings - Demand
14 of 19
- Intensifying urbanisation due to bolstered investment availability, expansion of the manufacturing
base, picking up residential construction as well as improving private consumption is posed to lend a
strong support to robust steel consumption expansion across the emerging Southeast Asian
economies. Indonesia, Thailand and Vietnam are expected to witness strongest market size gains in
the region
- Total finished steel demand climbing towards 250 million tonnes in 2020
- Despite robust improvement in regional self sufficiency projected, number of markets are expected
to remain reliant on steel products import going forward, namely Philippines, Myanmar and Laos
0% 2% 4% 6% 8% 10% 12% 14% 16%
Japan
Australia
Taiwan
South Korea
Total SE Asia
Other Asia
Malaysia
Philippines
Bangladesh
Thailand
Vietnam
Indonesia
Laos
Myanmar
Shipments
0%2%4%6%8%10%12%14%16%18%
Consumption
Shipment vs consumption growth rates by country 2013-2020, % CAGR
Key Findings – Price (1)
15 of 19
• Steel price level is a function of cost of raw material, market balance, level of market protectionism as
well as corporate strategy & steel industry consolidation development
- Price settlement mechanism in Southeast Asia is heavily reliant on marginal costs incurred by Chinese
producers. As Chinese growth slows, we expect that for at least the next five years, China will
continue to export significant volumes at close to and at times even below marginal costs. This will
keep steel prices in line with iron ore/coal price movements
- Iron ore prices are forecasted to trend negatively going forward on excessive new capacity being
brought online. Over 2014-2015, particularly as this is forecast to coincide with slowing steel demand
growth, MBR expects iron ore fines pricing to fall to below $100/tonne cif China resulting in output
cuts.
- Coking coal is forecast to trade in a narrow range of $110-125/tonne fob Australia over 2014-17 with
a slight improvement towards $150/tonne fob later in the forecast period on current prices (Q2 2014)
already below marginal costs of production in some areas and being further supported by an upturn
in Indian demand over 2015-20.
Key Findings – Price (2)
16 of 19
• Price forecast out to 2024 are provided in the report.
• Chinese prices will dominate SE Asian cfr prices over the forecast period. However, much of the cost
base (in South Korea and Japan for example) is EAF-based and is thus dependent on scrap pricing
trends
- Marginal price levels of the Chinese producers have denied prospects of export share gains in
Southeast Asian markets for Japanese and South Korean producers alike
- Regional producers e.g. Malaysia, Taiwan, Philippines, Vietnam etc. are somehow protected by
variable import tariff or AD regime that facilitates billet or scrap imports while partially excluding
finished product imports. We expect this to remain in place over the forecast period.
- However, China started to use re-classification of large square bar as billet and thus avoiding the
export tariffs extensively and becoming a major exporter of “billet” despite export tariffs of 25%
- This is not expected to change without a change in the VAT tariff regime, which MBR assumes will not
happen. As such, Chinese mills will continue to use price to gain market share as they increasingly
improve their quality and grade offerings.
MBR has published this timely strategic long-term market study offering exclusive data,
insights and expert support into the following:
• New and exciting data on the region’s emerging markets that steel associations under-
report on
• Up-to-date insights and perspectives into China and how this will affect Southeast Asia
steel prices
• The most accurate and independent assessment of current and future supply, demand and
market prices by steel product out to 2020 for each Southeast Asian market
• Geo-political analysis of each market and how this will determine local and regional steel
industry dynamics
• Steel investment risk profiling for each Southeast Asian market. Southeast Asian Economic
Outlook: with key perspectives on China and India
• The most detailed dissection anywhere of current and future sources of steel demand by
country out to 2020
• SWOT and market share analysis of all the key producers, strategic plans and the future
supply-side picture out to 2020
• Detailed breakdown of steel consuming sectors for each market, including construction,
shipbuilding by type and automotive forecasts by vehicle type out to 2020
• Access to our unique database of regional domestic, import and export market price
assessments by product out to 2020
17 of 19
If you have any questions contact us on +44 (0) 20 7779 8000 or email marketing@metalbulletinresearch.com
When you need customised solutions from metal experts for
your projects, Metal Bulletin Research provides all the global and
regional insight you need to proceed with confidence.
Consultancy services MBR provide:
• Bankable feasibility and financing studies
• Price and market forecasting services
• Strategic consulting services to maximise commercial
opportunities
• Purchasing advice in minimising key input costs
• Market analysis, surveys and research on new products or
for specific regions
• Competitor intelligence
Consultancy Services
18 of 19
Thank you!
If you have any questions regarding this publication or another,
do not hesitate to contact Roman Kucinskij at:
Email: rkucinskij@metalbulletin.com
Telephone: +44 20 7827 6421
www.metalbulletinresearch.com

SE_Asian_Steel_Raw_Materials_Webcast

  • 1.
    1 Southeast Asia Steel:Key trends and prospects amid the dominance of China July 2014 Roman Kucinskij Metal Bulletin Research
  • 2.
    MBR’s global focuson steel and steel raw materials sectors Since the 90’s MBR began market research into the global steel and steel raw material industry via our monthly Trackers that analyse the markets. Today MBR is one of the leading market research providers to global steel, aluminium and steel raw materials markets. Company published a number of different metals dedicated regular publications. Soon enough we realised the growing interest from the industry for trustworthy independent source of market intelligence. MBR started to address such demand by offering the long term strategic market studies. MBR consultancy is a well acclaimed provider of the bespoke strategic market studies enforced by extensive global contact base, meticulous and proprietary research techniques as well as highly regarded team of consultants backed by years of professional expertise 2 of 19
  • 3.
    The report An in-depthindustry driven approach resulted in a detailed strategic forecast study of Southeast Asian steel and steel raw materials sectors - A seven-year outlook of the Southeast and East Asian finished steel and steel raw materials markets out to 2020. The comprehensive top to bottom approach allowed MBR to outline a detailed historic & forecast production, net trade, and consumption by country and by individual products. There are also detailed insights in the individual steel end-using sectors (by country) as well as analysis of the steel raw materials markets. MBR estimates it covers more than 95% of regional consumption and production - China’s role in the regional supply and issues of the surging boron containing steel exports - A comprehensive database of the antidumping tariffs imposed against steel products originated in each individual country - Insightful and easy to use analysis of the trade data - Report also contains profiles of more than 150 companies operating on the market, analysis of their corporate activity, mill-by-mill capacity, in addition to lots of exclusive, proprietary data obtained through over 6 months of the rigorous research process 3 of 19
  • 4.
    Southeast Asian finishedsteel market overview (1) Southeast Asian finished steel consumption 2008-2013, (000 tonnes) Southeast Asian finished steel consumption 2013 4 of 19 0 50,000 100,000 150,000 200,000 250,000 2008 2009 2010 2011 2012 2013 Laos Myanmar Bangladesh Other SE Asia Philippines Australia Malaysia Indonesia Vietnam Thailand Taiwan South Korea Japan Source: MBR flats 57.4% longs 42.6% Source: MBR - We are looking into Southeast Asian and East Asian markets, excluding China and India. There are 10 finished steel products analysed. In addition we include semis and the overview of crude steelmaking - Flat products dominate total consumption, predominantly prevailing in the developed economies with highly developed end-use sectors - Total finished steel consumption peaked at just above 213 million tones in 2013 - Finished steel output have been trending sideways over the last few years inching higher towards 211 million tonnes in 2013
  • 5.
    Southeast Asian finishedsteel market overview (2) 5 of 19 - Demand composition in terms of products for developed and emerging markets tells two different stories - Mature markets demonstrated stable demand structure dominated by flat products on extensive mid- stream capacity being present - Steel demand in the investment driven emerging economies is being driven by construction sector. This trend has been bolstered considerably over the last five years. Growing supply of cheap imports forced local processors to shift towards imported feedstock. Midstream processors remain the backbone of the steel sector across the Southeast Asia Finished steel consumption in EMERGING markets 2008 vs. 2013 Rebar 26.8% HRC 16.5% Wire rod 11.3% HR plate 11.1% CR Coil 9.6% Galvanised 8.7% HR Section 5.4% Merchant bar 5.3% Tinplate 2.6% Colour coated 2.5% Source: MBR Rebar 24.1% Wire rod 14.7% HRC 14.0% CR Coil 11.2% Galvanised 10.1% HR plate 10.0% Merchant bar 5.7% HR Section 5.0% Colour coated 3.1% Tinplate 2.1% Source: MBR Finished steel consumption in DEVELOPED markets 2008 vs. 2013 HRC 20.3% HR plate 18.5% Rebar 15.9% Galvanised 10.2% Merchant bar 8.4% Wire rod 8.3% HR Section 8.2% CR Coil 7.5% Colour coated 2.0% Tinplate 0.6% Source: MBR HRC 24.0% HR plate 16.4% Rebar 14.9% Galvanised 10.6% Merchant bar 8.4% Wire rod 8.2% HR Section 7.5% CR Coil 7.3% Colour coated 2.0% Tinplate 0.6% Source: MBR
  • 6.
    Regional Economic Background 6of 19 - Markets within the Southeast Asian region = one of the strongest growth rates globally - One of the strongest macroeconomic fundamentals projection, including GDP, population growth, bolstering urbanisation, growing consumption - At the same time, the developed market of East Asia (Japan, S.Korea, Taiwan) are facing severe headwinds in terms of economic development, translating into anaemic growth - Steel is the quintessential underlyning material necessary for economic expansion in emerging and mature markets alike China Japan Indonesia South Korea Taiwan Malaysia Philippines Vietnam Thailand Bangladesh Myanmar Laos New Zealand 0.0% 2.0% 4.0% 6.0% 8.0% 10.0% -0.5% 0.0% 0.5% 1.0% 1.5% 2.0% IPgrowth,%y-on-y Population growth, % y-on-y Australia Source: MBR, various The size of the bubble represents GDP PPP in 2020 in USD bns Location of China data point Location of Japan data point 11.5 10.2 8.0 7.9 6.4 5.0 4.1 3.5 2.2 1.8 1.7 10.9 9.6 8.5 7.3 4.8 2.6 2.2 1.5 9.7 5.9 4.8 1.6 2.1 5.6 4.0 4.0 1.9 -0.1 -1.8 6.3 10.8 4.0 1.4 0.9 0.0 1.7 0.9 7.2 6.6 4.9 6.3 4.9 3.9 5.1 5.1 2.5 2.8 3.4 5.1 8.3 7.8 4.4 2.0 1.4 4.0 3.8 -4 -2 0 2 4 6 8 10 12 14 AverageIndustrialProductionGrowth,% 2000-2007 2008-2013 2014-2020 Source: MBR, various South East Asia (inc. China) Rest of the World
  • 7.
    Southeast Asian steelindustry in perspective (1) 7 of 19 Philippines, 106% Malaysia, 205% Indonesia, 154% Australia, 182% New Zealand, 210% Vietnam, 152% Thailand, 174% Myanmar, 9% Bangladesh, 111% Nepal, 46% Cambodia, 0% Taiwan, 230% Japan, 277%South Korea, 189% Laos, 0% Singapore, 24% Source: MBR Country’s capacity sufficiency ratio Imports penetration 80-100% 50-79% 30-49% <29% - Uneven market development patterns with a mature industry in East Asia and emerging in the rest of the region - Underdevelopment of the Southeast Asia market (EAF steelmaking, midstream overcapacity, long structural products orientation, high cost of production, industry limitations) - Rise of China (overcapacity, growing pressure from cheap supply of commoditised material, “boron steel”) - Regional developments in SE Asia (affiliation, upstream capacity expansion, limited exposure to higher quality products)
  • 8.
    Southeast Asian steelindustry in perspective (2) 8 of 19 - Regional supply is highly consolidated in the mature markets of Japan, South Korea and Taiwan - Overall Southeast Asia is one of the fastest expanding regions for steelmaking industry (in terms of steel demand and output capacity) - Very strong new production capacity pipeline - Huge diversity in terms political and financial situation/as well as risk profiles throughout the regional countries - Opaque future for regional steel producers because of China despite great prospects and fundamentals Japan 57.8% South Korea 27.4% Taiwan 8.9% Other Asia 2.7% Indonesia 1.8% Vietnam 1.4% Source: MBR Total BOF capacity - 166.3 m tonnes Japan 53.1% South Korea 28.2% Taiwan 7.5% Other Asia 4.2% Indonesia 3.5% Thailand 2.1% Malaysia 1.3% Source: MBR Total slab capacity - 153.6 m tonnes
  • 9.
    China’s steel industrypotential 9 of 19 - Largest capacity globally - about 1 billion tpy of crude capacity - Country’s steel sector is plagued by overcapacity and associated debt problems - Government continuously proclaims actions against excess capacity - At the same time, subsidisation export support is still in place - Despite that, total export volumes are trending negatively way below recorded pre-crisis levels - 40% of total China’s exports are addressed to Southeast Asia 0 5,000 10,000 15,000 20,000 25,000 30,000 35,000 40,000 45,000 50,000 2006 2007 2008 2009 2010 2011 2012 2013 000tonnes Wire rod HR sections Merchant bar Rebar HDG Colour Coated Tinplate CR Coil HR Plate HRC Source: MBR, Customs statistics Finished steel Chinese carbon steel by product exports (official data not including boron) 2006- 2013, ('000 tonnes)
  • 10.
    China’s factor or“the boron steel conundrum” 10 of 19 - At the same time, market players are facing expanding share of the boron- containing steel deliveries - Its scale and impact on the markets are vaguely addressed due to opaque nature of the transaction, problematic compatibility with international HS system - Undoubtedly, the use of boron implies that the real export volumes – unofficially as opposed to what is officially reported in customs statistics – is substantially higher - MBR assessed the scale of boron steel deliveries for major commoditised products on a country-by-country basis. As a result, updated realistic projections of the deliveries from China are provided in the report 0 100 200 300 400 500 600 700 800 900 1,000 2007 2008 2009 2010 2011 2012 2013 000tonnes Official statistics Boron steel Source: MBR, Customs statistics 0 50 100 150 200 250 300 350 400 450 500 2007 2008 2009 2010 2011 2012 2013 000tonnes Official statistics Boron steel Source: MBR, Customs statistics Thai wire rod imports 2007 - 2013 ('000 tonnes) Vietnamese wire rod imports 2007 - 2013 ('000 tonnes)
  • 11.
    Country example -Vietnam 11 of 19 Company Location Product Start-up Capacity ('000t) Capex ($m) Supplier Formosa Heavy Industries Vung Ang Slab 2015 2,700 n/a Siemens VAI Formosa Heavy Industries Vung Ang Billet 2015 1,200 n/a Siemens VAI Formosa Heavy Industries Vung Ang Bloom 2015 1,500 n/a Siemens VAI Formosa Plastics Group Vung Ang, phase I BF, BOF, HRC, wire rod 2015 7,000 10,000 n/a Formosa Plastics Group Vung Ang, phase II BF, BOF, HRC, wire rod 2020 21,850 10,000 n/a JFE Steel :: E United Dung Quat Econ. Zone EAF, HRC 2016 3,500 n/a n/a Kyoei Steel Vietnam Company (KSVC) Hanoi EAF 2015 500 n/a n/a Kyoei Steel Vietnam Company (KSVC) Hanoi Rebar / wire rod 2015 500 n/a n/a Posco Phu My HRC 2015 3,000 n/a n/a Posco Phu My HDG 2015 400 n/a n/a Posco Specialty Steel Phu My EAF 2014 1,000 620 n/a Posco Specialty Steel Phu My Sections 2014 1,000 800 n/a SeAH Steel Dong Nai ERW 2014 50 n/a n/a Southern Steel Sheet Corp Dong Nai Colour coat 2014 200 n/a n/a Thai Nguyen Iron and Steel (TISCO) Thai Nguyen EAF 2016 500 383 n/a Thai Nguyen Iron and Steel (TISCO) Thai Nguyen Billet 2016 500 n/a n/a Ton Dong A (TDA) Binh Duong CRC 2014 200 n/a n/a Ton Dong A (TDA) Binh Duong HDG 2014 200 n/a n/a Ton Dong A (TDA) Binh Duong Colour coat 2016 120 n/a n/a Ton Dong A (TDA) Binh Duong HDG 2016 150 n/a n/a Vietnam Steel / Kunming Lao Cai BF, BOF 2013 500 n/a n/a Vietnam-China Mineral Resources Lao Cai EAF 2015 1,000 307 n/a Vina Kyoei Steel Vung Tau EAF 2014 500 200 n/a Vina Kyoei Steel Vung Tau Rebar 2014 100 n/a n/a Vina Kyoei Steel Vung Tau Wire rod 2014 400 n/a n/a Vina Kyoei Steel Vung Tau Billet 2014 500 n/a n/a Source: MBR New capacity in Vietnam (000 tonnes)
  • 12.
    Country example -Vietnam Vietnamese CR coil market ('000 tonnes) 12 of 19 2008 2009 2010 2011 2012 2013 Shipments 432 631 1,720 1,473 1,747 1,780 Net exports (720) (709) (46) 137 10 (221) Apparent consumption 380 522 828 153 916 1,119 % change consumption 37.2% 58.5% (81.5%) 498.9% 22.2% Source: Companies, customs data, MBR 2008 2009 2010 2011 2012 2013 Off-Highway 1 1 1 1 1 1 Automotive 6 6 8 6 7 6 Shipbuilding 0 0 0 0 0 0 Construction 123 170 270 48 299 367 Other 250 346 548 98 608 745 Apparent consumption 380 522 828 153 916 1,119 % change consumption 37.2% 58.5% (81.5%) 498.9% 22.2% Source: MBR Vietnamese CR coil demand split by end-use sector ('000 tonnes)
  • 13.
    Key Findings -Supply 13 of 19 • Total Southeast Asian finished steel output is expected to peak at above 260 million tonnes in 2020. Production growth rate is forecasted at about 2.5-3% CAGR. Growth pattern will be different for mature and emerging economies - Output in mature markets will witness fairly anaemic growth rate of just 1-1.5% CAGR. Domestic steel demand is expected to remain restrained in terms of the slow downstream end-using sector output development (primarily automotive and construction). Export deliveries across the region to the affiliated re-rollers will continue gathering weight. At the same time the export markets will be under constant pressure from the cheaper Chinese material. Growing self-sufficiency coupled with bolstering protectionism will have further downside effect on shares in the primary export markets across Southeast Asia - The emerging markets are expected to enjoy growth rate of 9-9.5% CAGR. Domestic output is understood to be directly related to country’s ability to adjust import regulation framework aimed to address cheaper Chinese material flows. Governments retain a direct/indirect interest and steelmaking continues to be seen as in the national interest supporting new domestic market entrants in tackling conversion costs disadvantage due to rising labour and energy costs - Share of the Chinese material maintaining a stable export volume share across the region in the near to mid- term at close to and at times even below marginal costs, before reducing in the long-term to coincide with improved management of China’s domestic supply/demand balance - Chronic ramping up of import penetration resulted in the one of the largest new planned capacity pipelines worldwide. With the condition of favourable business environment, new supply growth from the newly formed manufacturing hubs is expected to outpace demand growth rate in these markets. Therefore as demand grows (albeit more slowly), utilisation rates should improve.
  • 14.
    Key Findings -Demand 14 of 19 - Intensifying urbanisation due to bolstered investment availability, expansion of the manufacturing base, picking up residential construction as well as improving private consumption is posed to lend a strong support to robust steel consumption expansion across the emerging Southeast Asian economies. Indonesia, Thailand and Vietnam are expected to witness strongest market size gains in the region - Total finished steel demand climbing towards 250 million tonnes in 2020 - Despite robust improvement in regional self sufficiency projected, number of markets are expected to remain reliant on steel products import going forward, namely Philippines, Myanmar and Laos 0% 2% 4% 6% 8% 10% 12% 14% 16% Japan Australia Taiwan South Korea Total SE Asia Other Asia Malaysia Philippines Bangladesh Thailand Vietnam Indonesia Laos Myanmar Shipments 0%2%4%6%8%10%12%14%16%18% Consumption Shipment vs consumption growth rates by country 2013-2020, % CAGR
  • 15.
    Key Findings –Price (1) 15 of 19 • Steel price level is a function of cost of raw material, market balance, level of market protectionism as well as corporate strategy & steel industry consolidation development - Price settlement mechanism in Southeast Asia is heavily reliant on marginal costs incurred by Chinese producers. As Chinese growth slows, we expect that for at least the next five years, China will continue to export significant volumes at close to and at times even below marginal costs. This will keep steel prices in line with iron ore/coal price movements - Iron ore prices are forecasted to trend negatively going forward on excessive new capacity being brought online. Over 2014-2015, particularly as this is forecast to coincide with slowing steel demand growth, MBR expects iron ore fines pricing to fall to below $100/tonne cif China resulting in output cuts. - Coking coal is forecast to trade in a narrow range of $110-125/tonne fob Australia over 2014-17 with a slight improvement towards $150/tonne fob later in the forecast period on current prices (Q2 2014) already below marginal costs of production in some areas and being further supported by an upturn in Indian demand over 2015-20.
  • 16.
    Key Findings –Price (2) 16 of 19 • Price forecast out to 2024 are provided in the report. • Chinese prices will dominate SE Asian cfr prices over the forecast period. However, much of the cost base (in South Korea and Japan for example) is EAF-based and is thus dependent on scrap pricing trends - Marginal price levels of the Chinese producers have denied prospects of export share gains in Southeast Asian markets for Japanese and South Korean producers alike - Regional producers e.g. Malaysia, Taiwan, Philippines, Vietnam etc. are somehow protected by variable import tariff or AD regime that facilitates billet or scrap imports while partially excluding finished product imports. We expect this to remain in place over the forecast period. - However, China started to use re-classification of large square bar as billet and thus avoiding the export tariffs extensively and becoming a major exporter of “billet” despite export tariffs of 25% - This is not expected to change without a change in the VAT tariff regime, which MBR assumes will not happen. As such, Chinese mills will continue to use price to gain market share as they increasingly improve their quality and grade offerings.
  • 17.
    MBR has publishedthis timely strategic long-term market study offering exclusive data, insights and expert support into the following: • New and exciting data on the region’s emerging markets that steel associations under- report on • Up-to-date insights and perspectives into China and how this will affect Southeast Asia steel prices • The most accurate and independent assessment of current and future supply, demand and market prices by steel product out to 2020 for each Southeast Asian market • Geo-political analysis of each market and how this will determine local and regional steel industry dynamics • Steel investment risk profiling for each Southeast Asian market. Southeast Asian Economic Outlook: with key perspectives on China and India • The most detailed dissection anywhere of current and future sources of steel demand by country out to 2020 • SWOT and market share analysis of all the key producers, strategic plans and the future supply-side picture out to 2020 • Detailed breakdown of steel consuming sectors for each market, including construction, shipbuilding by type and automotive forecasts by vehicle type out to 2020 • Access to our unique database of regional domestic, import and export market price assessments by product out to 2020 17 of 19 If you have any questions contact us on +44 (0) 20 7779 8000 or email marketing@metalbulletinresearch.com
  • 18.
    When you needcustomised solutions from metal experts for your projects, Metal Bulletin Research provides all the global and regional insight you need to proceed with confidence. Consultancy services MBR provide: • Bankable feasibility and financing studies • Price and market forecasting services • Strategic consulting services to maximise commercial opportunities • Purchasing advice in minimising key input costs • Market analysis, surveys and research on new products or for specific regions • Competitor intelligence Consultancy Services 18 of 19
  • 19.
    Thank you! If youhave any questions regarding this publication or another, do not hesitate to contact Roman Kucinskij at: Email: rkucinskij@metalbulletin.com Telephone: +44 20 7827 6421 www.metalbulletinresearch.com