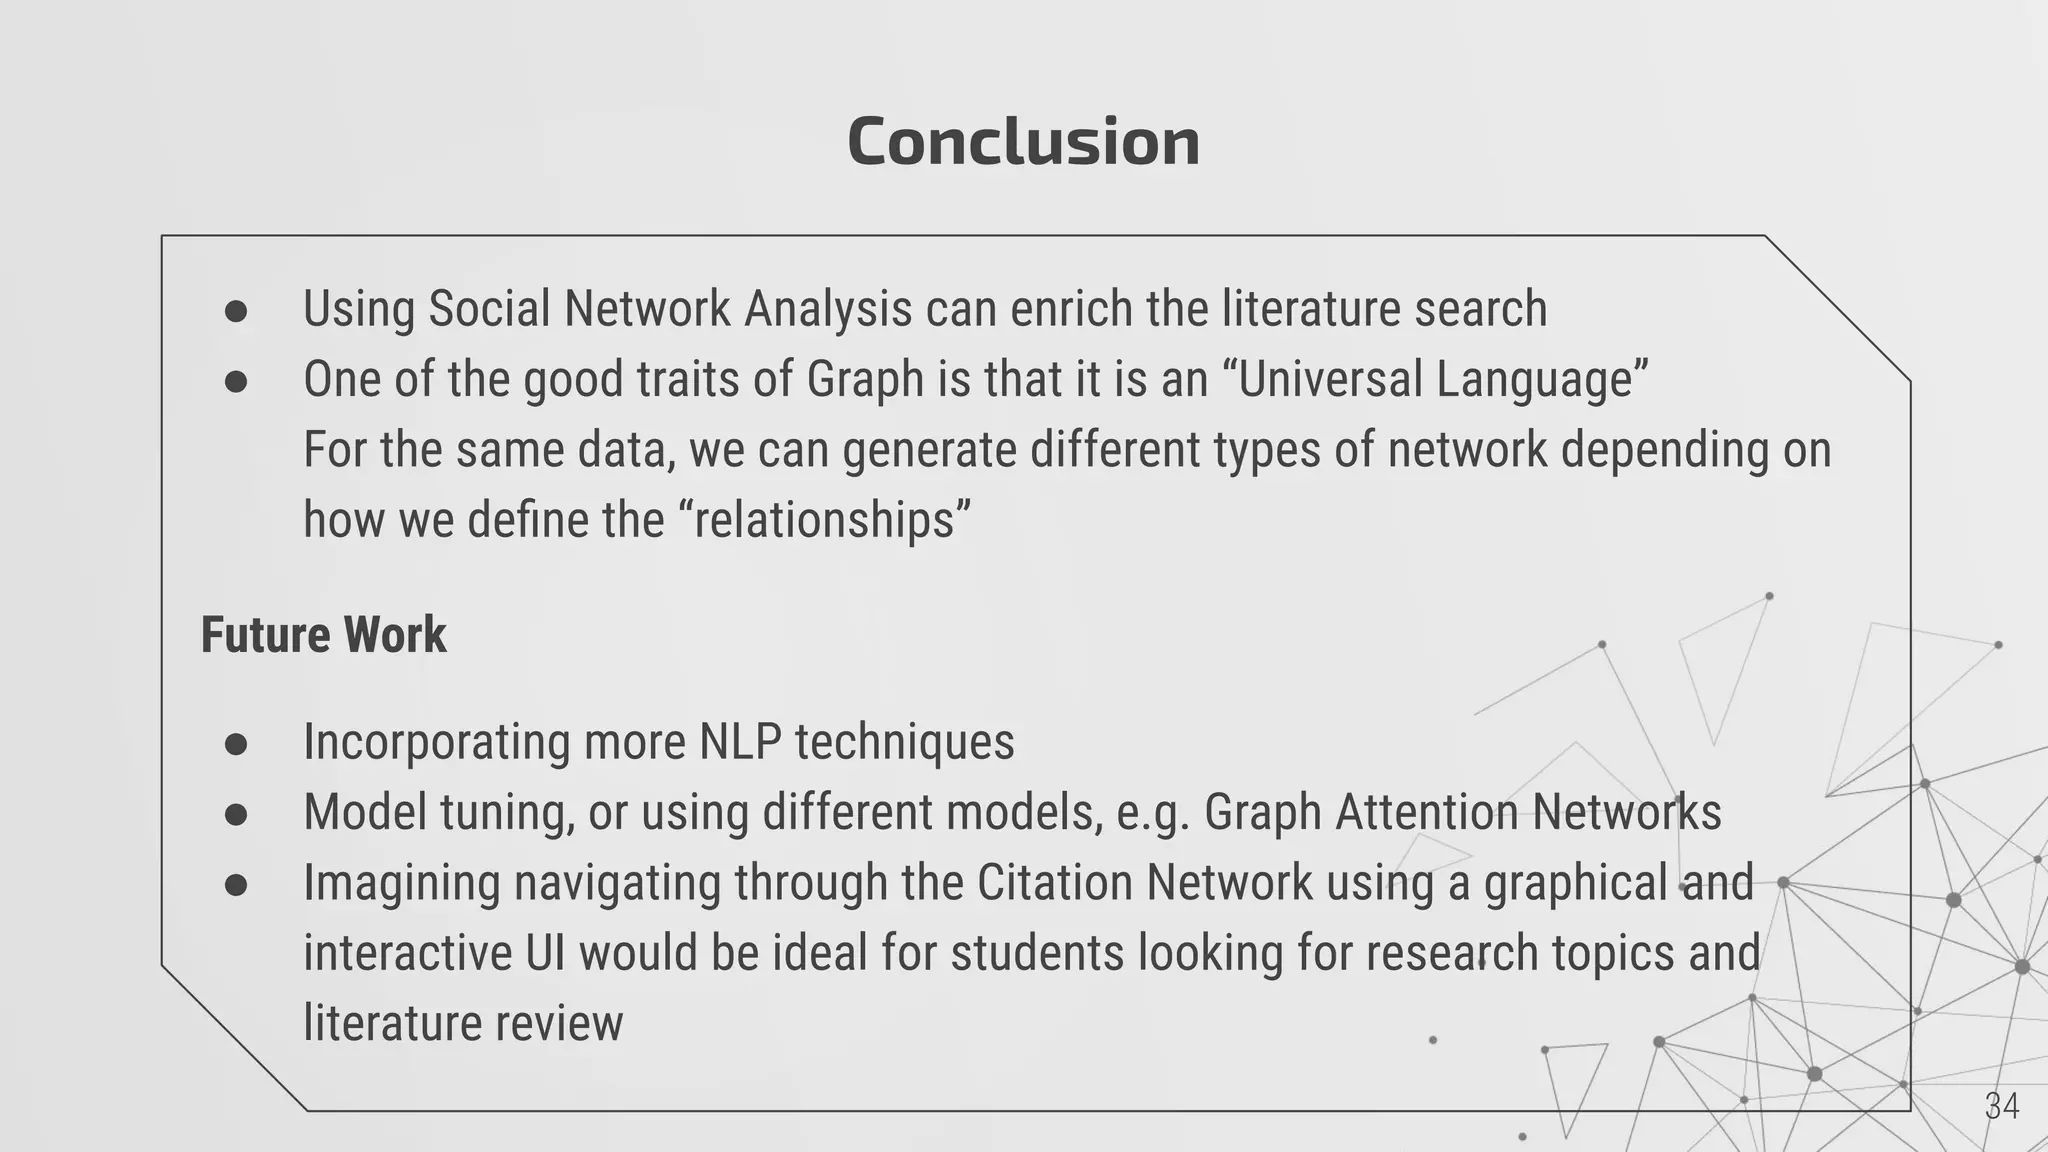
This document summarizes an analysis of the ArXiv dataset using social network analysis techniques. Key findings include:
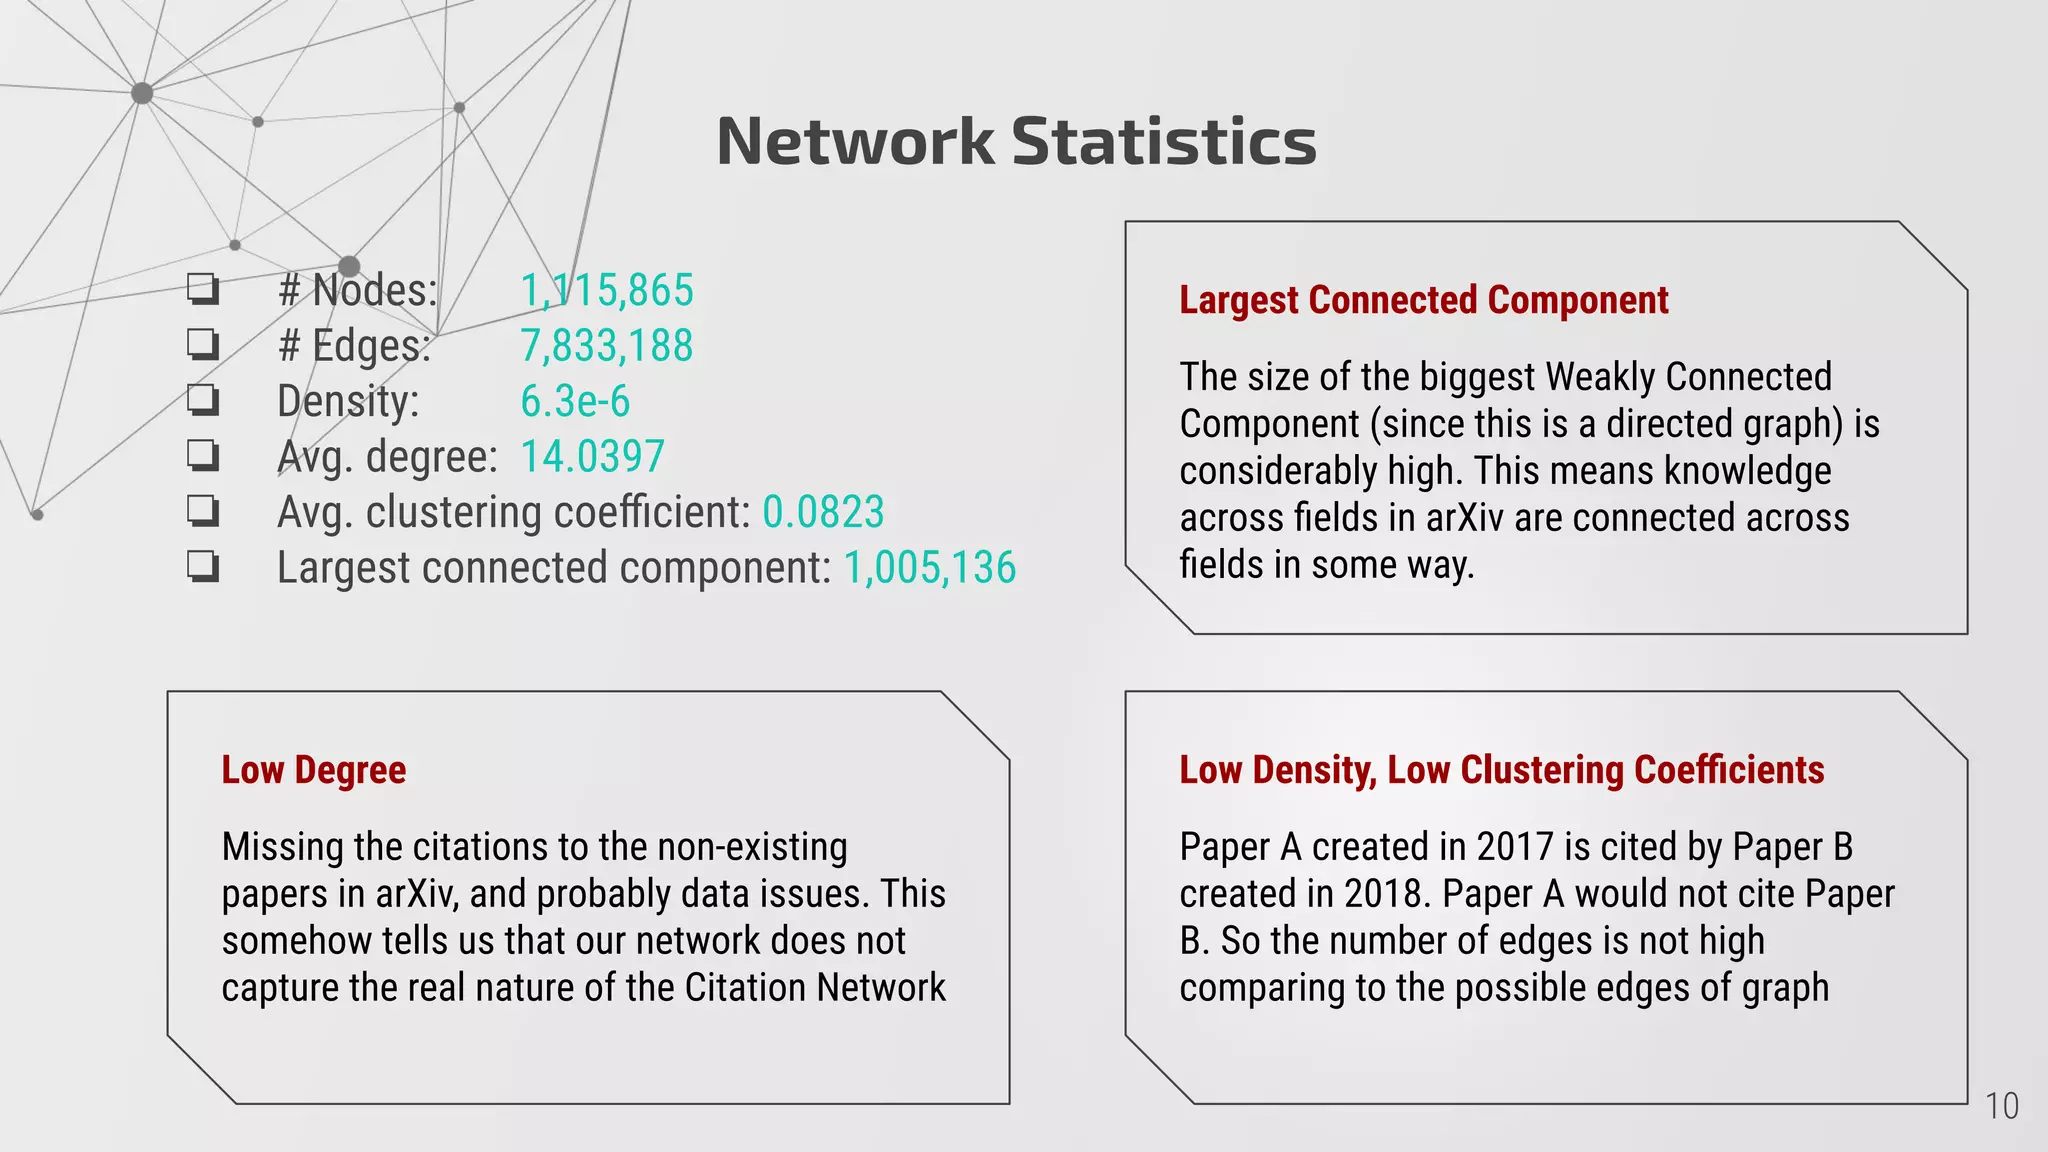
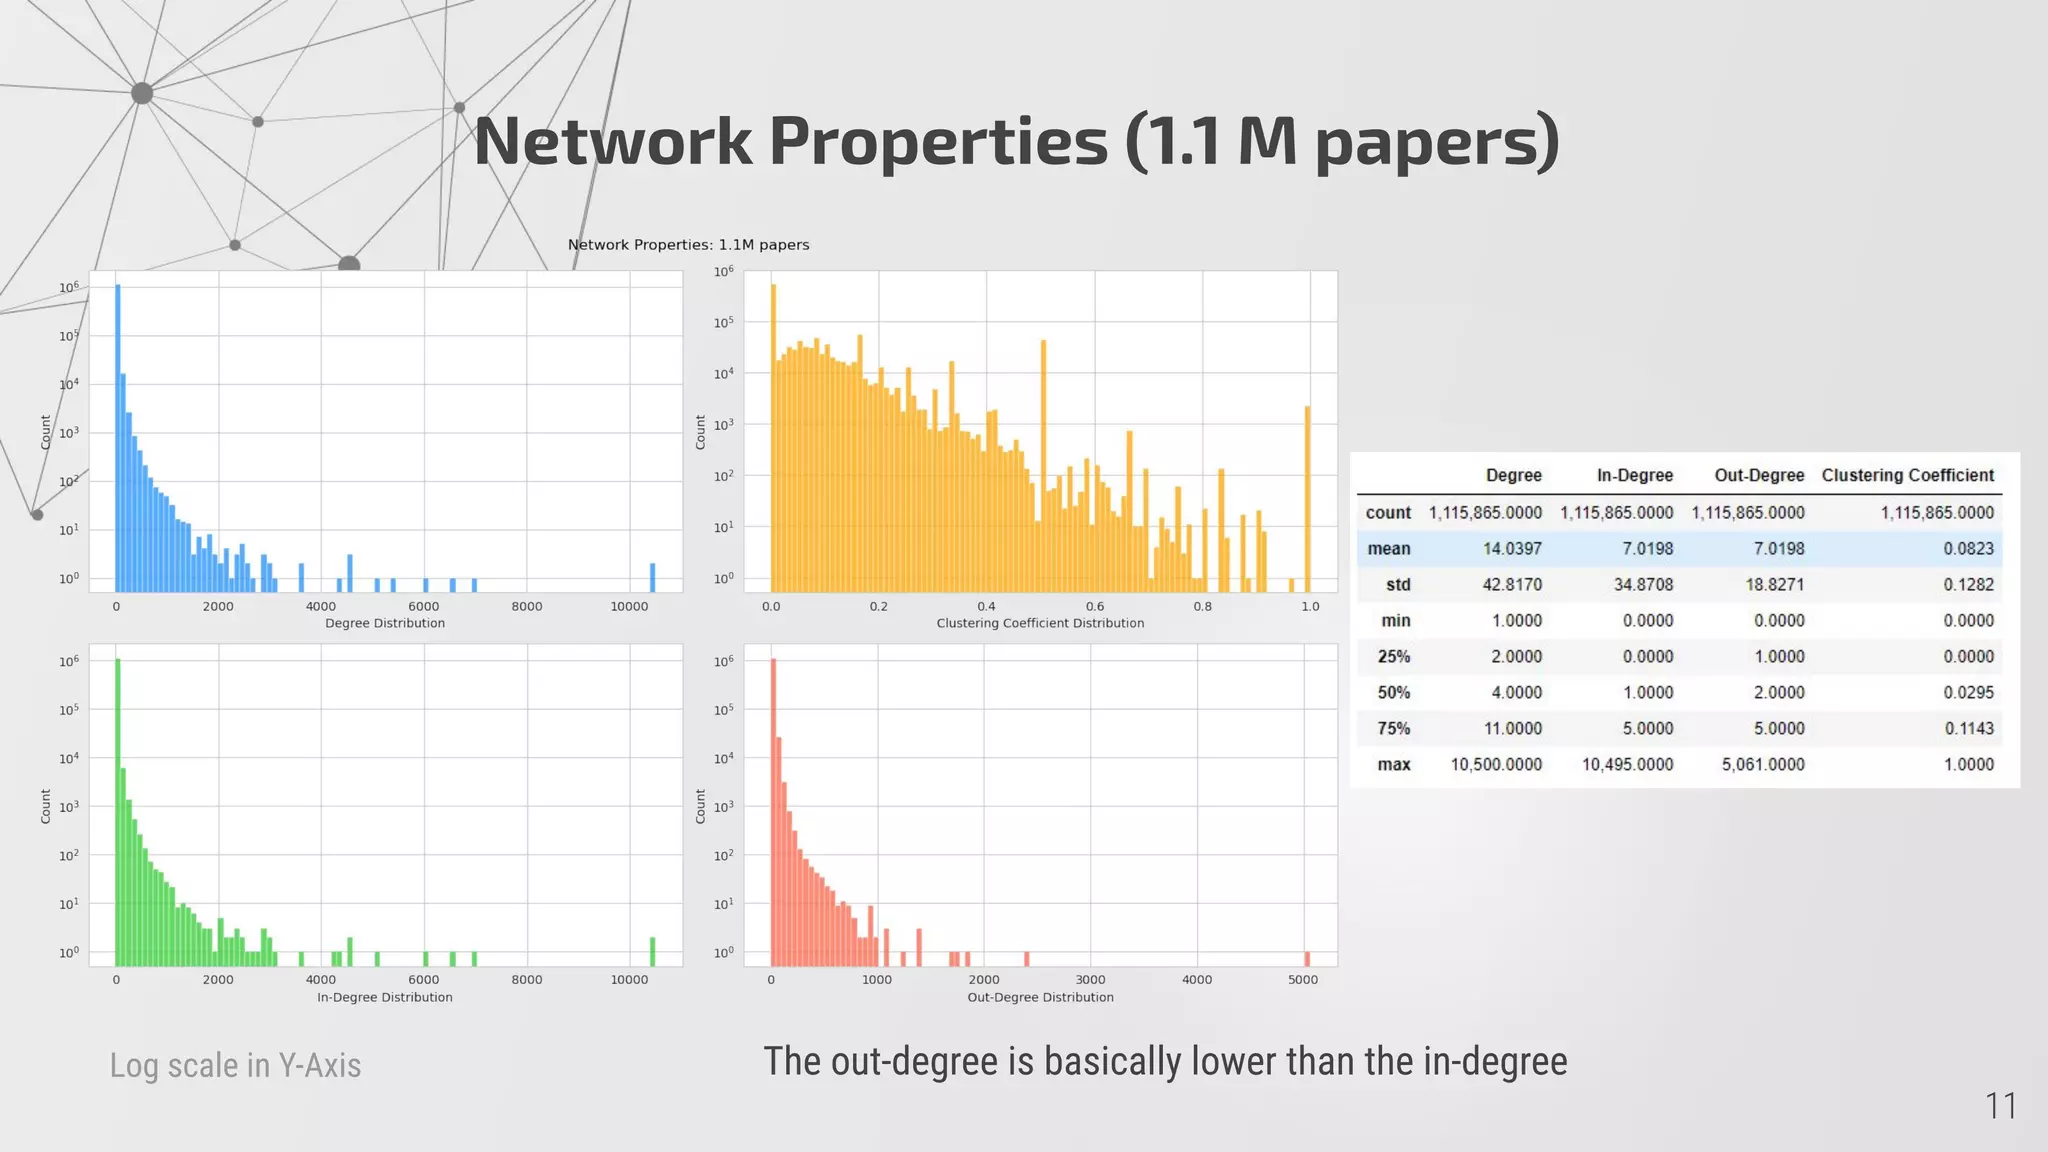
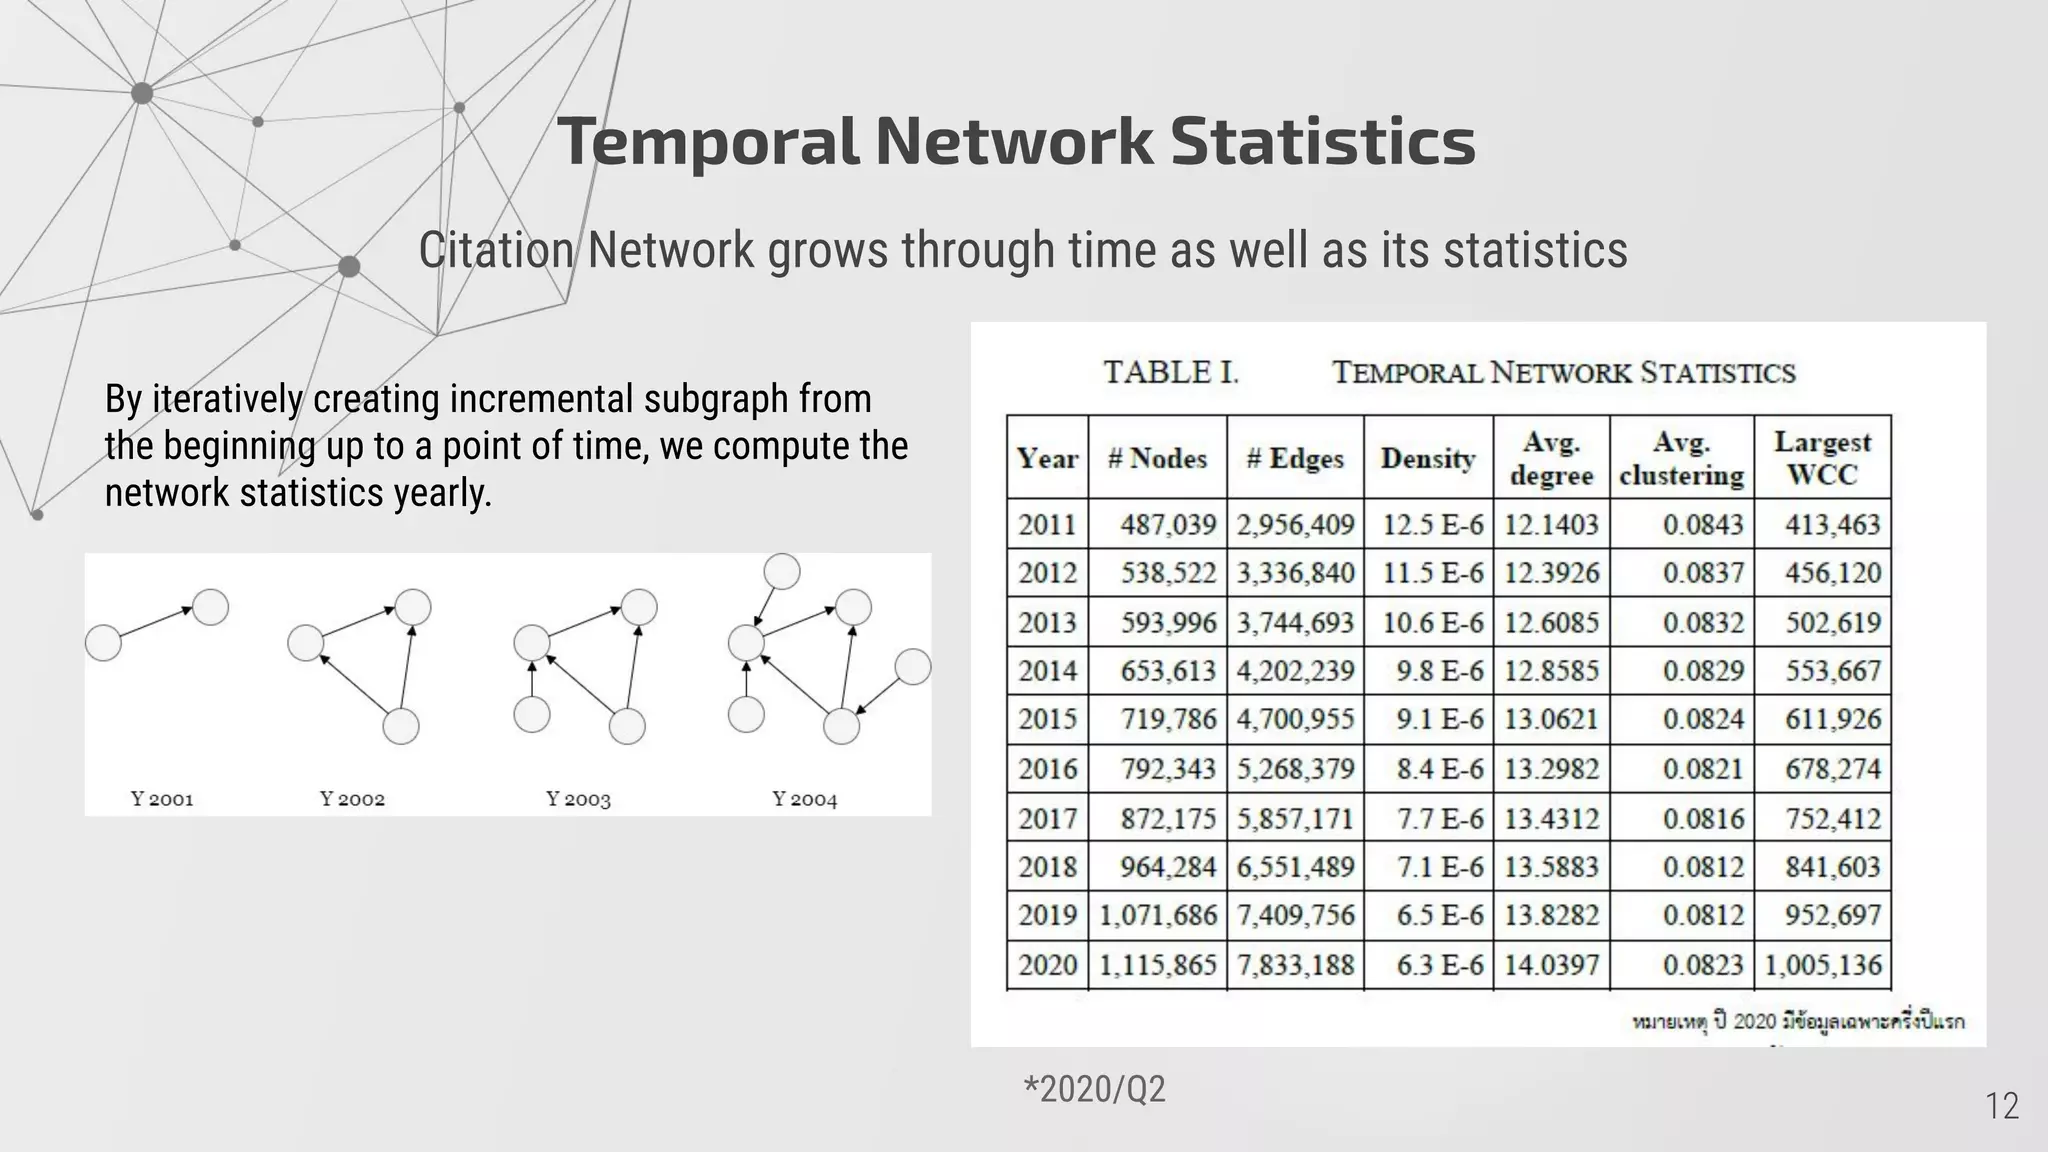
1) The ArXiv citation network has over 1 million nodes and 7 million edges, with a low average degree and clustering coefficient.
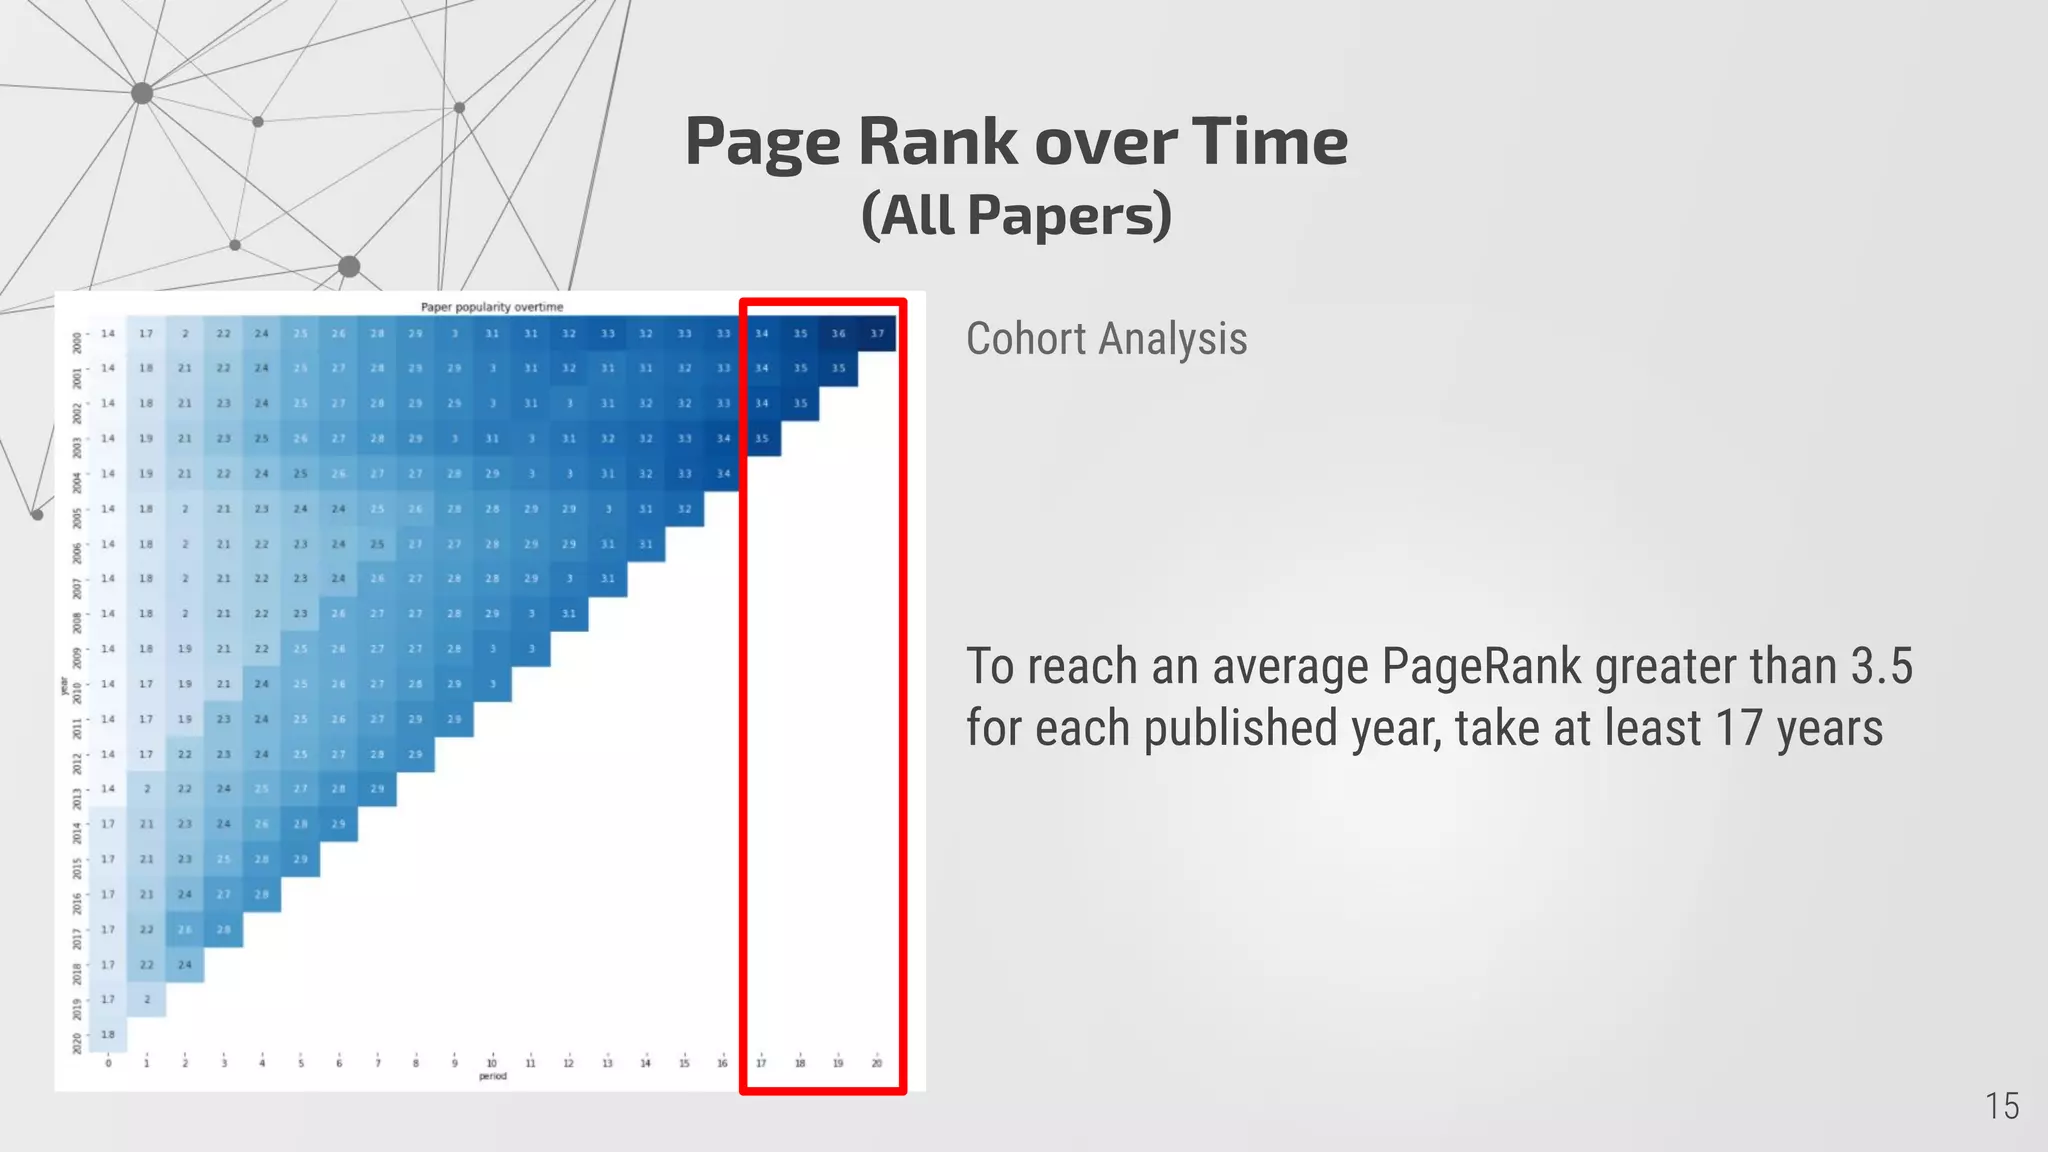
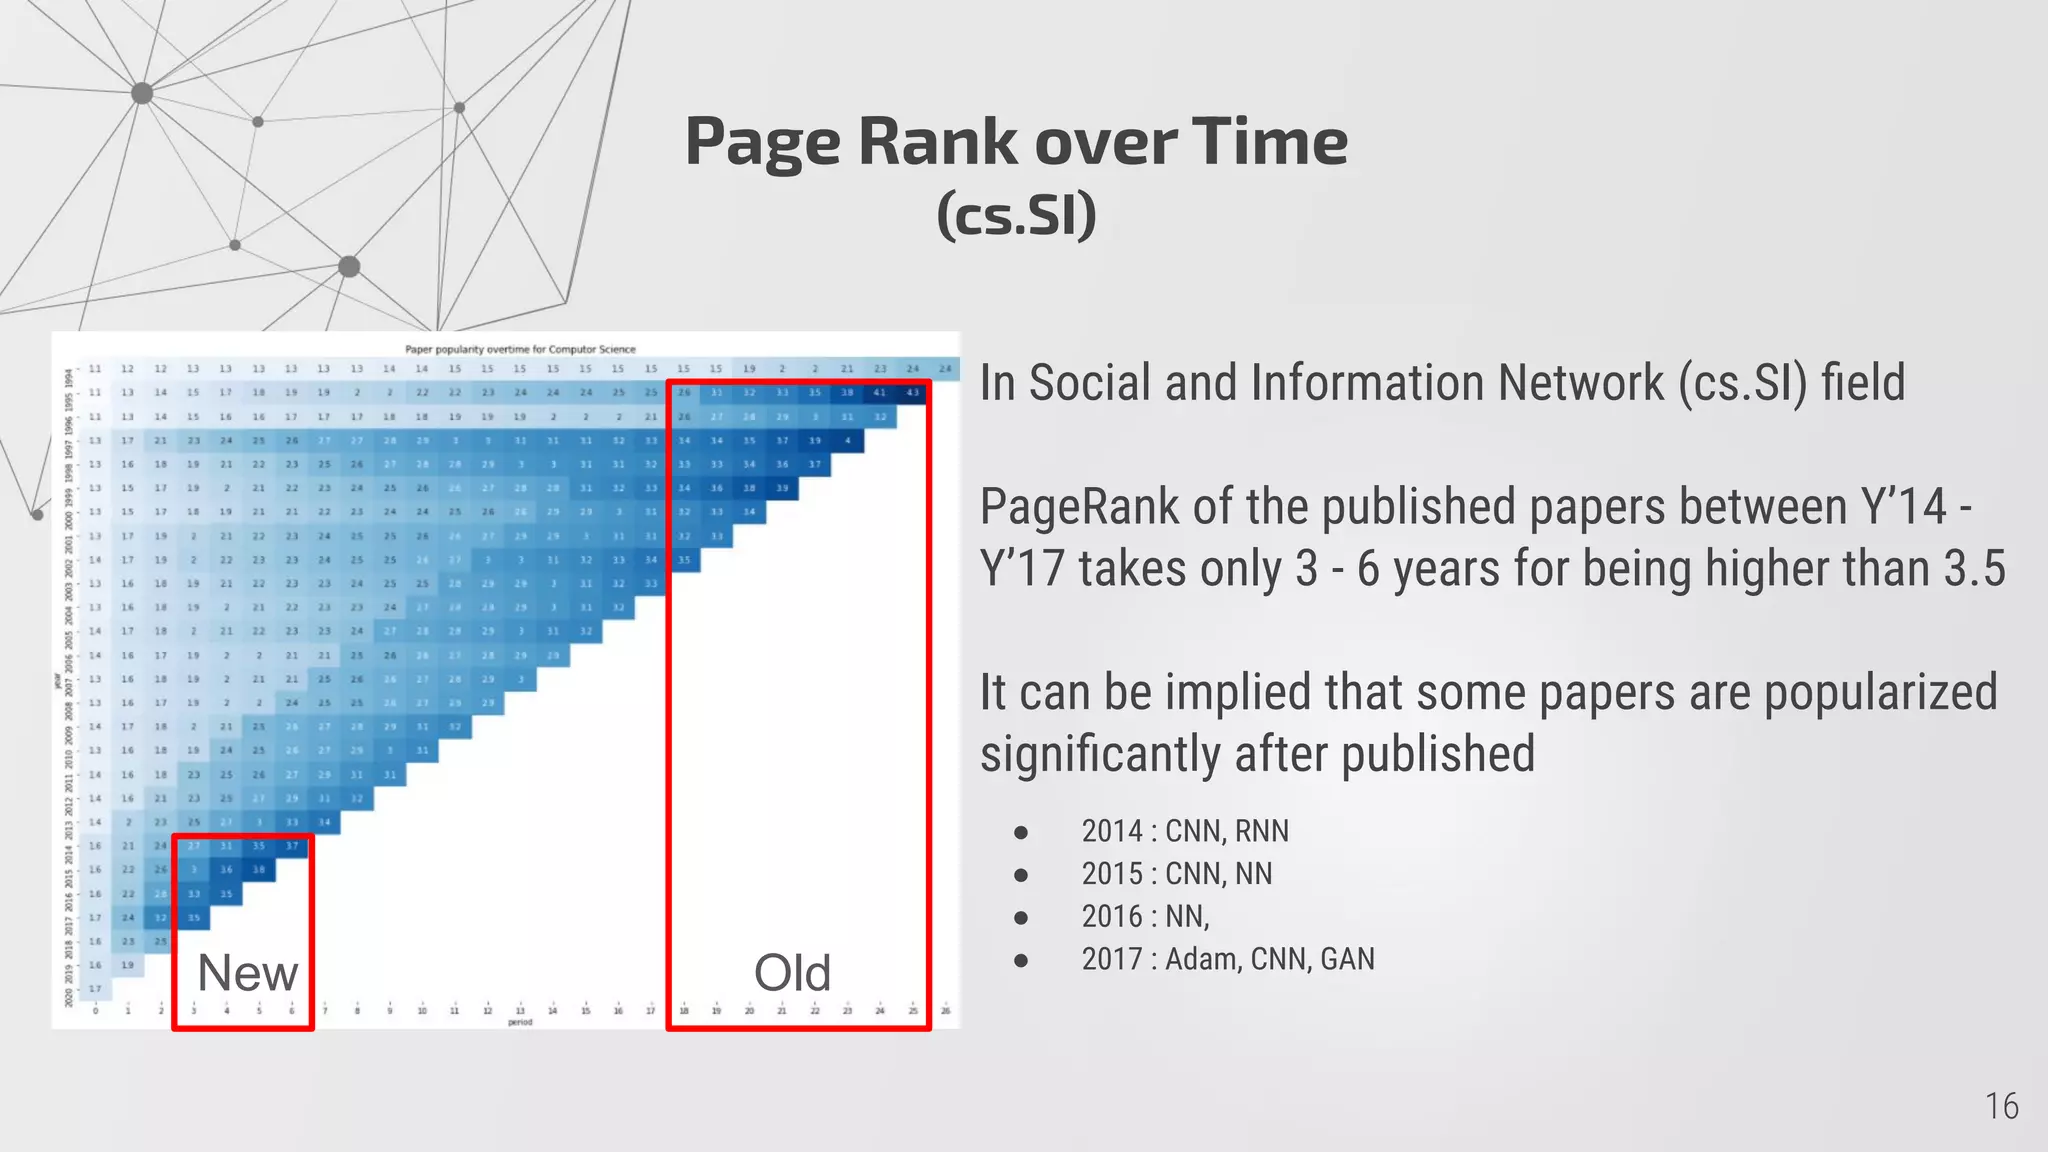
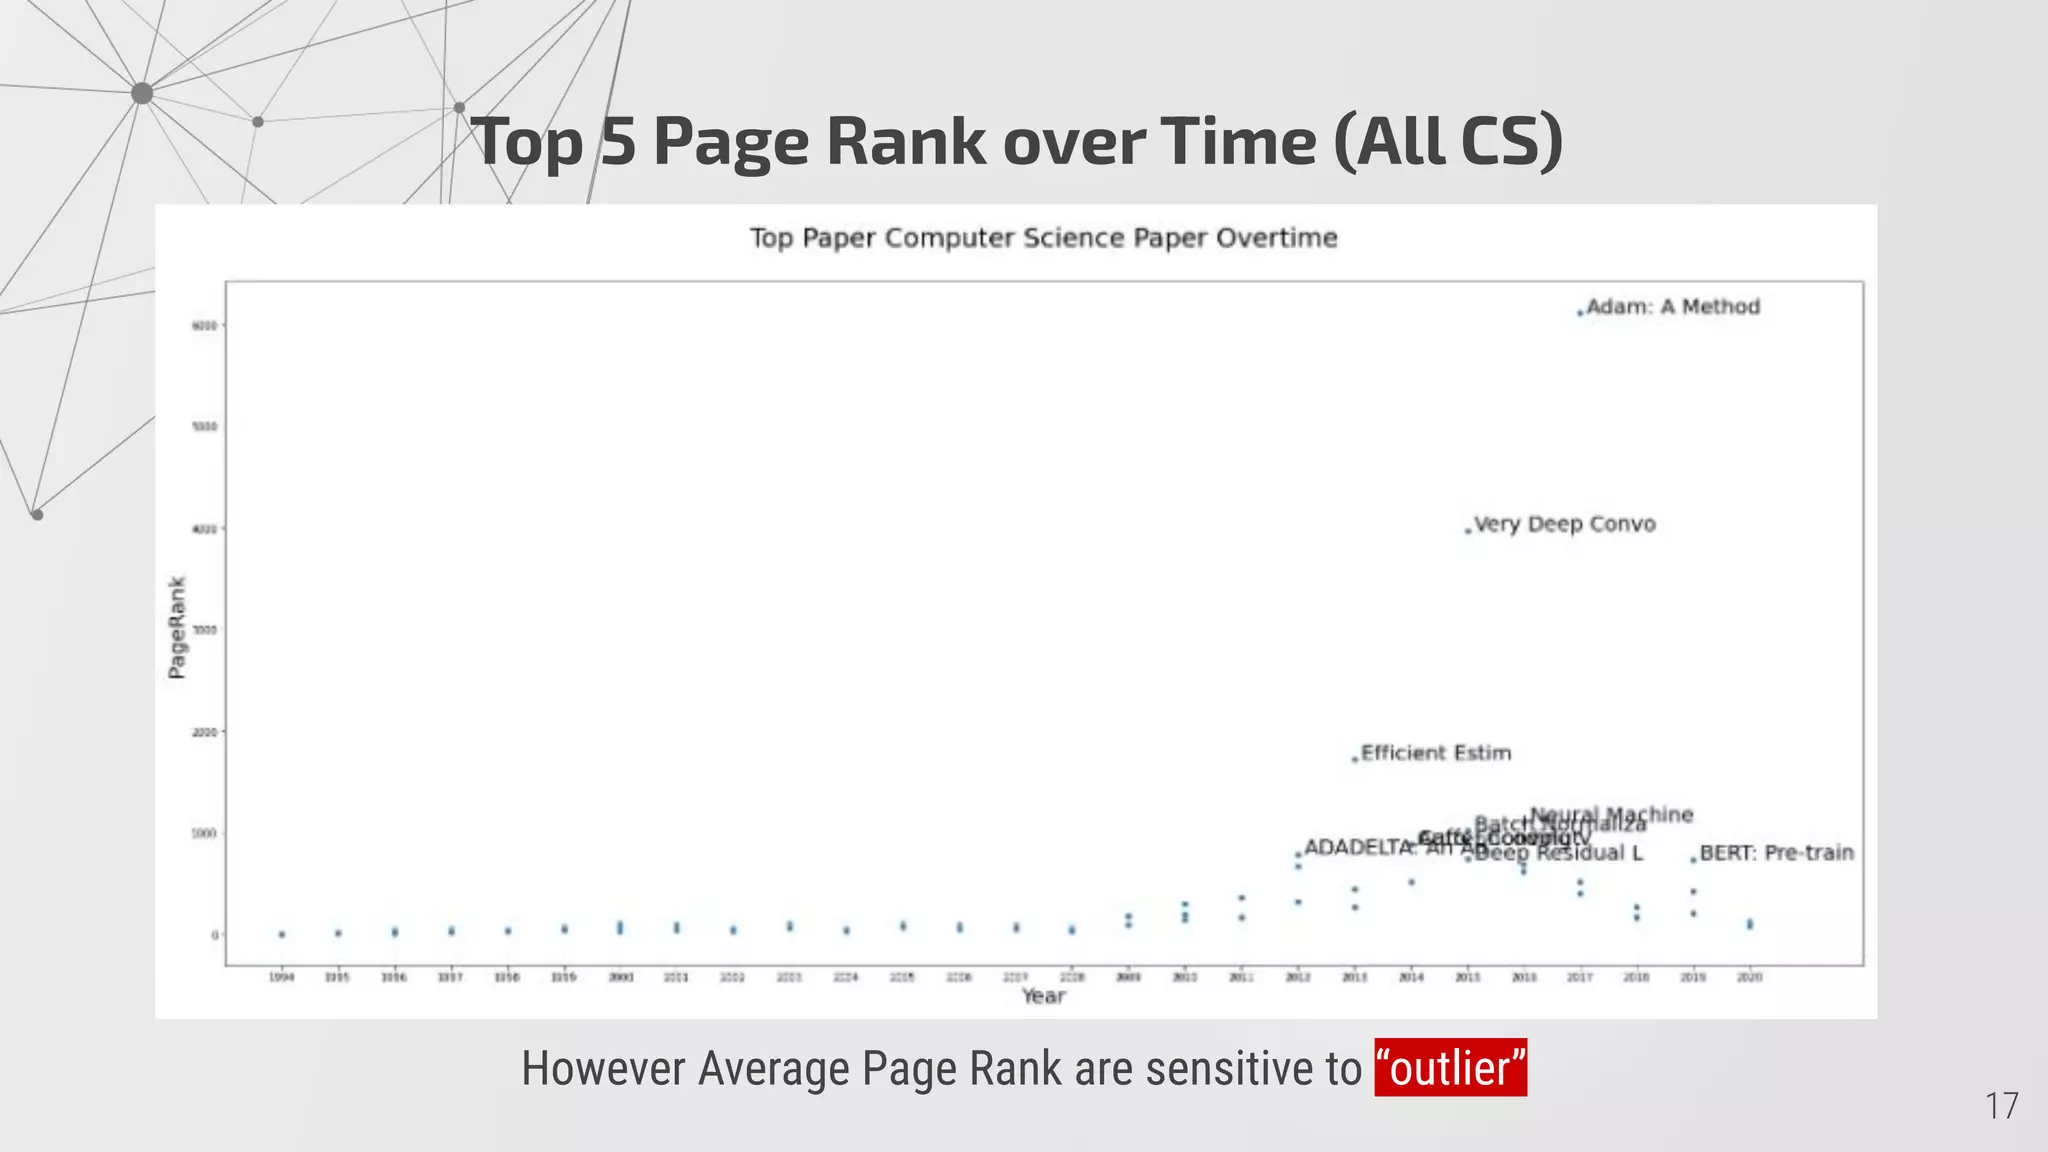
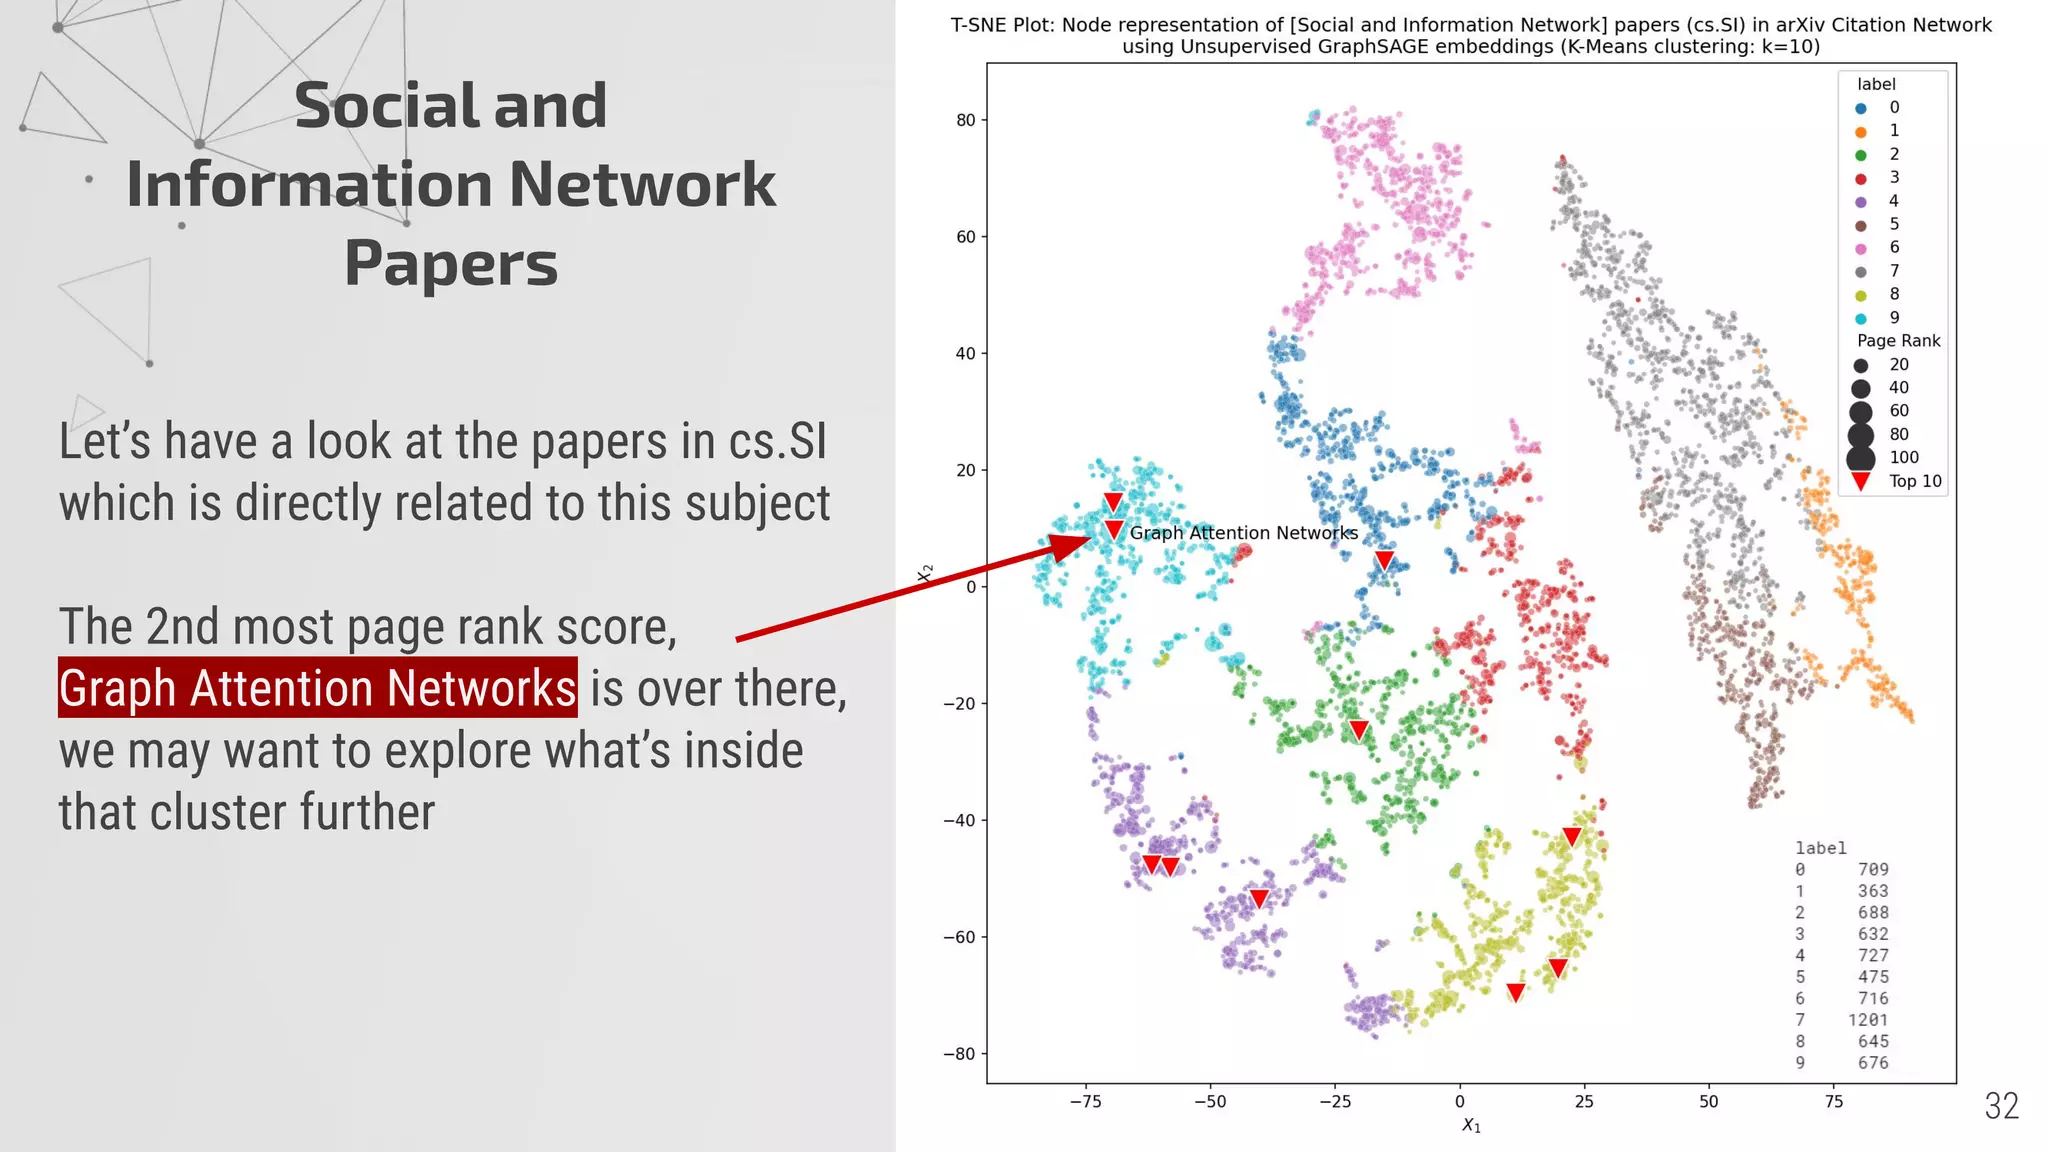
2) PageRank scores show it takes papers an average of 17 years to achieve high scores, though some fields like cs.SI achieve this faster.
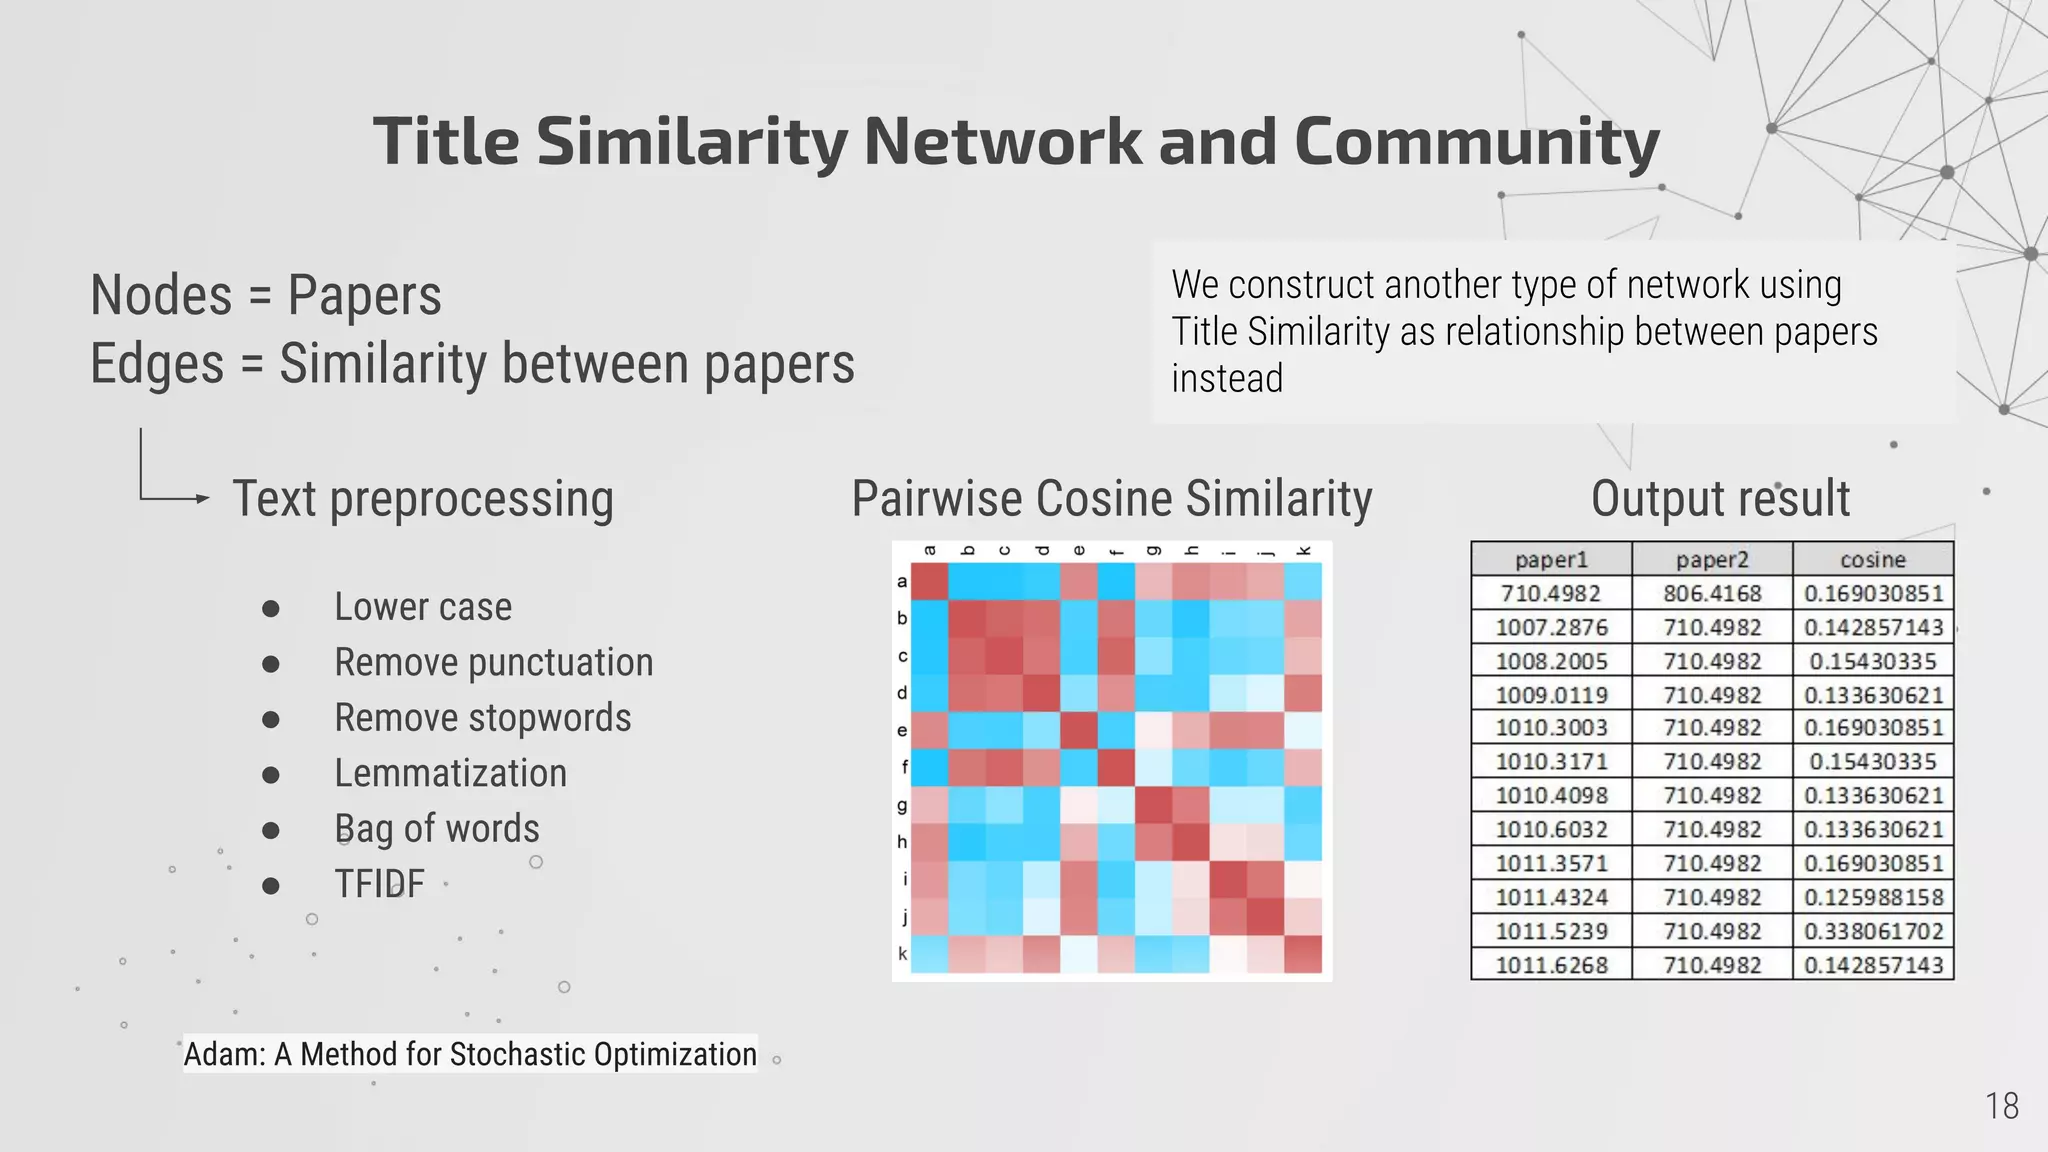
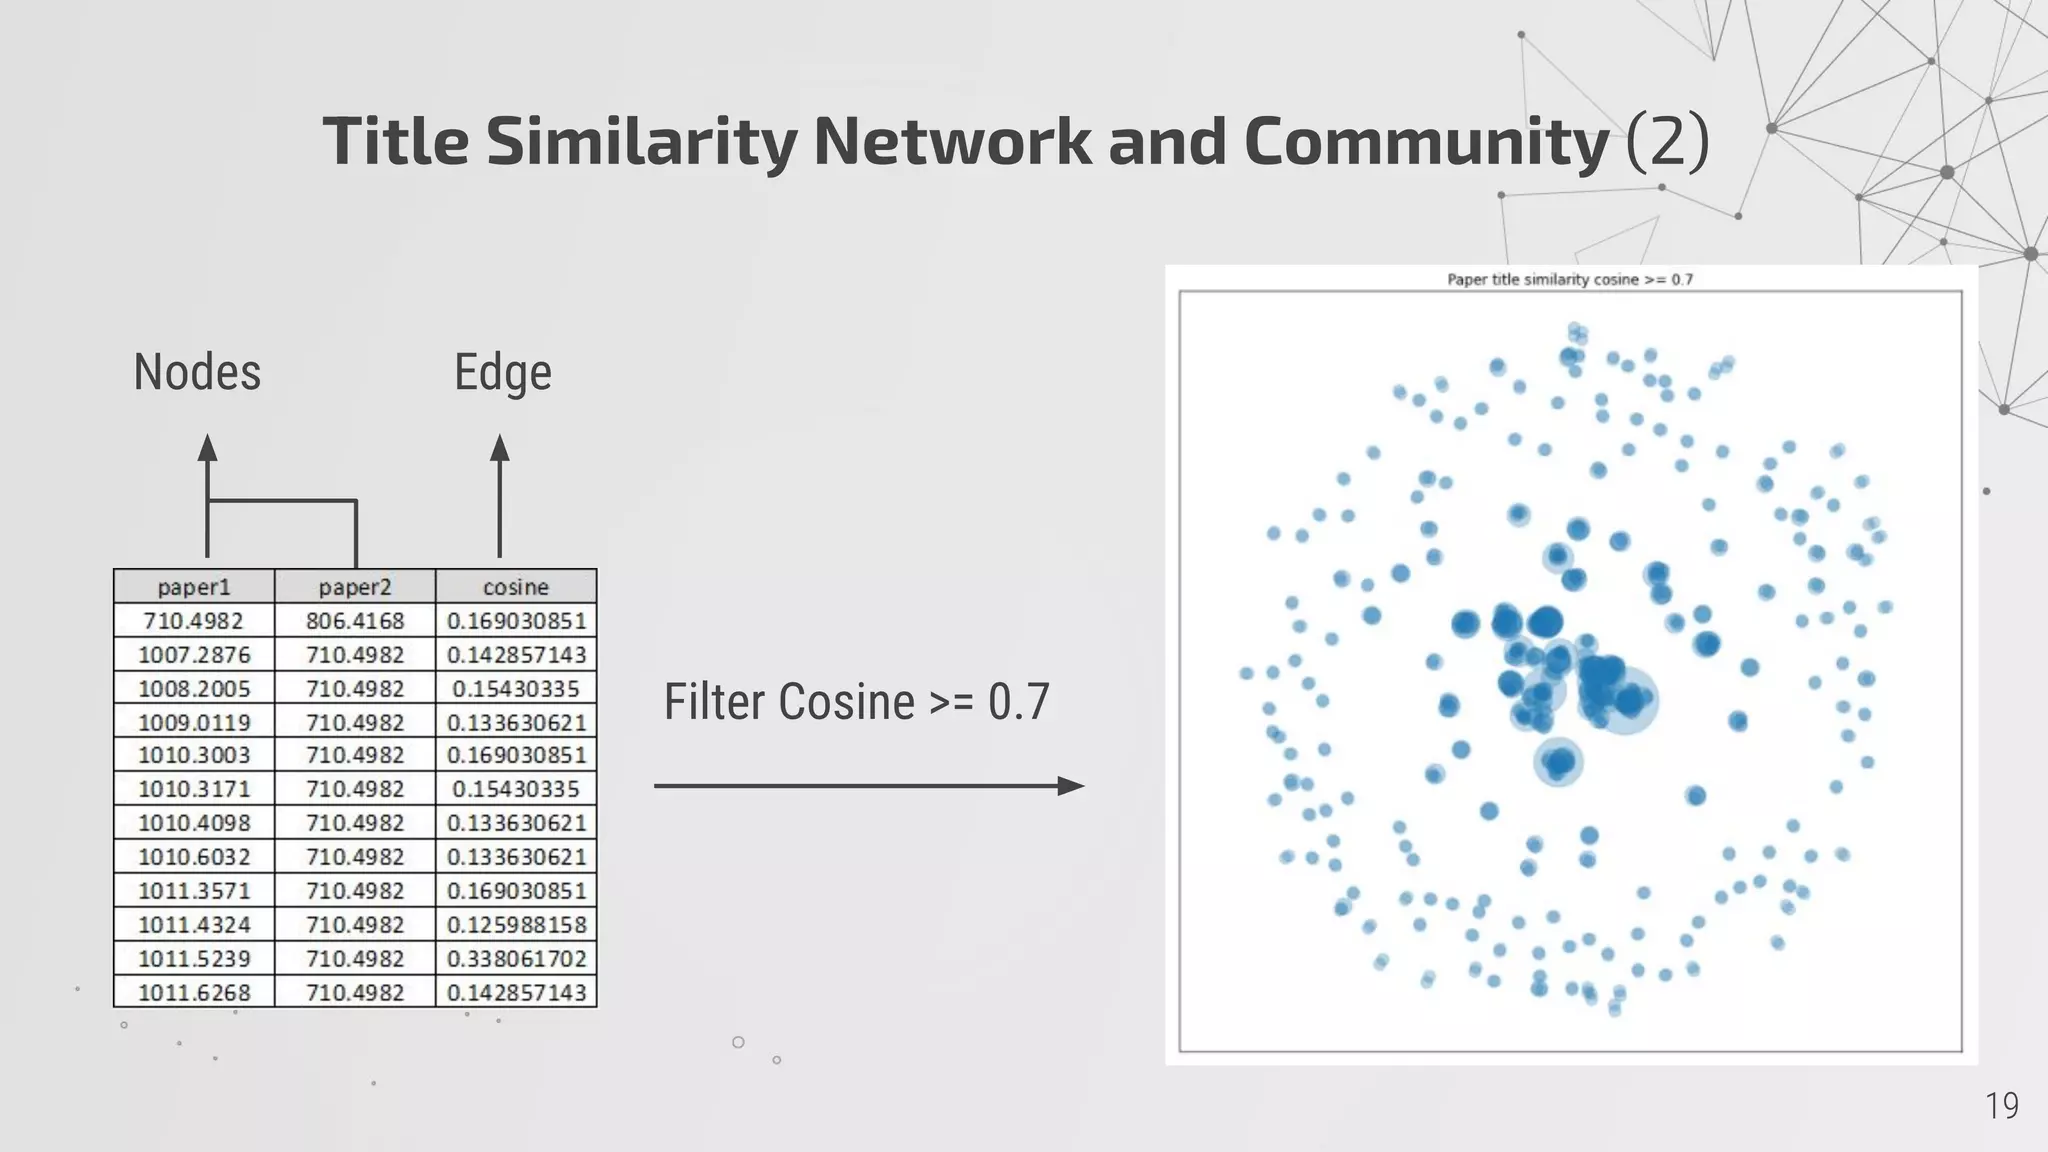
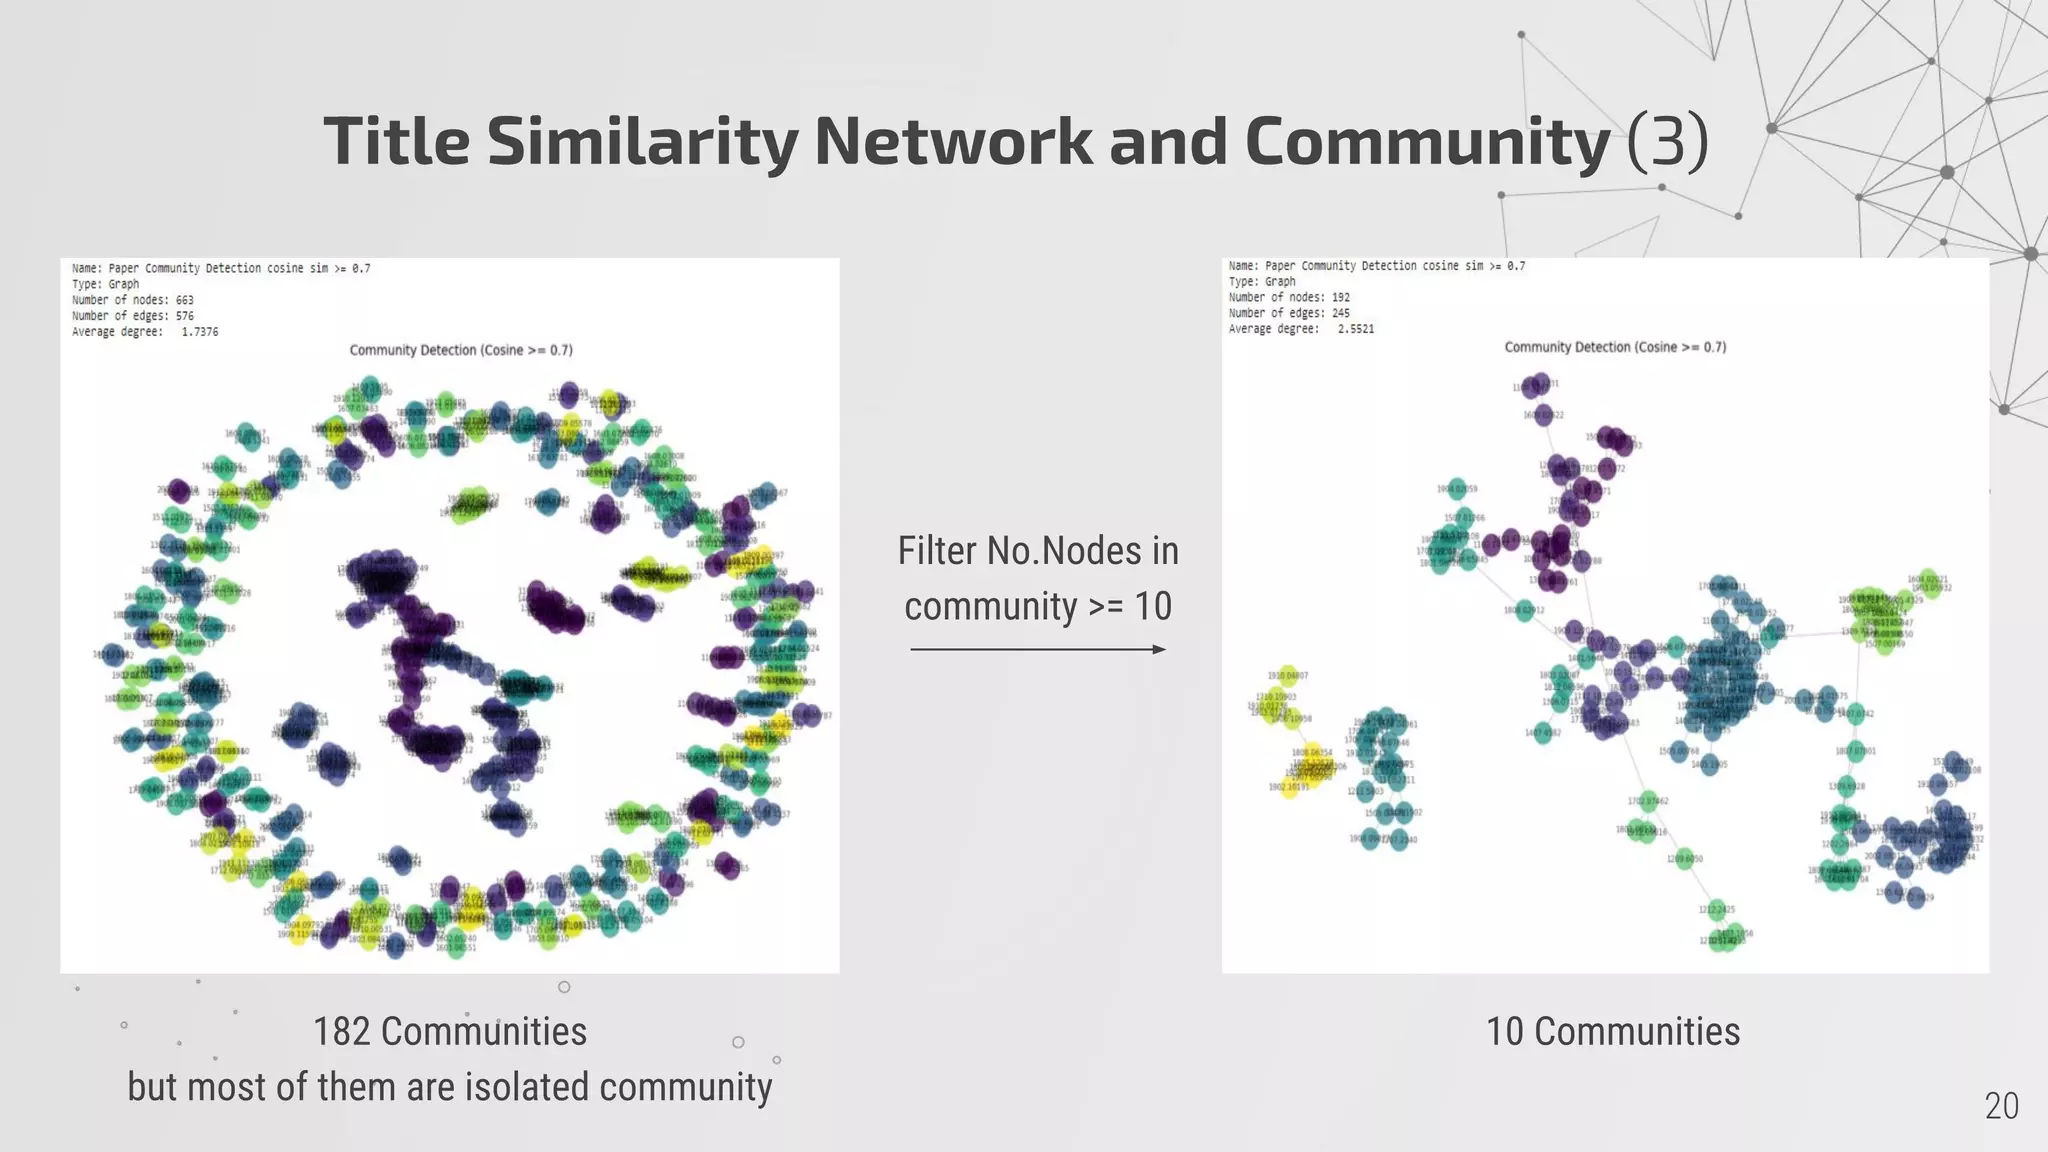
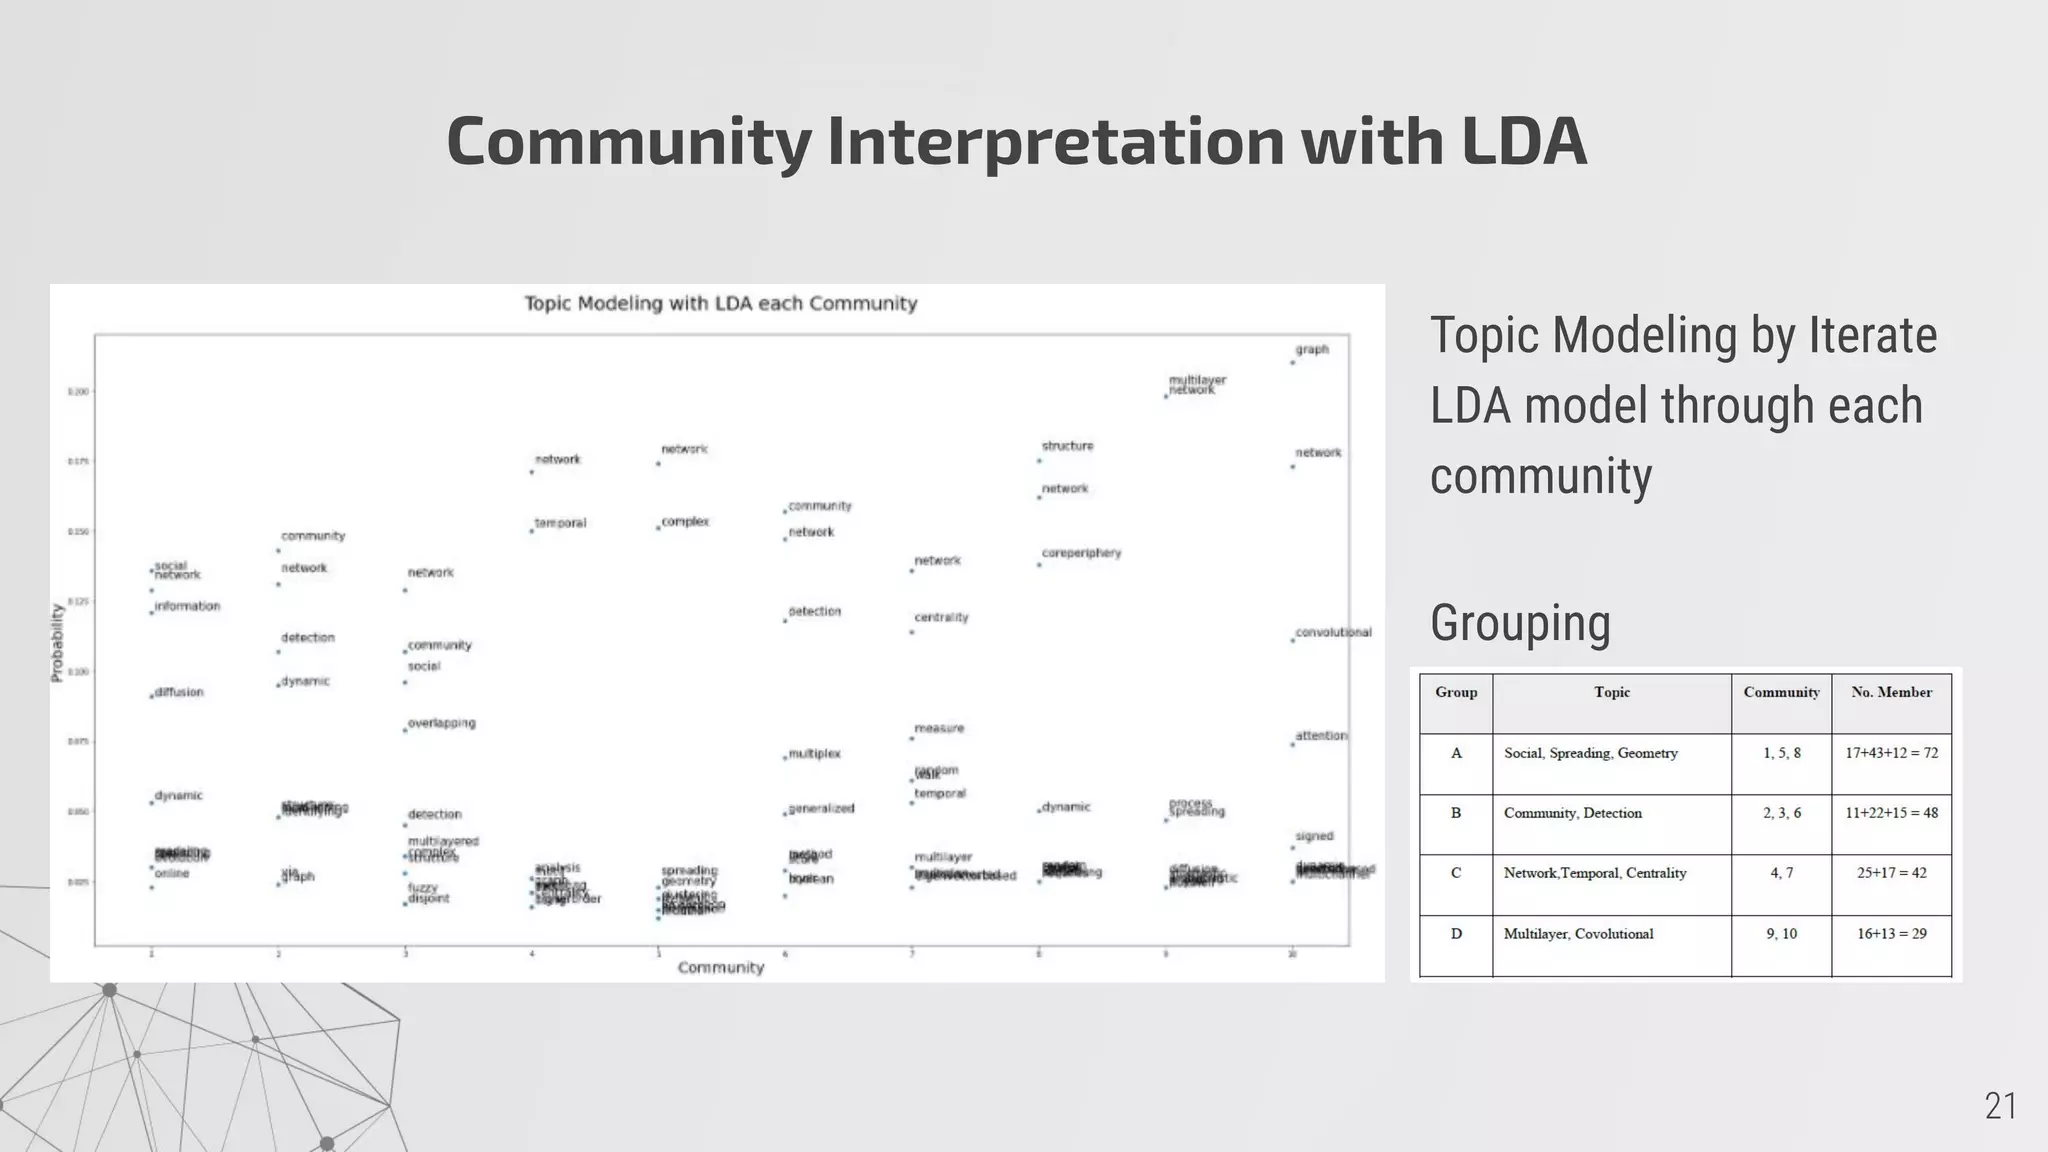
3) Title similarity networks group papers into 182 communities using LDA topic modeling.
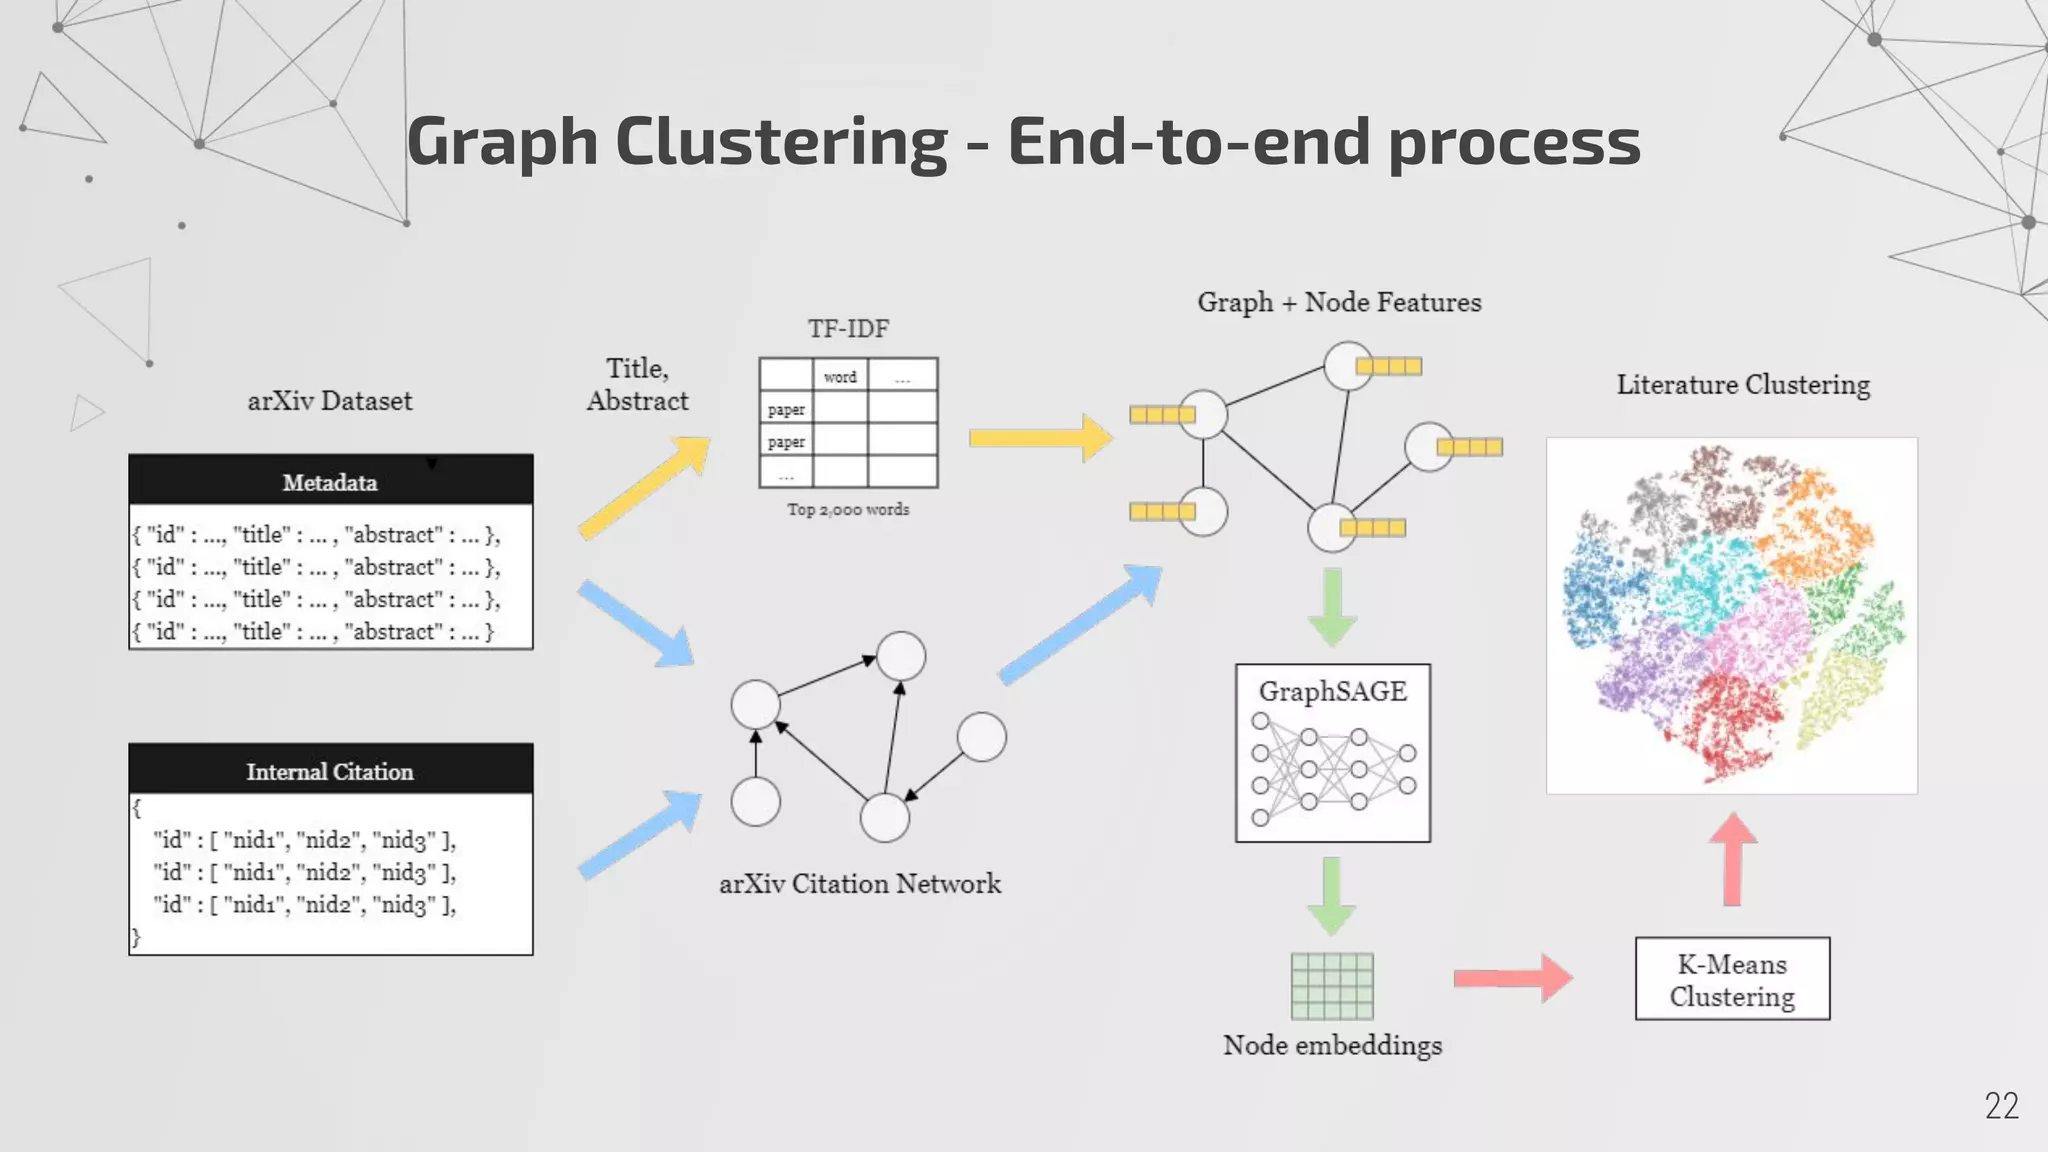
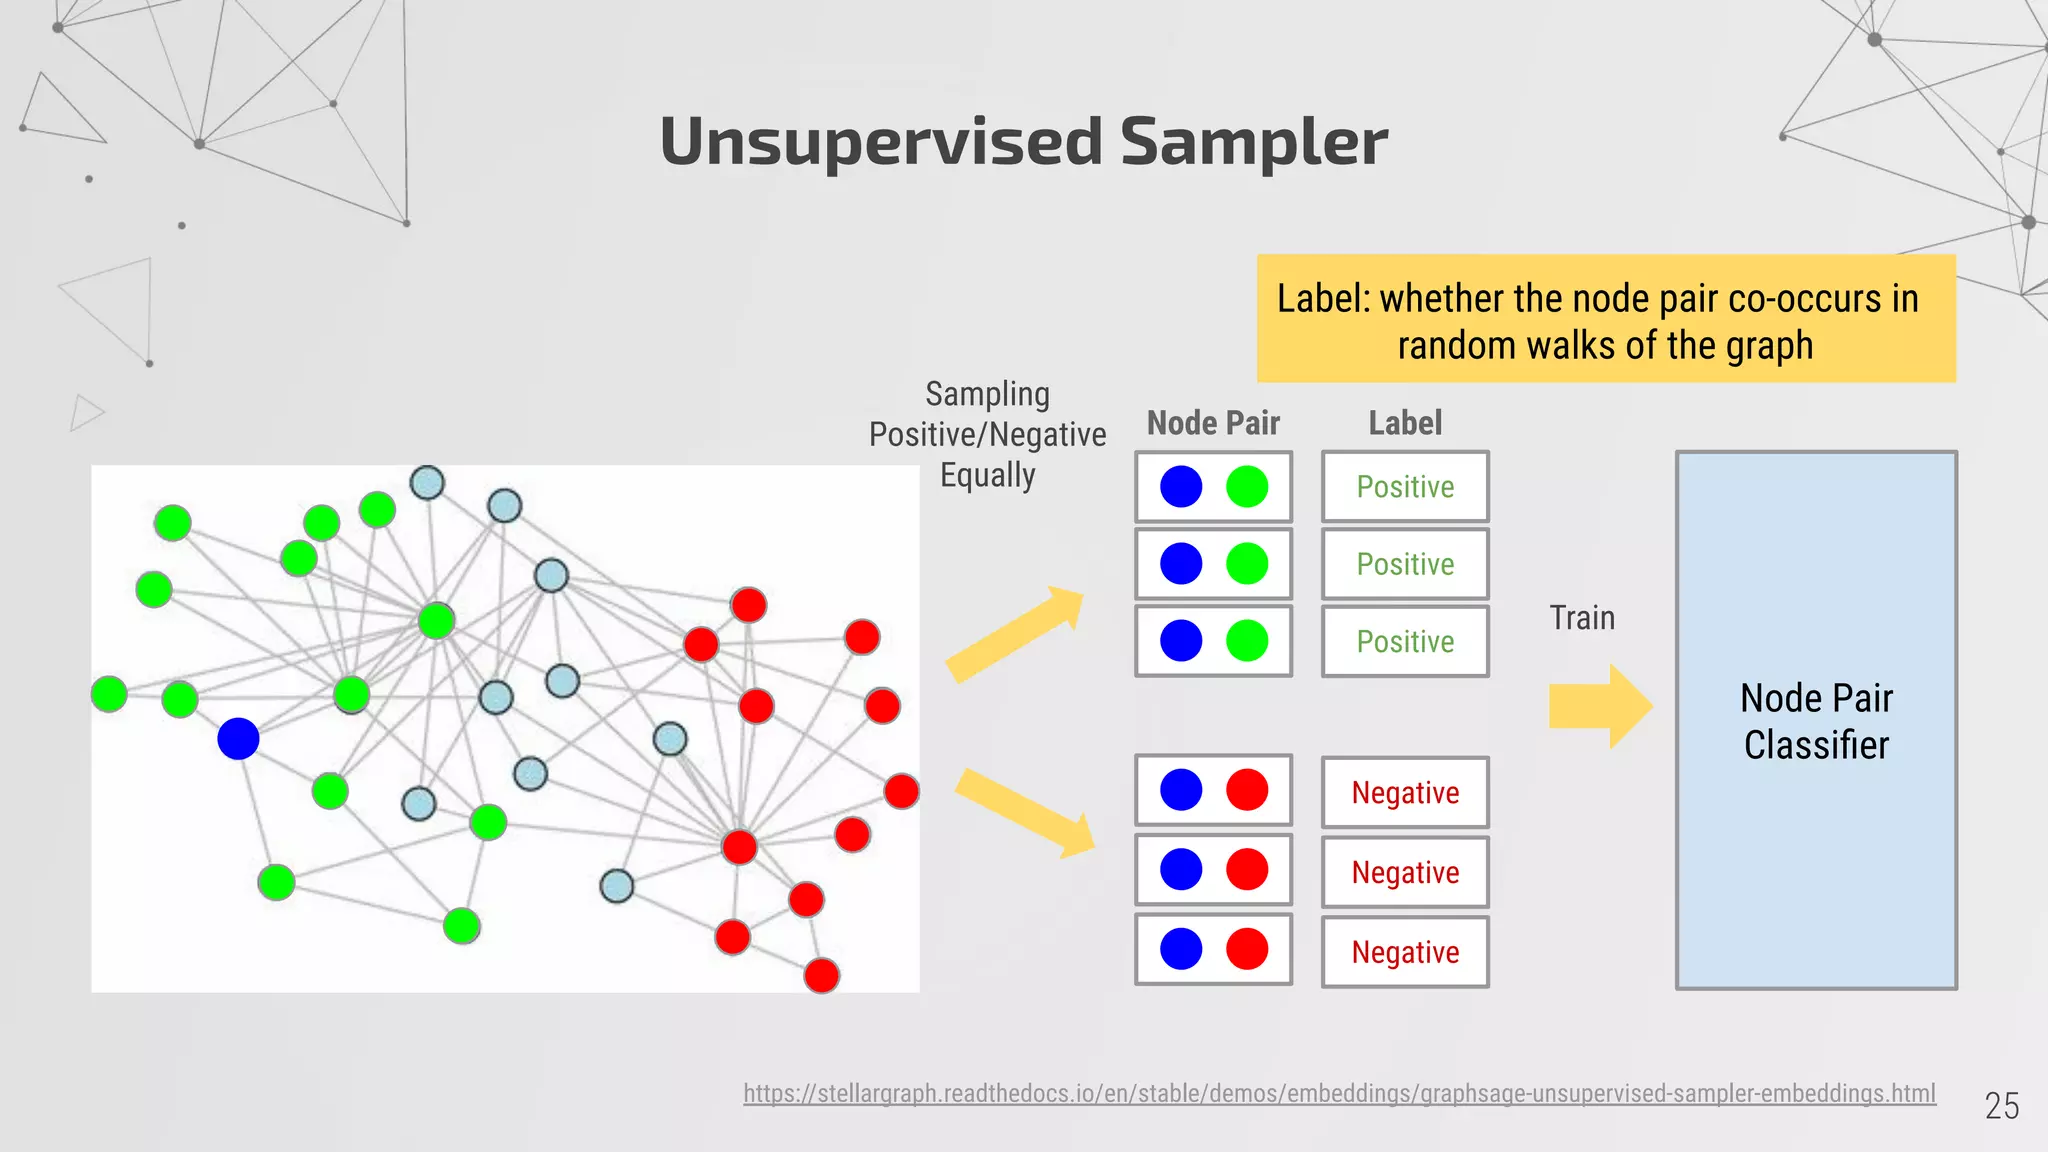
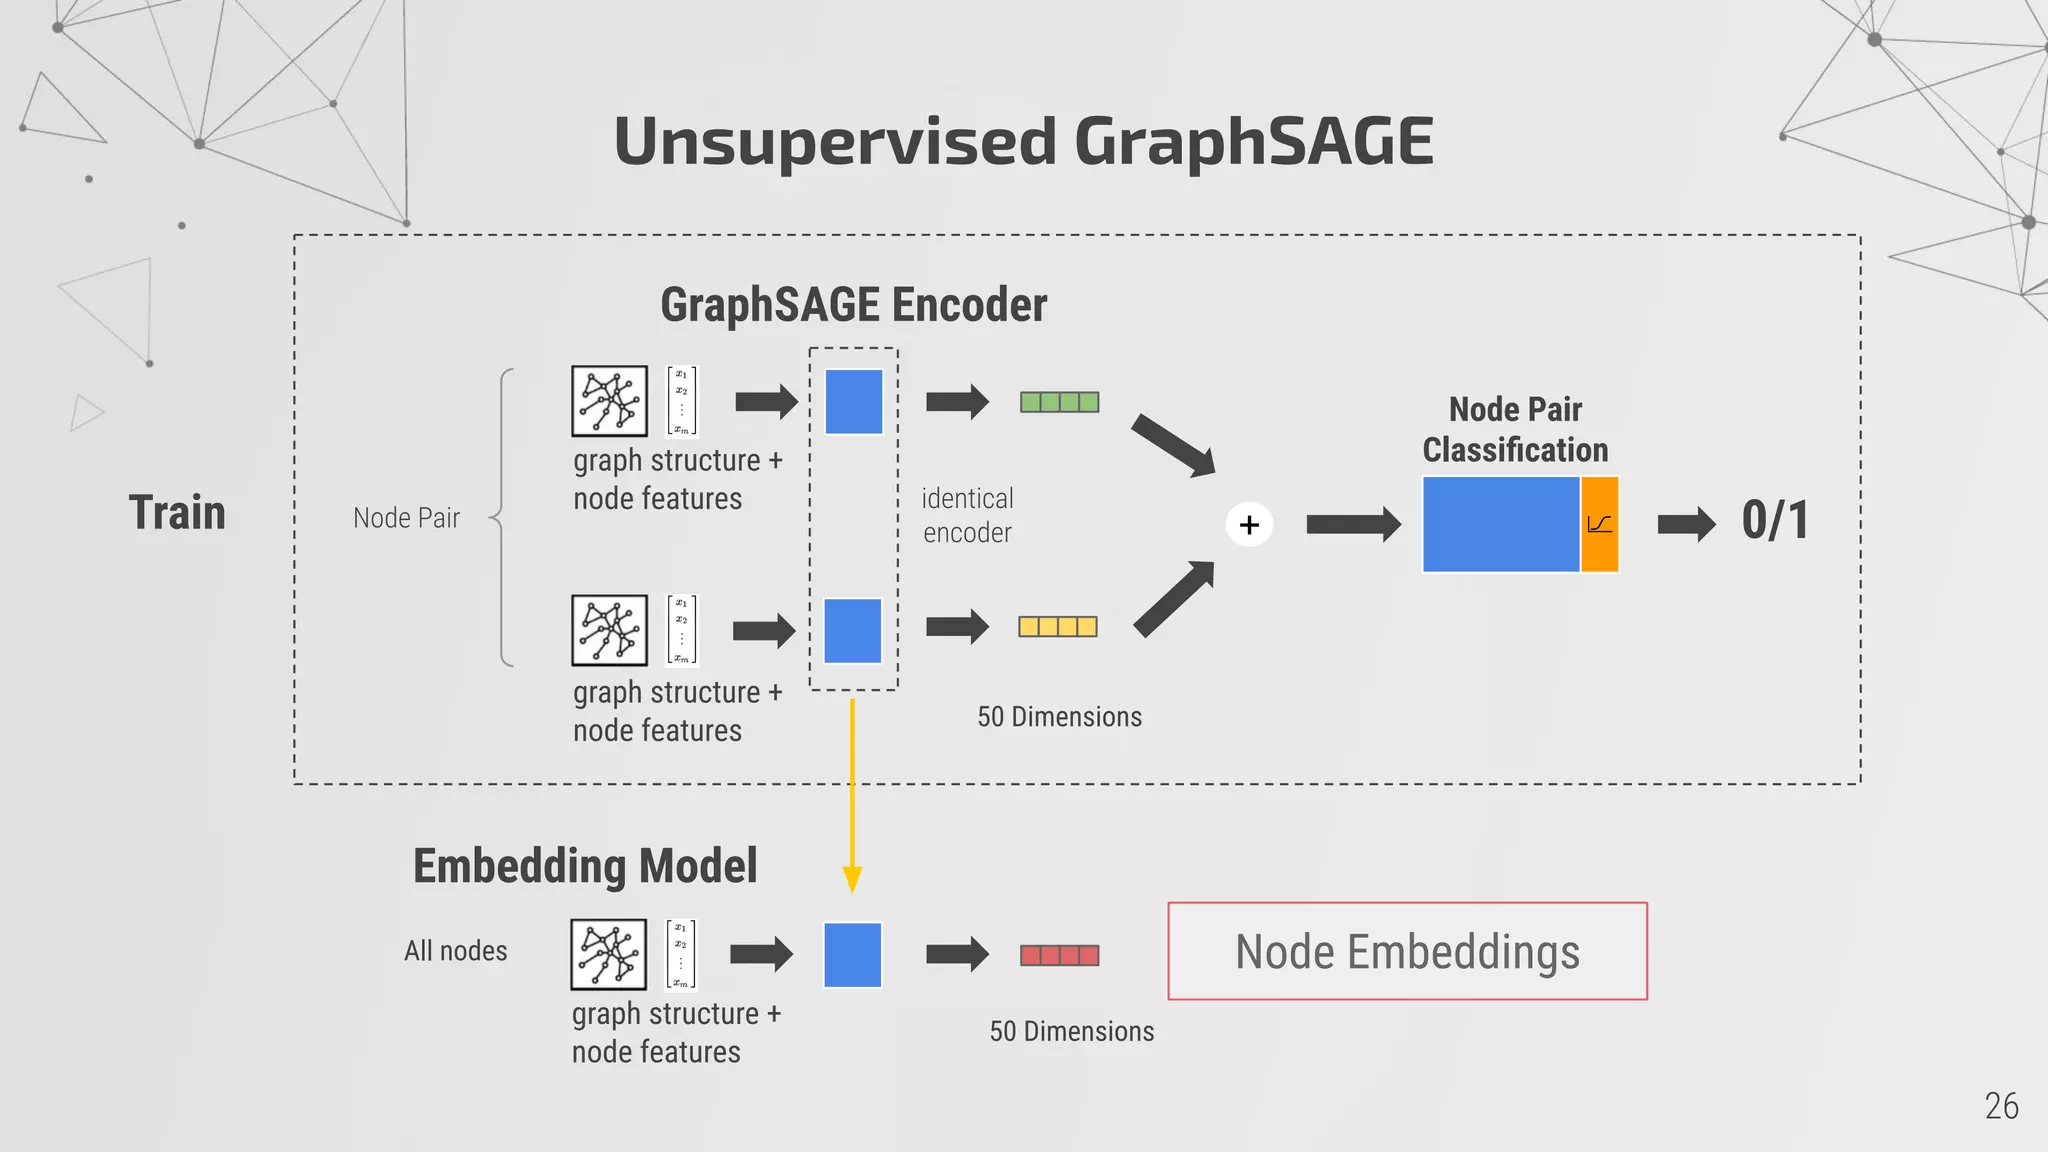
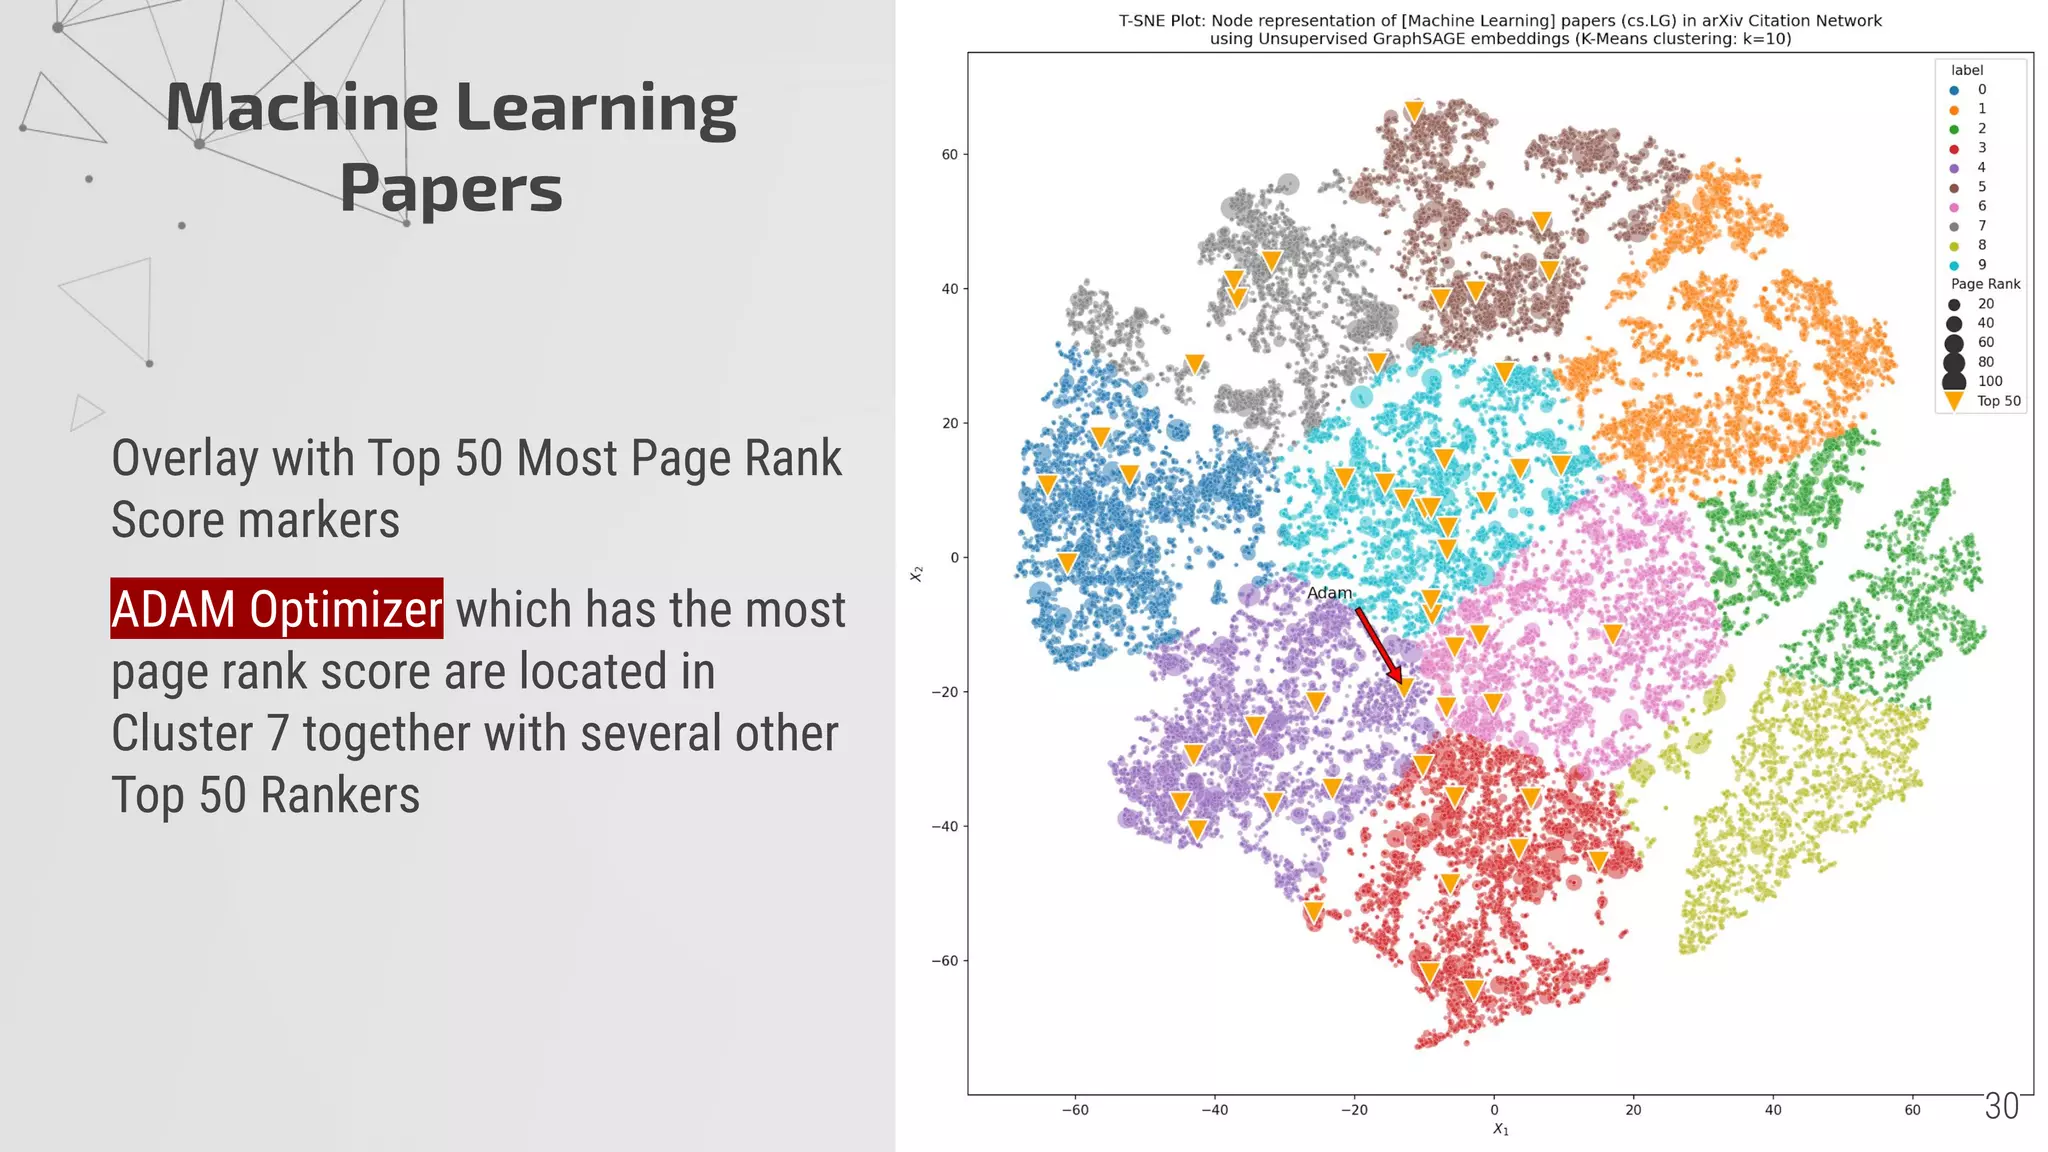
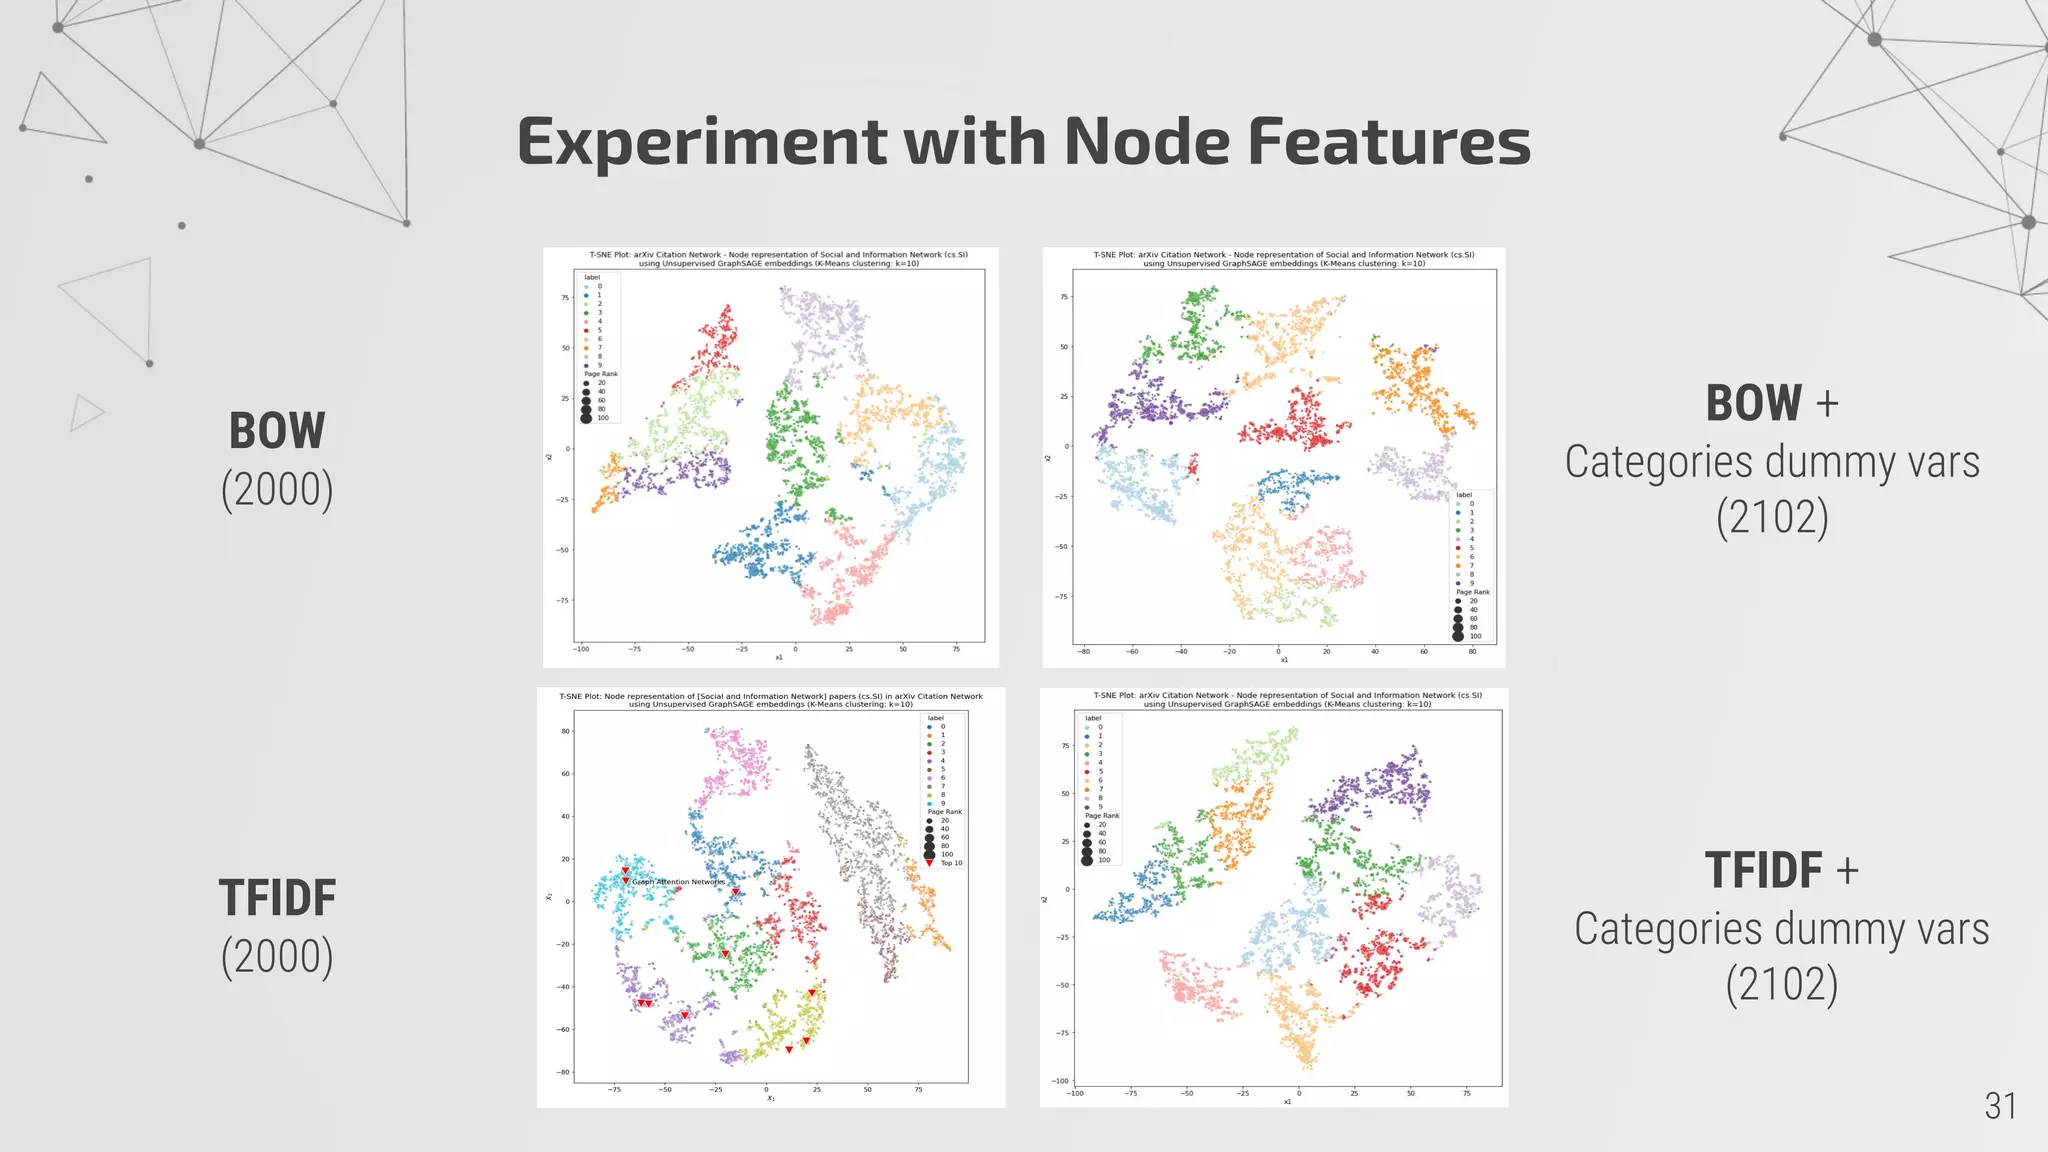
4) Unsupervised GraphSAGE embeddings cluster the papers into 10 groups with related topics centered around high PageRank papers.

![DATASET
ArXiv Dataset
Source : Kaggle
arXiv Dataset (version 4)
● Metadata (1.7+ Million papers, 4.5GB)
ID, Title, Abstract, Created Date, Category
Format: JSON
● Internal Citation (171 MB)
Citation that occurred only in ArXiv
Format: JSON
(internal citation data is not available anymore)
https://www.kaggle.com/Cornell-University/arxiv
C. B. Clement, M. Bierbaum, K. P. O'Keeffe and A. A. Alemi, “On the Use of ArXiv as a Dataset”, 2019, arXiv:1905.00075 [cs.IR].](https://image.slidesharecdn.com/arxivliteratureexplorationusingsocialnetworkanalysis-presentation-201125124153/75/ArXiv-Literature-Exploration-using-Social-Network-Analysis-6-2048.jpg)
![Graph Representation
Type: Directed Graph
Node: Paper
Node Attributes: Metadata
Edge: [Paper 1] ⟶ [Cites] ⟶ [Paper 2]](https://image.slidesharecdn.com/arxivliteratureexplorationusingsocialnetworkanalysis-presentation-201125124153/75/ArXiv-Literature-Exploration-using-Social-Network-Analysis-7-2048.jpg)
![GraphSAGE
http://snap.stanford.edu/graphsage/
W.L. Hamilton, R. Ying, and J. Leskovec, “Inductive Representation Learning on Large Graphs”, 2017, arXiv:1706.02216 [cs.SI]](https://image.slidesharecdn.com/arxivliteratureexplorationusingsocialnetworkanalysis-presentation-201125124153/75/ArXiv-Literature-Exploration-using-Social-Network-Analysis-23-2048.jpg)

![Machine Learning
Papers
40,635 Papers
Node Features
- TFIDF from Title + Abstract
(top 2000 words)
# Random Walk: 1
Random Walk Length: 5
NN layer: [50,50]
Embedding: 50 dimensions
K-Means: 10 clusters
Bubble size = Page Rank](https://image.slidesharecdn.com/arxivliteratureexplorationusingsocialnetworkanalysis-presentation-201125124153/75/ArXiv-Literature-Exploration-using-Social-Network-Analysis-29-2048.jpg)


![[DSC Europe 25] Ivan Peric - Intelligence Swarm Logic and Techno-Functional M...](https://cdn.slidesharecdn.com/ss_thumbnails/7my7c97fsduiccadgavw-2-251212103249-5a03f7c6-thumbnail.jpg?width=640&height=640&fit=bounds)


![[DSC Europe 25] Miodrag Pesovic & Vladislav Radonjic - Federated Data Archite...](https://cdn.slidesharecdn.com/ss_thumbnails/gsbe3y5it5uhndi4e08e-1-251212103249-f1008e0c-thumbnail.jpg?width=640&height=640&fit=bounds)
![[DSC Europe 25] Uros Pesic - The Reality of AI in Marketing.pdf](https://cdn.slidesharecdn.com/ss_thumbnails/rtkodnmtycovsllvzsyn-9-251215095918-b0c6bfe3-thumbnail.jpg?width=640&height=640&fit=bounds)


![[DSC Europe 25] Behzad Hosseini - AI Agents in the Wild: Deploying Models tha...](https://cdn.slidesharecdn.com/ss_thumbnails/3qtejajvsjqrzwfept2c-10-251212103250-7f2b1068-thumbnail.jpg?width=640&height=640&fit=bounds)
![[DSC Europe 25] Nikolay Burlutskiy - Best Practices for Building Enterprise M...](https://cdn.slidesharecdn.com/ss_thumbnails/uirvaiuvq8y1w8hzd9tx-7-251212103249-2619edb4-thumbnail.jpg?width=640&height=640&fit=bounds)
![[DSC Europe 25] Kaja Kandare - LLM as a judge.pptx](https://cdn.slidesharecdn.com/ss_thumbnails/arxyccaxsdsd1ba99wjw-7-251212104007-2b4e3f64-thumbnail.jpg?width=640&height=640&fit=bounds)
![[DSC Europe 25] Dunja Adzic Jovanovic - AI and Cybersecurity: Defending Data ...](https://cdn.slidesharecdn.com/ss_thumbnails/o1zylpbhrtwnixxq2xj8-7-251211083048-185086f6-thumbnail.jpg?width=640&height=640&fit=bounds)

![[DSC Europe 25] Vladimir Jelic - The AI-Driven Security Shift From Reactive D...](https://cdn.slidesharecdn.com/ss_thumbnails/6g5gj25mtjwayniqem1t-6-251209104645-7a5a5fc6-thumbnail.jpg?width=640&height=640&fit=bounds)


![[DSC Europe 25] Dusan Nesic - Securing Tomorrow’s Infrastructure: Why Cyber-P...](https://cdn.slidesharecdn.com/ss_thumbnails/qikbszfftyowjm2q6duw-1-251211083848-8f2ead6b-thumbnail.jpg?width=640&height=640&fit=bounds)
![[DSC Europe 25] Branko Dzakula - From Defense to Attack: How AI Redefines Cyb...](https://cdn.slidesharecdn.com/ss_thumbnails/80bdzdxpr3ky2g0qvyk9-8-251211083048-ce5fc1ee-thumbnail.jpg?width=640&height=640&fit=bounds)