Downloaded 23 times
![Intelligent Natural Gas Pipeline Leak Detector
using Binary Matrix Extraction
Engr. Edgar Caburatan Carrillo II, Dr. Elmer P. Dadios
College of Engineering, De La Salle University
2401 Taft Avenue, 1004 Manila, Philippines
edgar_carrillo@dlsu.ph, elmer.dadios@dlsu.edu.ph
Abstract— Pipeline management is very important for natural
gas pipelines [2]. One of the pipeline management technique is
leak detection. If natural gas pipeline is mismanaged and leak
not detected, there will be explosion due to reaction of its
chemical components [35]. Using visual inspection is the
traditional method in detecting natural gas pipeline leakage but
an intelligent system will make the leak detection better [36].
Also simulating it first before implementation will sure save cost
and will lead to easy decision making [11]. This paper presents
the on how an intelligent system will detect pipeline leakage using
binary matrix analyzer. The output of the binary matrix
analyzer was used as input in Matlab neural network toolbox
that can be applied to optimize natural gas pipelines by detecting
its leaks. It comes with 2 stages. First, the training of neural
network and the second is testing of neural network. The
training stage contains set of known data. In the training stage,
the weight of the neuron was determined based on known input
and output. After training, the testing stage was used to were for
a given input and weight, the output was determined.
Simulations were made using the installed neural network system
of Matlab. Also, its theoretical robustness was calculated by
Matlab. Based on the neural network developed, it is 98.52%
robust.
Keywords— Matlab, Artificial Intelligence, Pipeline, Natural
gas, Pipeline management, Binary matrix
I. INTRODUCTION
The world is fast changing and is driven by emerging
technologies that aid us in order to make our lives easier.
Along with advancement in the field of science, engineering
and technology is the rise in the global consumption of
energy[12].Especially in the need for fuel source such as
natural gas. This energy needs to be efficiently transferred and
leaks in pipe networks represent an important problem costing
many millions of dollars annually. The difficulty in leak
location is compounded by their hidden nature . The benefit of
leak detection and rehabilitation is largely determined by the
efficacy of leak detection and location techniques[8].
The prime objective of this study is to apply neural network
in leak detection system.
Specifically, this study aims to:
1.train the neural network using set of data and linearize the
result,
2. test and evaluate the performance and robustness of the
neural network system, and;
3. Compare the robustness of neural network to other
techniques.
The system can help in the automation of the natural
pipeline[2]. It will also cost time and money for the company
that will use the micro controller because it sets to satisfy
consumer demand without sacrificing quality of natural
gas[8]. An expert system such as neural network can be an
effective tool to each the tremendous mismanaged of natural
gas pipelines can occur in the past which killed many people
and employees at the same time losing a huge chuck of money
of those companies involved[35].
A. Natural Gas
Natural gas is mainly composed of methane. After release
to the atmosphere it is removed over about 10 years by
gradual oxidation to carbon dioxide and water by hydroxyl
radicals (·OH) formed in the troposphere or stratosphere,
giving the overall chemical reaction:
CH4 + 2O2→ CO2 + 2H2O [42, 43].
While the lifetime of atmospheric methane is relatively short
when compared to carbon dioxide, [44] it is more efficient at
trapping heat in the atmosphere, so that a given quantity of
methane has 62 times the global-warming potential of carbon
dioxide over a 20-year period, 20 times over a 100-year period
and 8 times over a 500-year period. Natural gas is thus a more
potent greenhouse gas than carbon dioxide due to the greater
global-warming potential of methane [46, 47]. Current
estimates by the EPA place global emissions of methane at 85
billion cubic metres (3.0×10
12
cu. ft) annually, [45] or 3.2 per
cent of global production [47]. Direct emissions of methane
represented 14.3 per cent of all global anthropogenic
greenhouse gas emissions in 2004 [48].
The extraction, storage, transportation and distribution of
natural gas is known to leak into the atmosphere, particularly
during the extraction process. A study in 2011 demonstrated
that the leak rate of methane was high enough to jeopardize its
global warming advantage over coal. This study was criticized
later for its high assumption of methane leakage values [49].
These values were later shown to be close to the findings of
the Scientists at the National Oceanic and Atmospheric
Administration [50]. Natural gas extraction also releases an](https://image.slidesharecdn.com/artificialintelligent-140531230501-phpapp02/85/Artificial-intelligent-1-320.jpg)
![isotope of Radon, ranging from 5 to 200,000 Becquerels per
cubic meter [51].
B. Pipeline Management and Leak detection
Pipeline management is very important because if the
pipeline was mismanage, there will be explosions. Some of
notables explosions and damages of life and assets includes
the Oklahoma Explosion last Oct. 23,2013[23], Explosion in
Belgium[24], Explosion in Kazakhstan[34] and many more
pipeline explosions accident[35].
Pipeline management and leak detection is new today.
Traditional or modern technique can be used. For Traditional
technique, the use of pipeline management makes the system
simpler [ 4, 5, 19, 28, 31, 33]. Also, other traditional method
were employed like real time hydraulic servo systems [10] to
control fluid flow and other non-linear approach [17,32].There
were also other optimization studies for water hydro processes
[14] and chemical processes optimization when a fluid or
certain chemical pass through the pipeline[15]. In this study
study, natural gas was used.
Aside from traditional technique, modern techniques can be
employed such as artificially intelligent system and advance
computers system [9, 25]. There are studies of artificially
intelligent system using fuzzy logic, genetic algorithm and
neural networks . Fuzzy-based system can be used to enhance
its efficiency and operational control [2]. There are also
studies that a hybrid of fuzzy logic and genetic algorithm to
manage natural gas pipeline and is called a fuzzy genetic
algorithm approach [26]. Genetic algorithms were also applied
to optimize pipeline and simulation of leak and fluid flow
[13,20]. In this paper, the neural network [6] technique was
used.
In management of pipeline, computer simulations can be
used[11]. Related studies include a computer simulation of
micro-hydro system [12] but in this study, a computer
simulation of pipeline management is made by incorporating
the theory of neural network using MatLab Neural network
Toolbox.
Aside from optimizing pipelines, there are constraints that
were determined in this pipeline systems [16].There are also
standard methods and design procedures that are already in
place for the pipeline system especially natural gas pipeline
systems [27].Aside from that, pipeline management can be
applied to robotics [30].
C. Artificial intelligence and Neural network
There are a lot of study of artificial intelligence
[3,6,10,18,22,29]. Also artificial intelligence can be in a form
of neural network. Neural networks operating on quasi-static
pressure and flow readings have been used for leak detection
in pipe systems. Caputo and Pelagagge describe an approach
to detecting spills and leakages from pipeline networks using
a multilayer perceptron back-propagation artificial neural
network (ANN) [37]. The system analyzes data from pressure
and flow rate information in order to determine the location
and size of leaks in the pipe network. A similar approach
utilizing only pressure readings is described by Shinozuka et
al. [38]. Another application of ANNs operating on steady
state process parameters for leak detection in pipe systems
was described by Belsito et al. [539]. Similarly, neurofuzzy
techniques have also been applied to the problem by Feng and
Zhang [40], as well as Izquierdo et al [41].
Figure 1. Block Diagram of the ANN
Figure 1 shows the block diagram of our artificial neural
network system. There will be 3 inputs. These inputs are water
of water,bubbles formation and pipe present . There will be 10
hidden neurons and 1 output variable.
In table 1, it is a detailed table of the number of units in
input layer,number of units in hidden layer, number of units in
output layer,training percentage,validation percentage and
testing percentage.
Table 1. Sizes and parameters of Neural Network
Number of units in input layer 3
Number of units in hidden layer 10
Number of units in output layer 2
Training percentage 35.00%
Validation percentage 30.00%
Testing percentage 35.00%](https://image.slidesharecdn.com/artificialintelligent-140531230501-phpapp02/85/Artificial-intelligent-2-320.jpg)
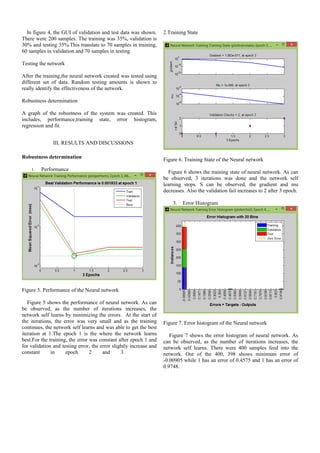
![4. Regression
Figure 8. Regression of the Neural network
Figure 8 shows the regression of neural network. The data
inputs were highly linearize to almost 1. The result of
linearizaton of the training,validation and testing data was
almost 1 which is highly linearize. The Training has 98.555%
accuracy, Validation has 99.959 accuracy and target has
97.253% accuracy. The overall performance of the network
created is 98.516% rebust.
IV. CONCLUSION AND RECOMMENDATION
The neural network created was highly rebust with 98.516%
accuracy. The researcher was able to meet all its objectives.
The technique used in this research was using binary matrix
analyzer of input image in an under water pipeline was
possible. It is recommended that the study be extended into
detecmination of organic pollutant in air such as CO,CO2
gases.
II. ACKNOWLEDMENT
I like to ask thank almighty God who gave me strength and
power to finish this paper. I also like to thank my parents, my
professor Dr. Elmer Dadios, my friends and my DOST ERDT
family.
For those that are not mention, I like to indirectly thank you
for the help and support.
III. REFERENCES
[1] Asai, K.;Tanaka,;H. & Uejima,S. , “Linear Regression Analysis with
Fuzzy Model” IEEE Trans. on Systems, Man, and Cybemetics, vol.
12, pp. 904-907,1982.
[2] Babu,B.V. & Onwubolu, G.C. , “New Optimization Techniques in
Engineering”. Springer-Verlag, Heidelberg, Germany, 2003 (In Print).
[3] E.P. Dadios, D. 1. Williams, "Non conventional control of flexible
pole-cart balancing problem", Loughrough University of Technology ,
United Kingdom, February 1996.
[4] Bickel, T.C., Edgar,T.F. , and Himmelblau, D.M. , “ Optimal Design
of Gas Transmission Network” , Society of Petroleum Engineering
Journal,30, 96, 1978.
[5] B.P. Review, “BP Statistical Review,” [Online]. Available:
http://www.bp.com/content/dam/bp/pdf/StatisticalReview2012/statistic
al_review_of_world_energy_2012.pdf.
[6] E.P. Dadios, R.S. Caling Jr.,“A simulation of intelligent microhydro
with fuzzy logic controller using visual studio ”, 6th International
Conference Humanoid, Nanotechnology, Information Technology
Communication and Control, Environment and Management
(HNICEM) ,2013. IEEE International Conference, Nov. 2013.
[7] Chamani, Pourshahabi, Sheikholeslam, “Fuzzy genetic algorithm
approach for optimization of surge tanks”,Volume 20, Issue 2, April
2013, Pages 278- 285.
[8] Mashford,J.; De Silva,D.; Marney, D. & Burn, S.,“An approach to leak
detection in pipeline networks using analysis of monitored pressure
values by support vector machine”, 3h
International Conference on
network and systems ,2009 IEEE International Conference, Nov. 2009.
[9] Cheesman, A.P., “ How to Optimize Gas Pipeline Design by
Computer” . Oil and Gas Journal, 69 (51), December 20, 64, 1971.
[10] T. Fukuda, "Flexibility control of elastic robotic arm", Journal of
Robotic Systems, Vol. 2, no. I, pp. 73-88, 1985.
[11] Cleveland,T. & Millinusic, M., “Pipeline Optimization By Computer
Simulation”,ASME International, 335 East 47th street, New
York,NY10017, Oct,2000.
[12] Dadios,E.P.; Caling,R.S.,Jr.,“A simulation of intelligent microhydro
with fuzzy logic controller using visual studio ”, 6th
International
Conference Humanoid, Nanotechnology, Information Technology
Communication and Control, Environment and Management
(HNICEM) ,2013. IEEE International Conference, Nov. 2013.
[13] Dandy, G.C.; Murphy, L.J. & Simpson,A.R., “An improved genetic
algorithm for pipeline network optimization”, Feb 1996.
[14] Davis, S.,”Microhydro Clean Power from Water.” New Society
Publishers. 2003.
[15] Edgar, T.F. & Himmelblau, D.M. “Optimization of Chemical
Processes”, McGraw Hill Book Company, New York, 1988. K.
Price, and R. Storn, Home Page of Differential Evolution as on June
25, 2003. URL: http://www.ICSI.Berkeley.edu/~storn/code.html.
[16] Flanigan,O., “ Constrained Derivatives in Natural Gas Pipeline System
Optimization” , Journal of Petroleum Technology, May, 549, 1972.
[17] Floudas, C.A., “Nonlinear and mixed-integer optimization. Oxford
University Press”, New York, 1995.
[18] F. Cellier & E. Kofman (2006), Continuous System Simulation,
Springer Verlag, ISBN 0-387-26102-8.
[19] Graham,,G.E.; Maxwell; D.A. and Vallone,A, “ How to Optimize
Gas Pipeline Networks” , Pipeline Industry, June, 41-43, 1971.
[20] Golderg, D.E. & Kuo, C.H., “Genetic algorithms in pipeline
optimization”, J.Comput.Civ. Eng., 1(2), 128-141,1987.
[21] Han,Y. and Lee,B. “Fuzzy Power Control Algorithm for a
Pressurized Water Reactor” Nuclear Technology, vol. 106, pp. 242-253,
1994.
[22] G. Dahlquist (1963), "A special stability problem for linear multistep
methods", BIT 3: 27–43, doi:10.1007/BF01963532, ISSN 0006-3835.
[23] Huffingtonpost, Homepage of Oklahoma Explosion as on Oct.
25,2013. URL: http://www.huffingtonpost.com/2013/10/09/oklahoma-
pipeline-explosion_n_4068377.html.
[24] Iab, Homepage of Belgium Explosion as on Oct. 25,2013.
http://www.iab-atex.nl/publicaties/database/Ghislenghien%20Dossier.p
df.
[25] Larson,R.E. & Wong,P.J., “ Optimization of Natural Gas System via
Dynamic Programming”, Industrial and Engineering Chemistry, AC
12(5), 475-481,1968.
[26] Li,F.; Liu ,L.;Jin,C. “Study on fuzzy optimization methods based on
quasi-linear fuzzy number and genetic algorithm Computers &](https://image.slidesharecdn.com/artificialintelligent-140531230501-phpapp02/85/Artificial-intelligent-5-320.jpg)
![Mathematics with Applications”, Volume 57, Issue 1, January 2009,
Pages 67–78.
[27] Mah, R.S.H. & Schacham,M. , “ Pipeline Network Design and
Synthesis” , Advances in Chemical Engineering, 10, 1978.
[28] Martch, H.B. & McCall,N.J., “ Optimization of the Design and
Operation of Natural Gas Pipeline Systems” , Paper No. SPE 4006,
Society of Petroleum Engineers of AIME, 1972.
[29] C. H. Dagli. "Artificial neural networks for intelligent manufacturing"
, Chapman & Hall, 1994.
[30] Niku, S. B.“ Introduction to Robotics”. John Wiley & Sons, Inc, 2011.
[31] Olorunniwo,F.O., “ A Methodology for Optimal Design and Capacity
Expansion planning of Natural Gas Transmission Networks”, Ph.D
Dissertation, The University of Texas Austin, May, 1981.
[32] Salcedo,R.L. , “Solving Nonconvex Nonlinear Programming Problems
with Adaptive Random Search”. Industrial & Engineering Chemistry
Research,31, 262, 1992.
[33] Singh & Nain , “Optimization of Natural Gas Pipeline Design and Its
Total Cost Using GA”, 2012.
[34] UPI,Homepage of Top News as on Oct. 25,2013. URL:
http://www.upi.com/Top_News/Special/2013/10/24/Kazakhstans-
giant-Kashagan-oil-field-closed-during-investigation/UPI-
37691382618622/#ixzz2iiGlVDGA.
[35] Wikipedia, Homepage of pipeline accidents as on Oct. 25,2013. URL:
http://en.wikipedia.org/wiki/List_of_pipeline_accidents.
[36] Zadesh, L.,“ Fuzzy sets Information Control”,1965.
[37] Caputo, A.C. & Pelagagge, P.M. (2003), “Using neural networks to
monitor piping systems”, Process Safety Progress, Vol. 22, No. 2,
2003, pp.119-127.
[38] Shinozuka, J.M., Liang & Feng,M.Q., “Use of supervisory control and
data acquisition for damage location of water delivery systems”,
Journal of Engineering Mechanics, 2005, pp. 225-230.
[39] Belsito, S., Lombardi,P., Andreussi,P. & Banerjee,S., “Leak detection
in liquefied gas pipelines by artificial neural networks”, AIChE
Journal, Vol. 44, No. 12, 1998, pp. 2675-2688.
[40] Feng,F. & Zhang,H. , “Algorithm of pipeline leak detection based on
discrete incremental clustering method”, in ICIC 2006, LNAI 4114,
Huang, D.-S., Li, K and Irwin, G.W. (eds.), Springer-Verlag, 2006, pp.
602-607.
[41] Izquierdo,J. , López, P.A. & Martínez,R.P. , “Fault detection in water
supply systems using hybrid (theory and data-driven) modelling”,
Mathematical and Computer Modelling 46, 2007, pp. 341-350.
[42] Stanley Manahan (2010). Environmental Chemistry, 9th edition. CRC
press. ISBN 978-1-4200-5920-5.
[43] "Methane: A Scientific Journey from Obscurity to Climate Super-
Stardom". September 2004 National Aeronautics and Space
Administration. Goddard Institute for Space Studies. Retrieved 11 June
2013.
[44] "Curbing Emissions by Sealing Gas Leaks". NY Times. October 14,
2009. Retrieved 11 June 2013.
[45] "Methane emissions". EPA. Retrieved 11 June 2013.
[46] Khalil, M. A. K. (1999). "NON-CO2 GREENHOUSE GASES IN THE
ATMOSPHERE". Annual Review of Energy and the Environment 24
(1): 645–661. doi:10.1146/annurev.energy.24.1.645. ISSN1056-3466.
[47] "Wolfram Alpha query: "World Natural Gas Production"".
Wolframalpha.com. Retrieved 2011-02-06.
[48] "US EPA: Climate Economics". Epa.gov. 2006-06-28. Retrieved 2011-
02-06.
[49] "Response to Howarth et al’s Reply (February 29, 2012)". Cornell.
Retrieved 11 June 2013.
[50] "New EPA Rules Could Prevent 'Fracking' Backlash". Business Week .
April 18, 2012. Retrieved 11 June 2013.
[51] "'Naturally Occurring Radioactive Materials'". 'World Nuclear
Association'. Retrieved 2012-01-31.](https://image.slidesharecdn.com/artificialintelligent-140531230501-phpapp02/85/Artificial-intelligent-6-320.jpg)

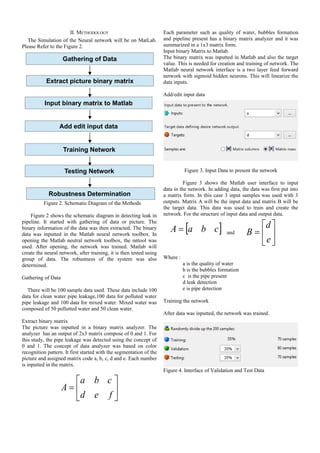
This document presents a method for detecting natural gas pipeline leaks using a binary matrix analyzer and neural network. The method involves gathering image data of pipelines, extracting binary data from the images using a matrix analyzer, inputting the binary data into the Matlab neural network toolbox to train and test an artificial neural network model. The trained neural network was able to detect pipeline leaks with 98.52% accuracy based on simulations. The method provides an intelligent system for automating natural gas pipeline leak detection as a safer and more cost-effective alternative to traditional inspection methods.


![[Oil & Gas White Paper] Liquids Pipeline Leak Detection and Simulation Training](https://cdn.slidesharecdn.com/ss_thumbnails/liquidsleakdetectionsimulation2012-130830025409-phpapp02-thumbnail.jpg?width=640&height=640&fit=bounds)


![[Oil & Gas White Paper] Getting Ahead of the Game: adopting best practices in...](https://cdn.slidesharecdn.com/ss_thumbnails/multi-tieredleakdetectiona42013-130830025442-phpapp02-thumbnail.jpg?width=640&height=640&fit=bounds)


