1) Neural stem cells cultured in vitro with epidermal growth factor and basic fibroblast growth factor proliferated and formed neurospheres. 2) Addition of PPARγ agonists like ciglitazone and 15d-PGJ2 inhibited neural stem cell proliferation in a dose-dependent manner. 3) Interestingly, neural stem cells cultured with PPARγ agonists showed increased expression of oligodendrocyte markers and a reduction in the neural stem cell marker nestin, indicating promotion of oligodendrocyte differentiation.
![PPARc Agonists Promote Oligodendrocyte
Differentiation of Neural Stem Cells by Modulating
Stemness and Differentiation Genes
Saravanan Kanakasabai1
, Ecaterina Pestereva1
, Wanida Chearwae1
, Sushil K. Gupta1
, Saif Ansari1
,
John J. Bright1,2
*
1 Neuroscience Research Laboratory, Methodist Research Institute, Indiana University Health, Indianapolis, Indiana, United States of America, 2 Department of Medicine,
Indiana University School of Medicine, Indianapolis, Indiana, United States of America
Abstract
Neural stem cells (NSCs) are a small population of resident cells that can grow, migrate and differentiate into neuro-glial
cells in the central nervous system (CNS). Peroxisome proliferator-activated receptor gamma (PPARc) is a nuclear receptor
transcription factor that regulates cell growth and differentiation. In this study we analyzed the influence of PPARc agonists
on neural stem cell growth and differentiation in culture. We found that in vitro culture of mouse NSCs in neurobasal
medium with B27 in the presence of epidermal growth factor (EGF) and basic fibroblast growth factor (bFGF) induced their
growth and expansion as neurospheres. Addition of all-trans retinoic acid (ATRA) and PPARc agonist ciglitazone or 15-
Deoxy-D12,14
-Prostaglandin J2 (15d-PGJ2) resulted in a dose-dependent inhibition of cell viability and proliferation of NSCs in
culture. Interestingly, NSCs cultured with PPARc agonists, but not ATRA, showed significant increase in oligodendrocyte
precursor-specific O4 and NG2 reactivity with a reduction in NSC marker nestin, in 3–7 days. In vitro treatment with PPARc
agonists and ATRA also induced modest increase in the expression of neuronal b-III tubulin and astrocyte-specific GFAP in
NSCs in 3–7 days. Further analyses showed that PPARc agonists and ATRA induced significant alterations in the expression
of many stemness and differentiation genes associated with neuro-glial differentiation in NSCs. These findings highlight the
influence of PPARc agonists in promoting neuro-glial differentiation of NSCs and its significance in the treatment of
neurodegenerative diseases.
Citation: Kanakasabai S, Pestereva E, Chearwae W, Gupta SK, Ansari S, et al. (2012) PPARc Agonists Promote Oligodendrocyte Differentiation of Neural Stem Cells
by Modulating Stemness and Differentiation Genes. PLoS ONE 7(11): e50500. doi:10.1371/journal.pone.0050500
Editor: Silvana Allodi, Federal University of Rio de Janeiro, Brazil
Received March 20, 2012; Accepted October 23, 2012; Published November 21, 2012
Copyright: ß 2012 Kanakasabai et al. This is an open-access article distributed under the terms of the Creative Commons Attribution License, which permits
unrestricted use, distribution, and reproduction in any medium, provided the original author and source are credited.
Funding: These authors have no support or funding to report.
Competing Interests: The authors have declared that no competing interests exist.
* E-mail: jbright1@clarian.org
Introduction
The central nervous system (CNS) was thought to be a
terminally differentiated organ. This was partly because the
majority of cells in adult mammalian brain emerge at prenatal
period which has limited ability to grow and replace lost cells or
restore function. During embryonic development these cells
originate from neural progenitor cells (NPCs) [1–3]. But recent
studies have localized a small population of resident neural stem
cells (NSCs) in the subventricular zone of adult brain [4]. It is well
recognized that NSCs can proliferate, migrate and differentiate
into neurons and glia in normal brain [5–8]. Under optimum
conditions, NSCs grow and differentiate into neuro-glial cells in
culture [9,10]. Adoptively transferred NSCs migrate, grow and
differentiate into neuro-glial cells in the brain of experimental
models [11], suggesting their use in the treatment of human
neurodegenerative diseases such as multiple sclerosis (MS),
Alzheimer’s disease (AD), Parkinson’s disease (PD), spinal cord
injury, trauma, and stroke [12–15]. Unfortunately, the behavior of
cells in normal brain or in tissue culture does not adequately
predict how these cells will behave in the CNS of patients with
neurodegenerative diseases. This is more significant in compro-
mised CNS niche with neuroinflammation where multiple factors
converge on to influence the normal physiology. Thus an effective
therapy for neurodegenerative diseases hinges on novel strategies
to improve the ability of NSCs to thrive, integrate, and function in
a physiologically meaningful manner without causing adverse side
effects.
Peroxisome proliferator-activated receptors (PPAR) are a family
of ligand-dependent nuclear receptor transcriptional factors that
regulate lipid metabolism and glucose homeostasis [16–18].
PPARa, PPARc and PPARd are three known subtypes of the
PPAR family [19]. Several fatty acids, leukotrienes and 15-Deoxy-
D12,14
-Prostaglandin J2 (15d-PGJ2) function as natural ligand for
PPARc [20–23]. Thiazolidinediones (TZDs) such as ciglitazone,
troglitazone, pioglitazone, and rosiglitazone function as high
affinity synthetic agonists for PPARc [24–27]. Upon activation
with specific ligands, PPARc forms heterodimer complex with
retinoid X receptor (RXR) and mediates target gene expression
[19]. Interestingly, earlier studies have demonstrated that PPARc
is a potent regulator of inflammation [21,28] and in vivo treatment
with PPARc agonists reduces clinical symptoms of MS, Alzhei-
mer’s disease, spinal cord injury, and stroke in animal models [29–
31]. TZD compounds have been shown to inhibit microglial
activation [32,33] and brain injury [34–38]. We have demon-
strated earlier that PPARc agonists ameliorate experimental
PLOS ONE | www.plosone.org 1 November 2012 | Volume 7 | Issue 11 | e50500](https://image.slidesharecdn.com/ded0abc7-ba86-4cf3-b3d0-afbedba0441b-160418162756/75/article2-1-2048.jpg)
![allergic encephalomyelitis (EAE) model of MS by blocking
inflammatory signaling networks [39], suggesting a physiological
role for the PPARc in the regulation of inflammation and CNS
repair in neurodegenerative diseases.
However, recent studies examining the influence of PPARc
agonists on cultured NSCs generated conflicting results. While
many reports showed reduced growth with increased differentia-
tion, others demonstrated increased growth with reduced differ-
entiation of NSCs in culture [40–42]. In this study we examined
the mechanisms by which PPARc agonists regulate growth and
differentiation of NSCs in culture. Our results demonstrate that
PPARc agonists promote oligodendrocyte differentiation of mouse
NSCs by modulating the expression of stemness and differentia-
tion genes, suggesting its use in the treatment of demyelinating
diseases.
Results
PPARc agonists inhibit proliferation of NSCs
To study the effect of PPARc agonists on NSCs, we first
established conditions to grow and expand mouse NSCs in culture.
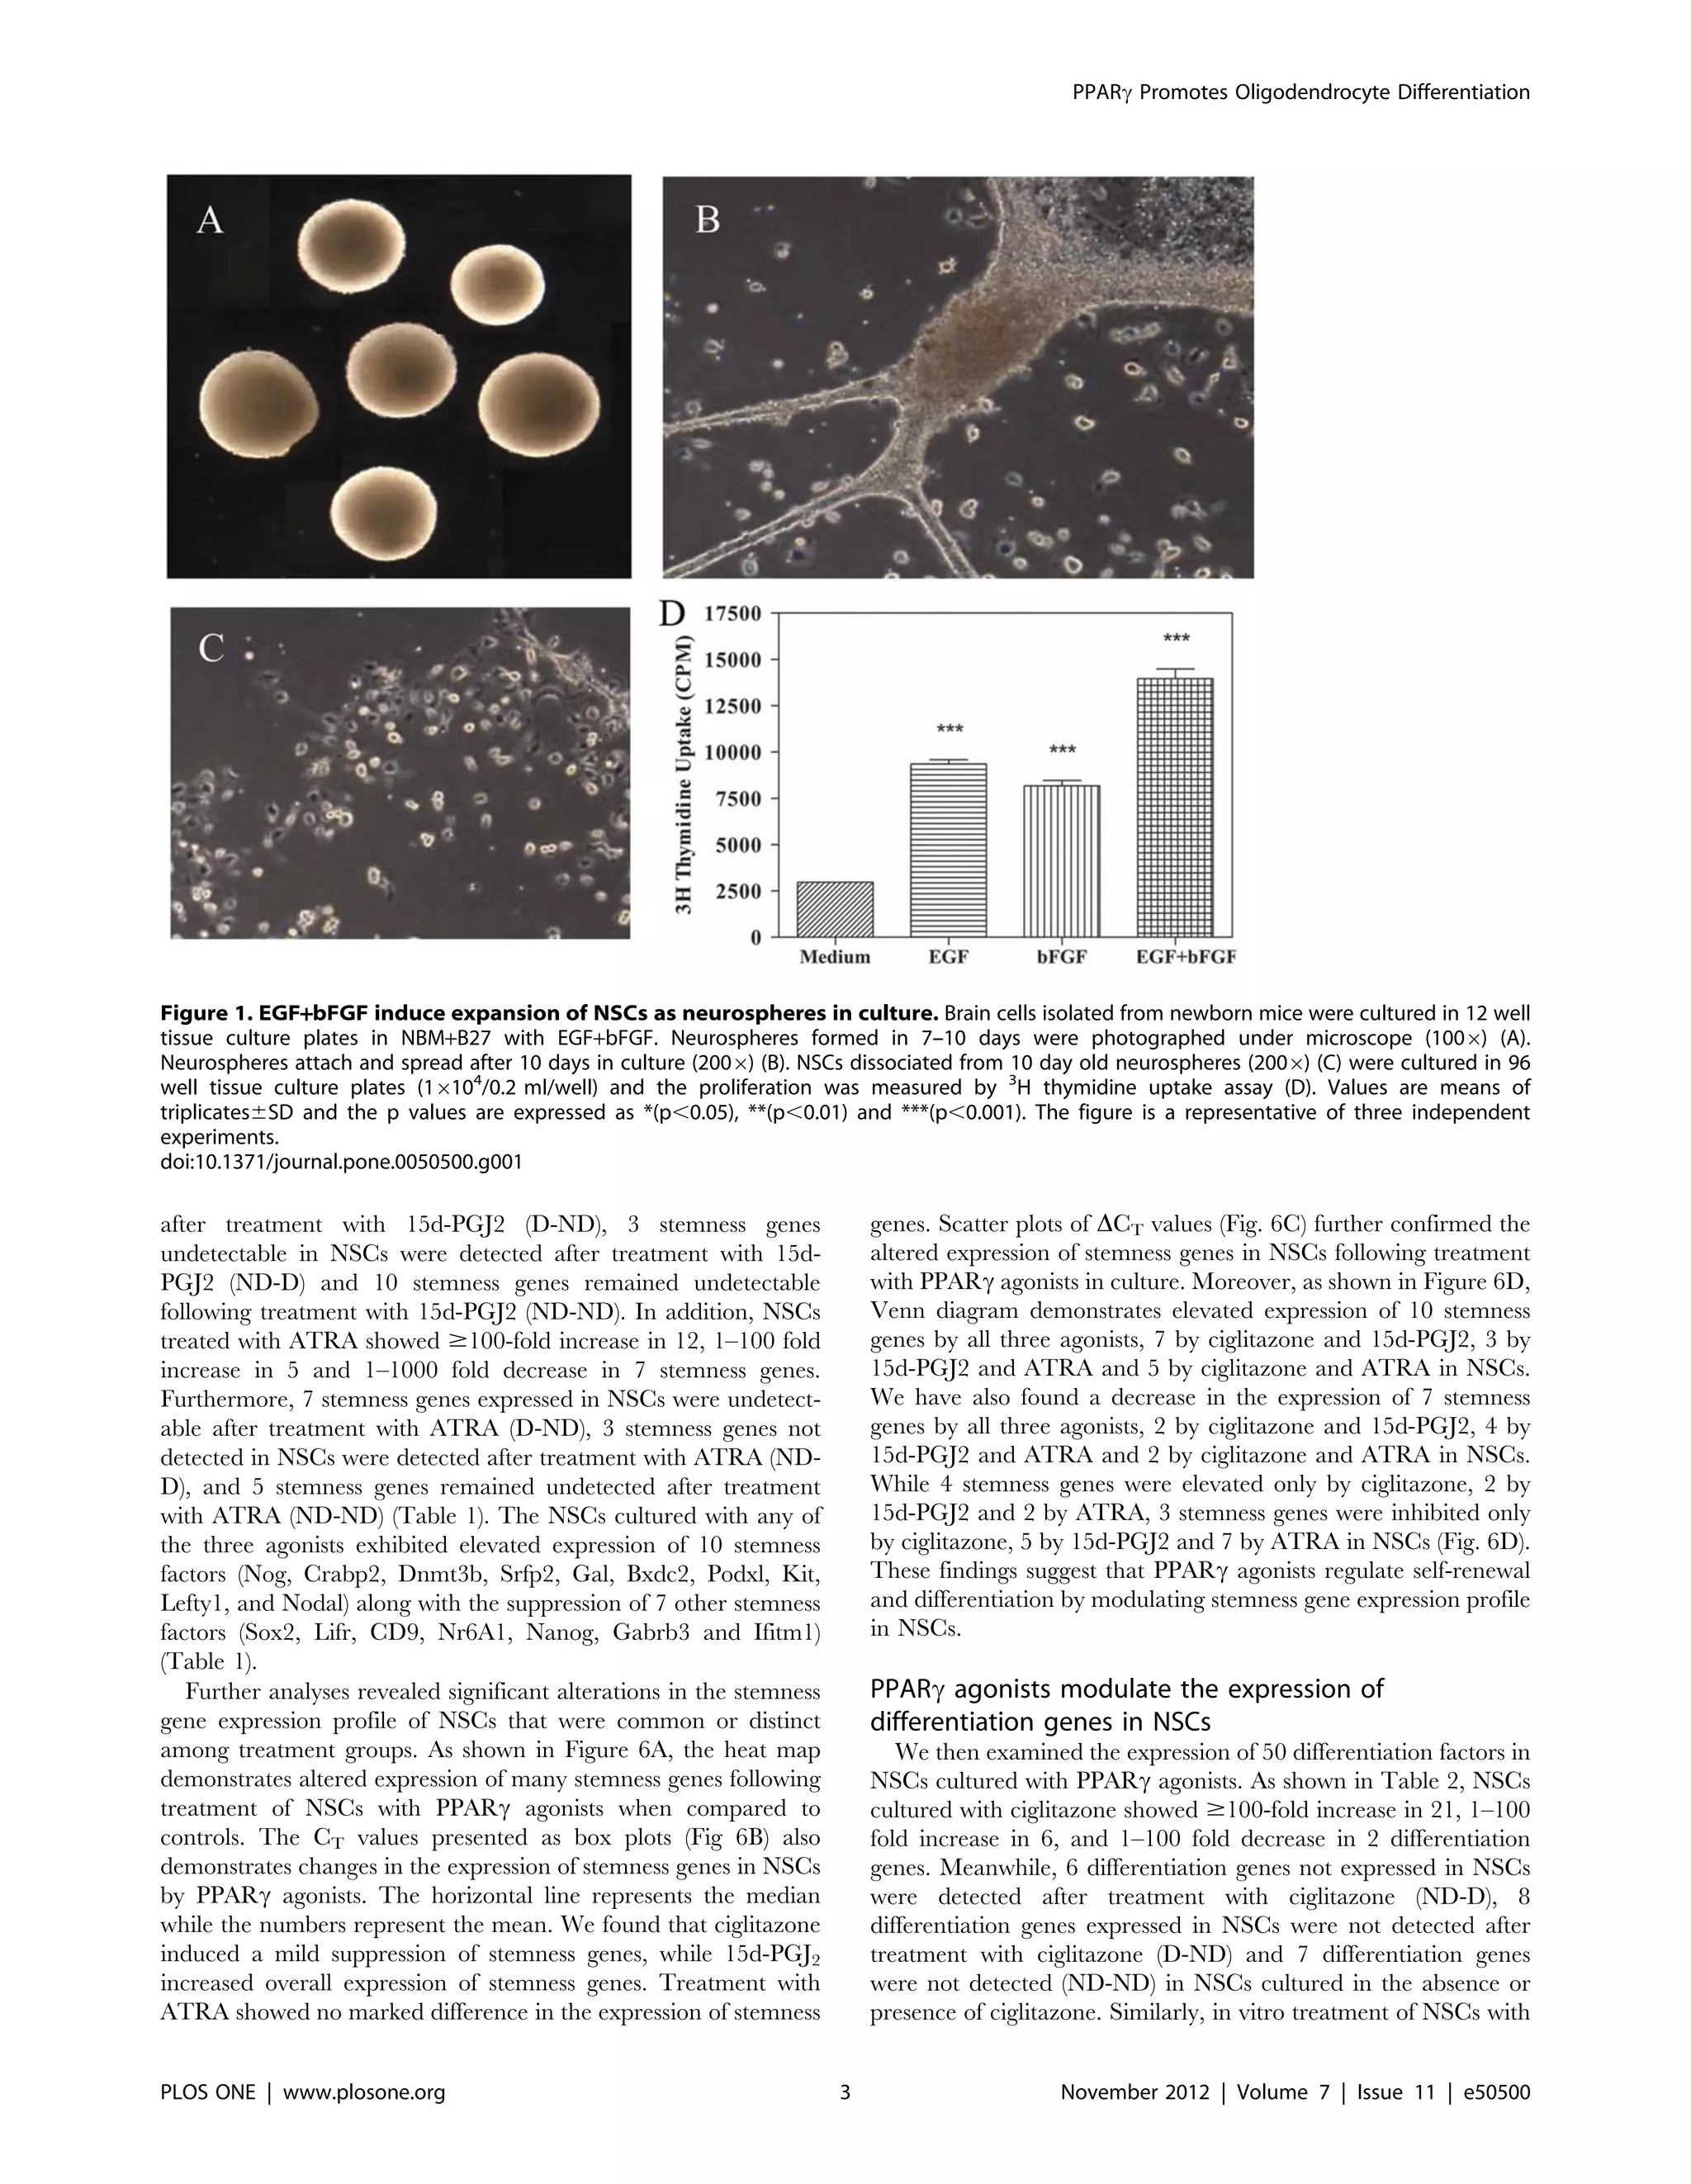
As shown in Figure 1, in vitro culture of brain cells from newborn
mice in NBM with EGF+bFGF induced neurosphere formation in
3 to 5 days that increased in size by 10 days (Fig 1A, B). The NSCs
dissociated from neurospheres (Fig. 1C) showed proliferation in
NBM and that increased significantly following addition of EGF
and bFGF alone or in combination (Fig. 1D). 3
H Thymidine
uptake assay showed that NSCs cultured in medium displayed a
background count of 2970 cpm that increased to 81686297 and
93566223 cpm following the addition of 10 ng/ml bFGF and
EGF, respectively (Fig. 1D). Moreover, addition of EGF and
bFGF in combination resulted in further increase in proliferation
reaching 139606520 cpm, suggesting a potentiating effect for
these growth factors on NSCs in culture.
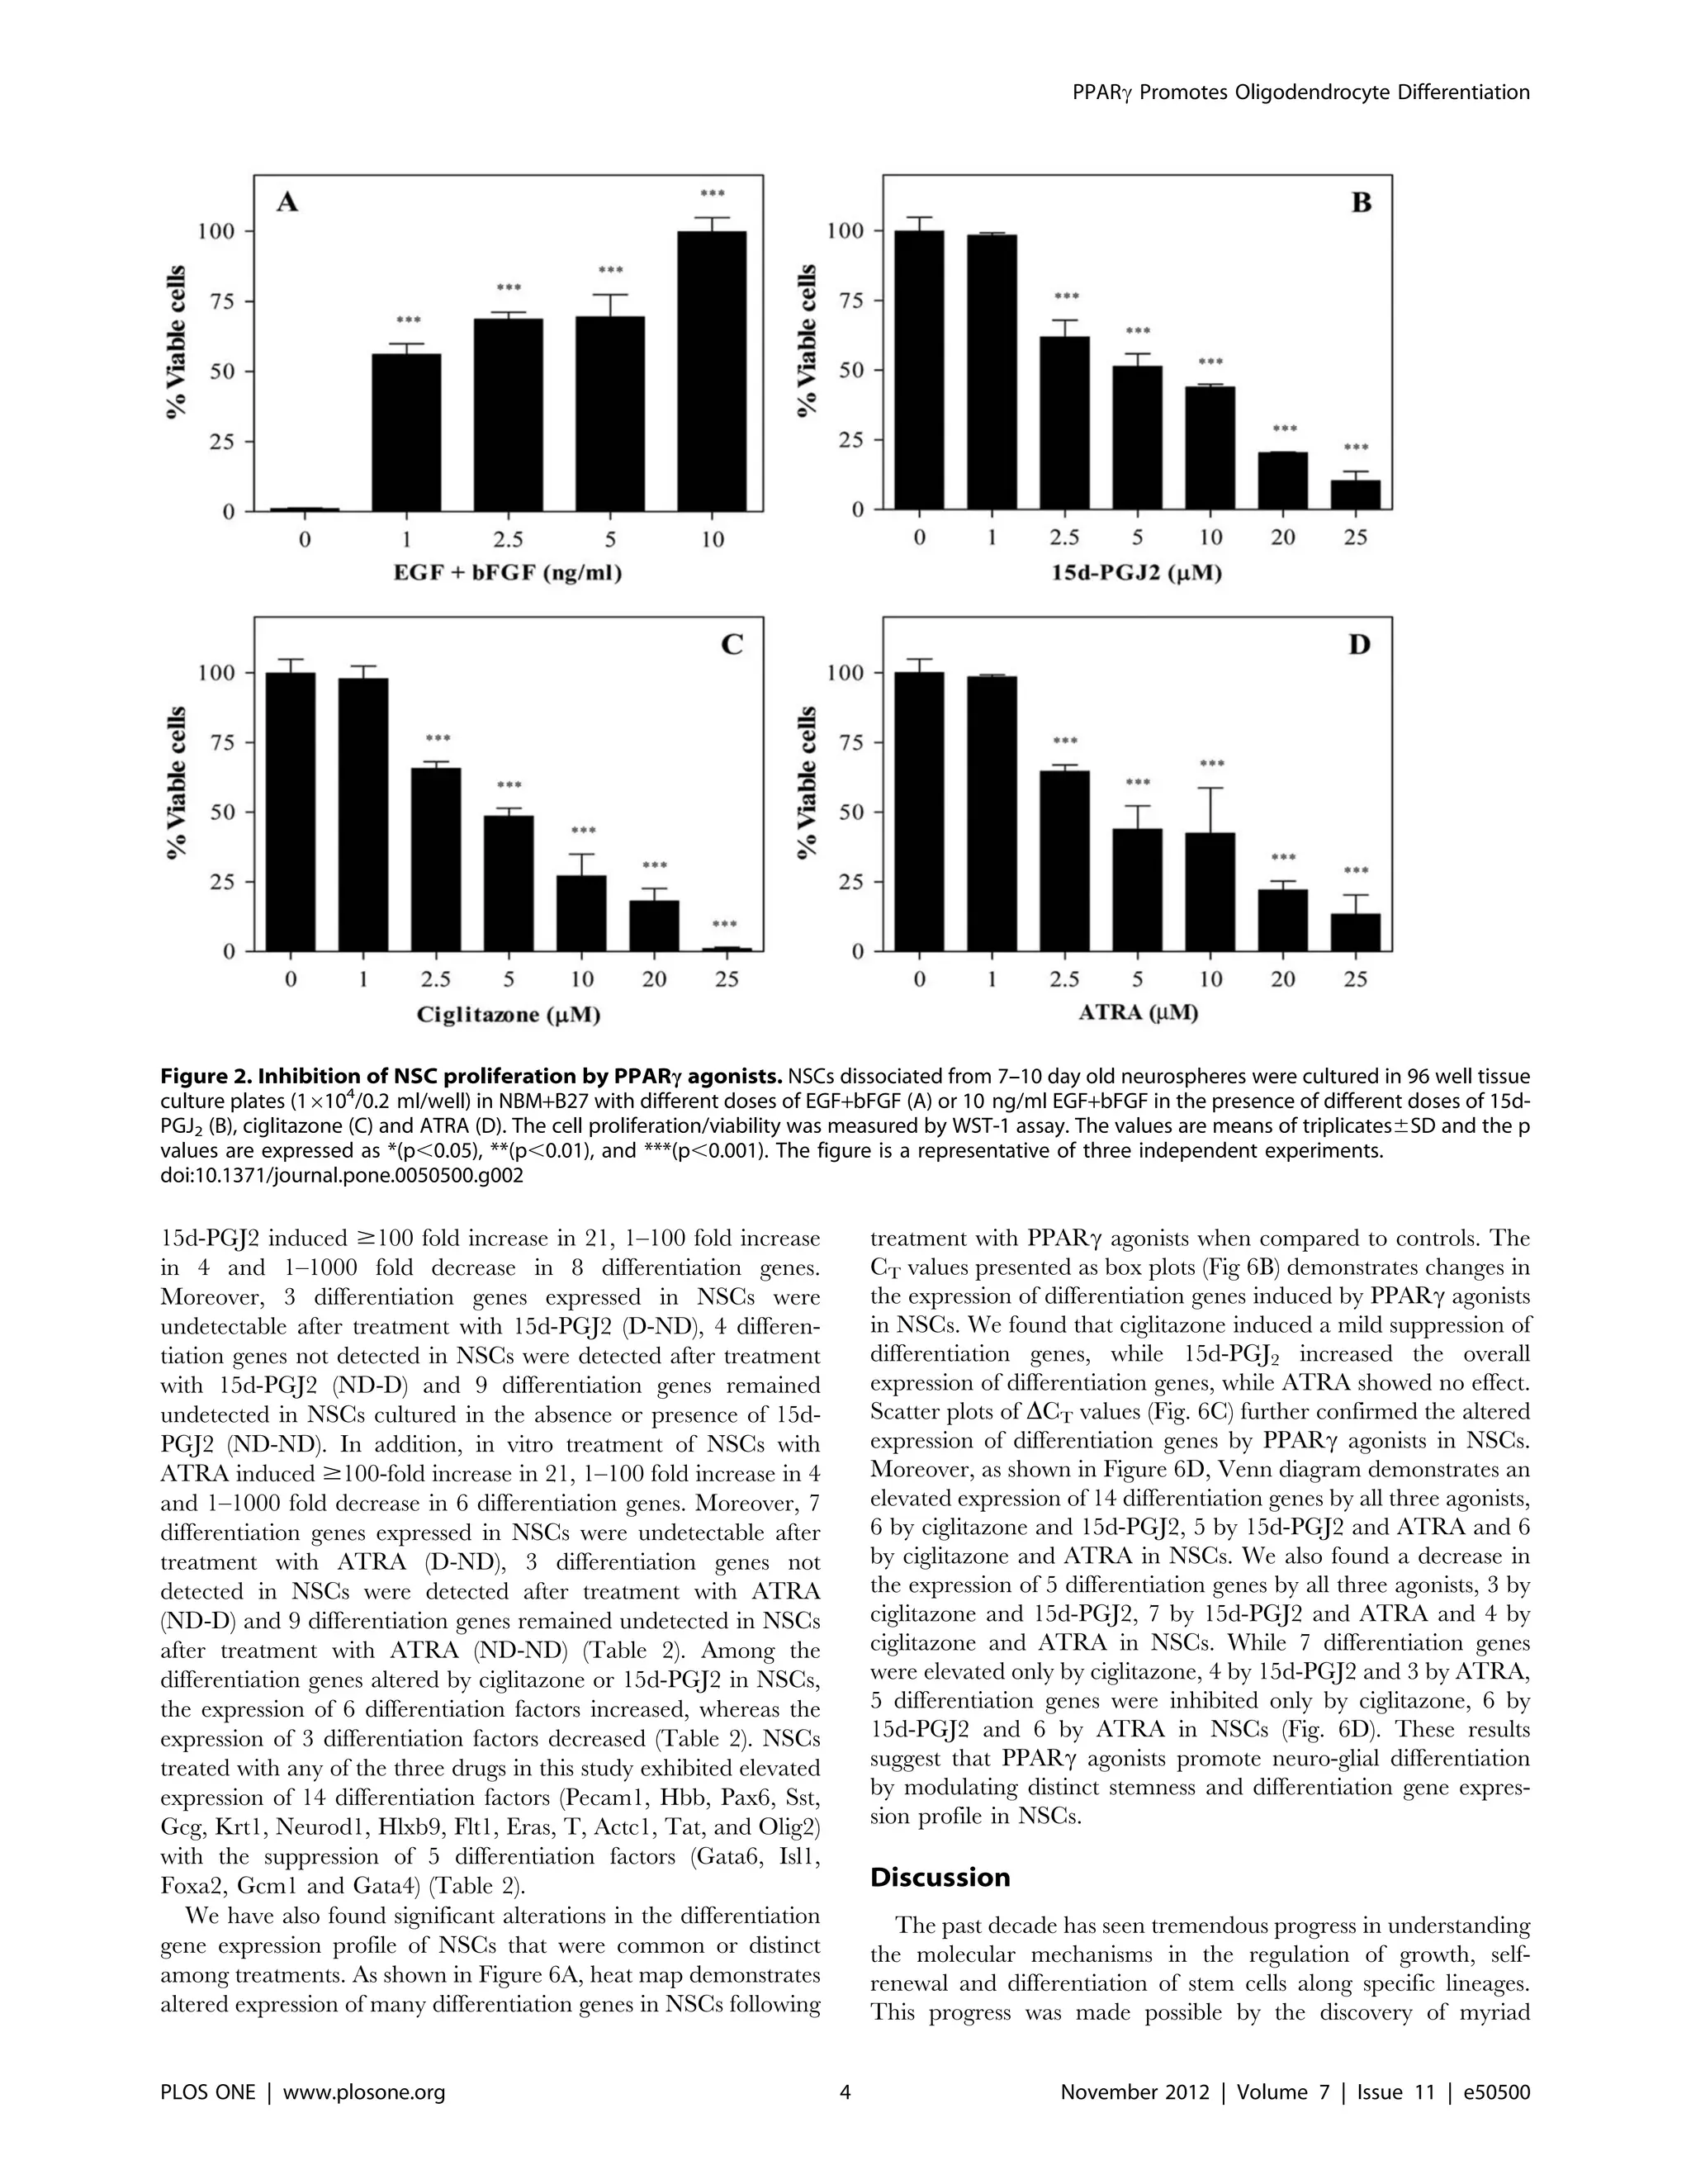
We then examined the effect of PPARc agonists on the
proliferation of NSCs in culture. As shown in Figure 2, in vitro
culture of NSCs in the presence of EGF+bFGF showed a dose-
dependent increase in proliferation or viable cell count as
determined by WST-1 assay. Viable NSCs in the absence of
growth factor was 3% that increased to 56, 68, 69 and 100 percent
by the addition of 1, 2.5, 5 and 10 ng/ml EGF+bFGF, respectively
in culture (Fig. 2A). Interestingly, addition of PPARc agonists
resulted in a dose-dependent decrease in viable cell count in
culture (Fig. 2B, C). While NSCs cultured in NBM with
EGF+bFGF in the absence of 15d-PGJ2 showed 100% viability,
which decreased to 98, 62, 51, 44, 20, and 10 percent following
addition of 1, 2.5, 5, 10, 20 and 25 mM 15d-PGJ2, respectively
(Fig. 2B). Similarly, NSCs cultured in the absence of ciglitazone
showed 100% viability, which decreased to 98, 66, 48, 27, 18 and
1 percent following addition of 1, 2.5, 5, 10, 20 and 25 mM
ciglitazone, respectively (Fig. 2C). Moreover, NSCs cultured with
ATRA also showed a dose-dependent decrease in EGF+bFGF-
induced proliferation/viability. While NSCs cultured with
EGF+bFGF in the absence of ATRA showed 100% viability that
decreased to 98, 65, 44, 42, 22 and 13 percent following addition
of 1, 2.5, 5, 10, 20 and 25 mM ATRA, respectively in culture
(Fig. 2D). These results suggest that PPARc agonists inhibit
EGF+bFGF-induced proliferation and survival of NSCs in culture.
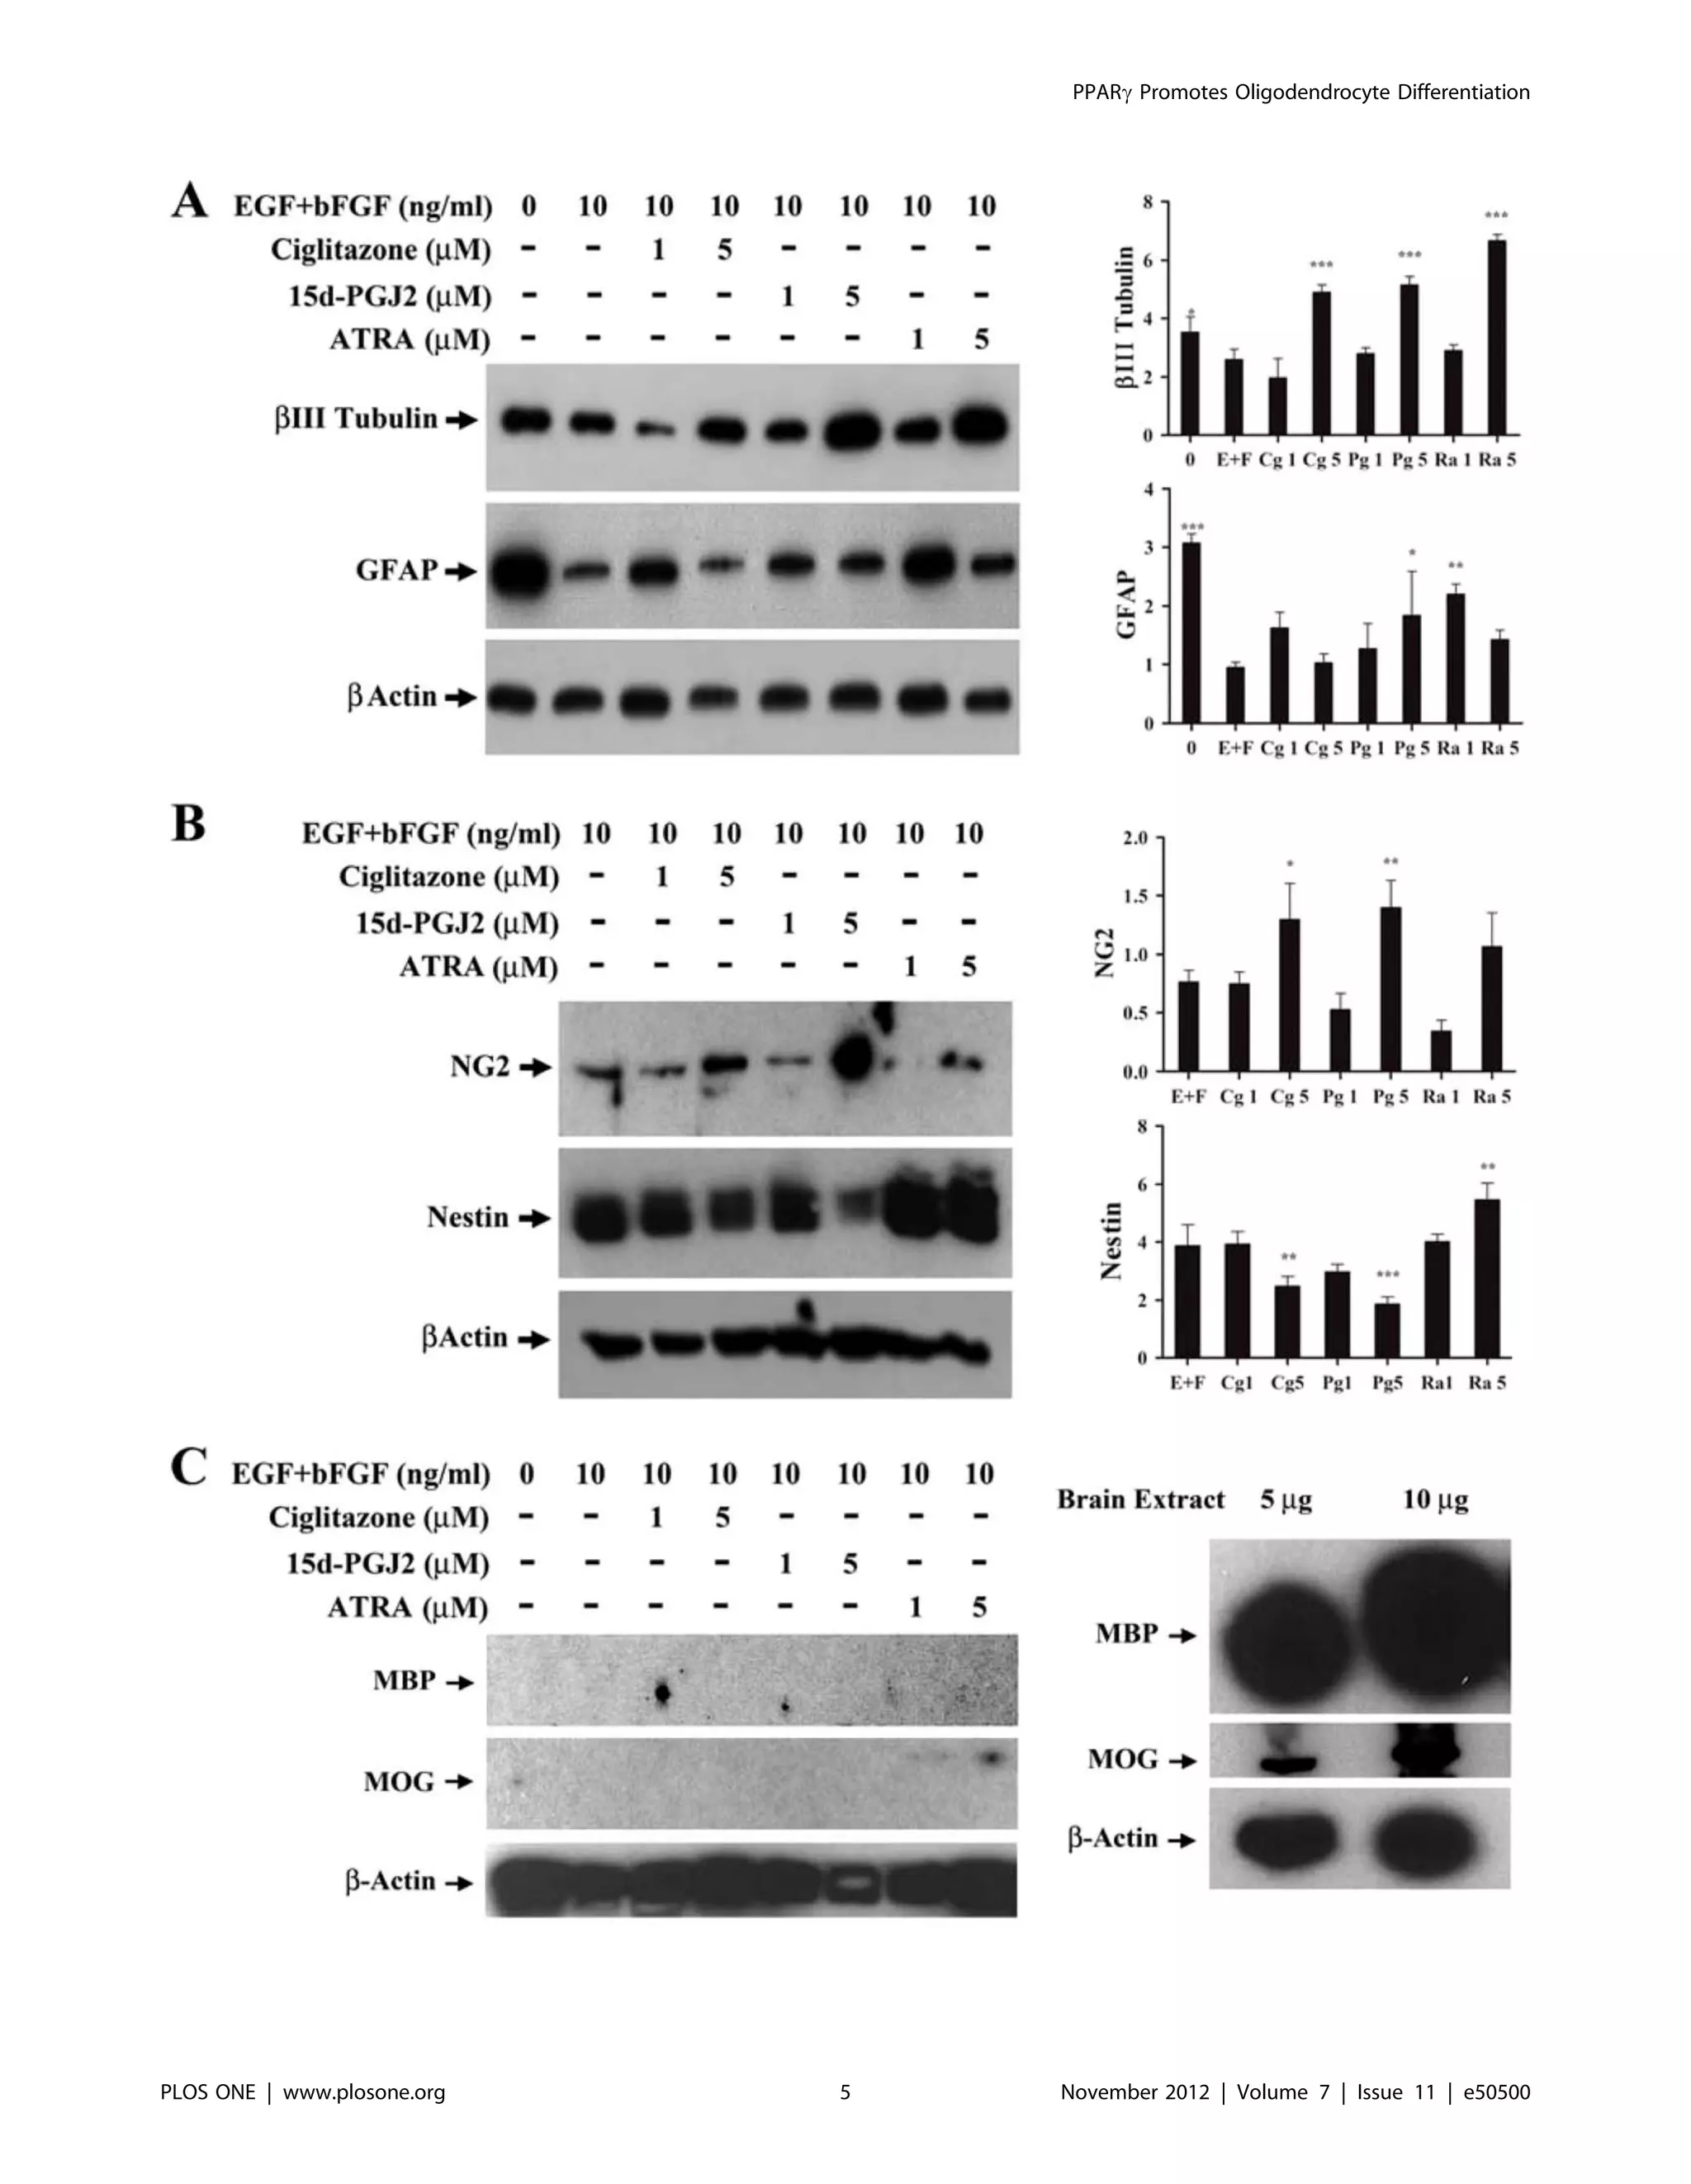
PPARc agonists induce oligodendrocyte differentiation
of NSCs
To study the effect of PPARc agonists on NSC differentiation
we examined the expression of neuro-glial markers by Western
blot analysis. As shown in Figure 3A, NSCs cultured in NBM+B27
in the absence of EGF+bFGF expressed elevated levels of neuron-
specific b-III tubulin that decreased significantly following addition
of 10 ng/ml EGF+bFGF. Interestingly, NSCs cultured with
EGF+bFGF in the presence of 5 mM ciglitazone, 15d-PGJ2, or
ATRA showed a significant increase in the expression of b-III
tubulin compared to EGF+bFGF treated cells. Similarly, NSCs
cultured in the absence of EGF+bFGF expressed elevated levels of
astrocyte-specific GFAP that decreased significantly following the
addition of 10 ng/ml EGF+bFGF. Treatment with 1 or 5 mM
ciglitazone, 15d-PGJ2, or ATRA resulted in a partial increase in
GFAP expression, reaching statistical significance at 5 mM 15d-
PGJ2 and 1 mM ATRA compared to EGF+bFGF control (Fig. 3A).
Moreover, NSCs cultured in NBM with EGF+bFGF expressed
detectable levels of oligodendrocyte progenitor-specific NG2
proteoglycan that increased significantly after the addition of
5 mM ciglitazone or 15d-PGJ2 but not with ATRA (Fig. 3B). In
addition, NSCs cultured with EGF+bFGF showed elevated
expression of stem cell marker Nestin that decrease significantly
after the addition of 5 mM ciglitazone or 15d-PGJ2 but increased
after treatment with ATRA (Fig. 3B). However, NSCs cultured in
NBM with EGF+bFGF in the presence of PPARc agonists failed
to express myelin basic protein (MBP) or myelin oligodendrocyte
glycoprotein (MOG), as detected in adult mouse brain (Fig. 3C).
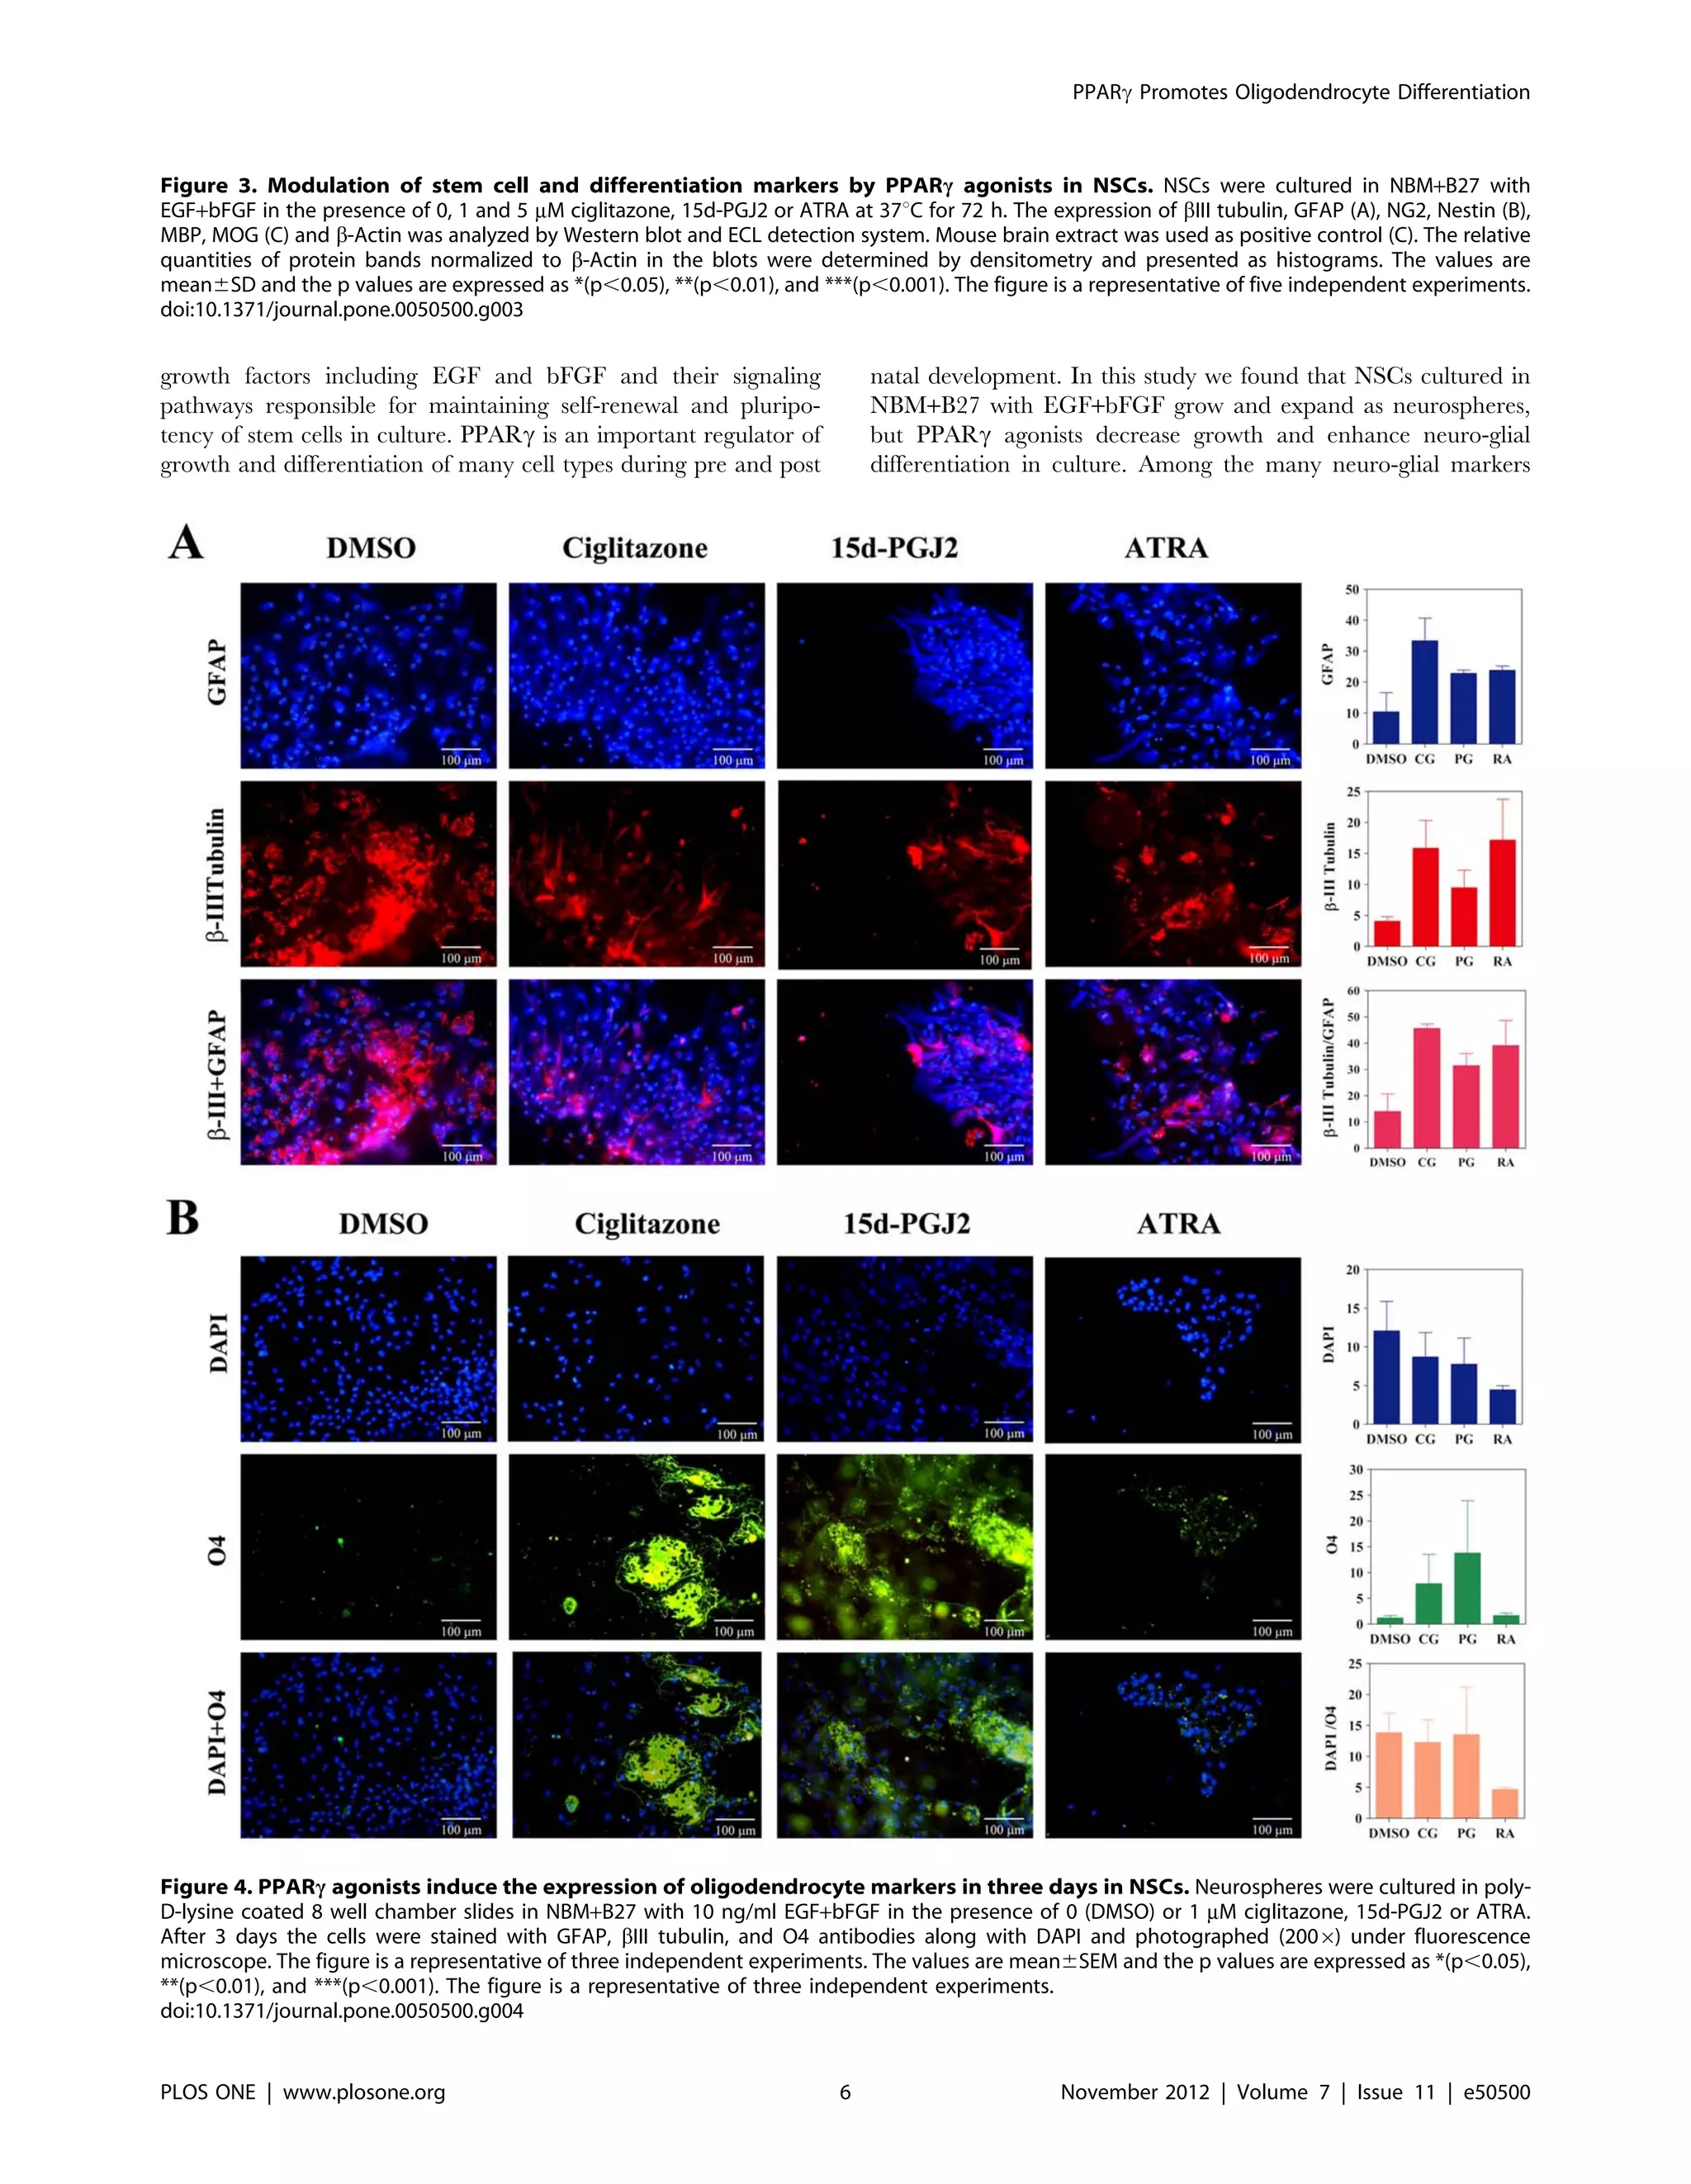
To further determine the effect of PPARc agonists on NSC
differentiation, we examined the expression of neuro-glial markers
by immunocytochemical techniques. As shown in Figure 4 and 5,
NSCs cultured in NBM+B27 in the presence of EGF+bFGF
showed detectable expression of astrocyte-specific GFAP and
neuronal b-III tubulin that increased after treatment with
ciglitazone, 15d-PGJ2 or ATRA for three and seven days,
respectively. Quantitative analysis showed a trend towards
increase in GFAP and b-III tubulin expression in NSCs cultured
with ciglitazone, 15d-PGJ2 or ATRA compared to DMSO
control. In addition, NSCs cultured with EGF+bFGF in the
presence of ciglitazone or 15d-PGJ2 showed considerable increase
in the expression of pre-oligodendrocyte specific O4 reactivity with
characteristic morphology and migration pattern in 3 days that
further increased with 15d-PGJ2 by day 7 (Fig. 4, 5). However,
NSCs cultured with EGF+bFGF in the absence of PPARc agonists
or in the presence of ATRA showed only minimal O4 reactivity on
day 3 with a marginal increase by day 7 (Fig. 4, 5). These findings
suggest that PPARc agonists induce the differentiation of
oligodendrocyte progenitor cells from NSCs and may require
additional signals to promote their maturation to myelinating
oligodendrocytes.
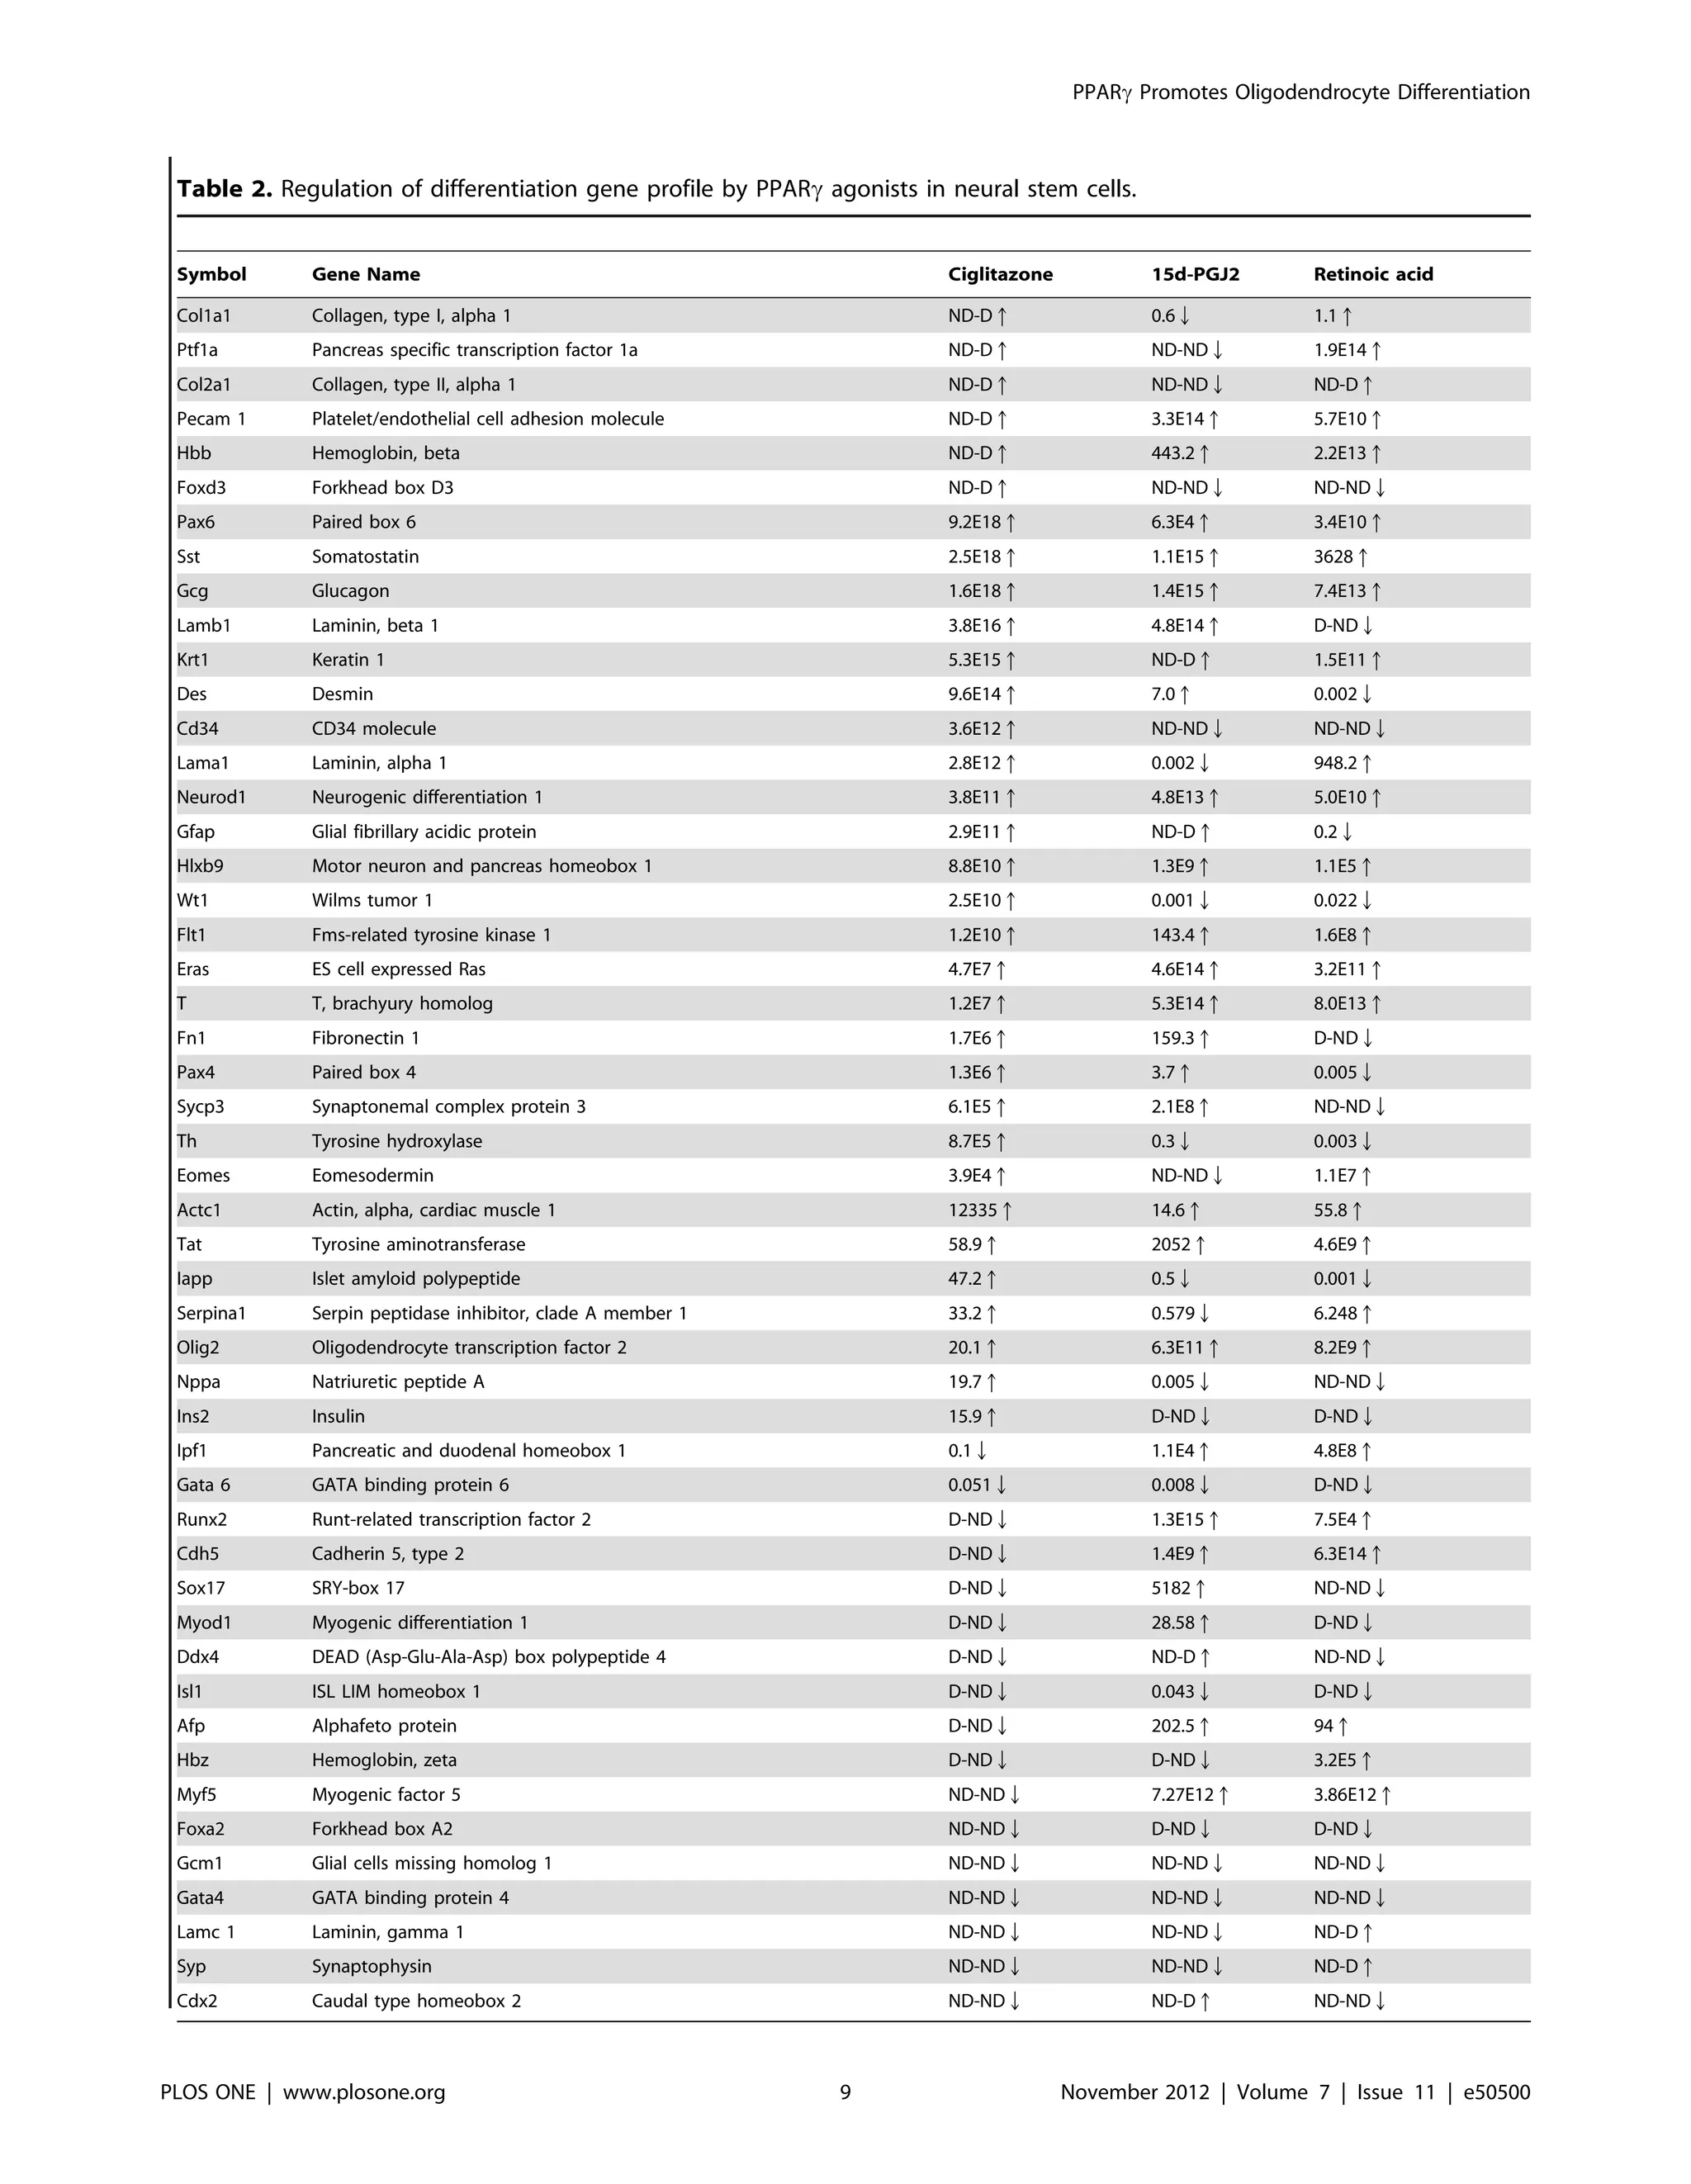
PPARc agonists modulate the expression of stemness
genes in NSCs
To define the mechanisms by which PPARc agonists regulate
neuro-glial differentiation of NSCs, we analyzed stemness gene
profile using TaqMan low density gene array. This array includes
a panel of 40 stemness and 50 differentiation genes. As shown in
Table 1 and 2, in vitro culture of NSCs in NBM with EGF+bFGF
in the presence of PPARc agonists resulted in significant changes
in the expression of many stemness and differentiation genes in
three days. Treatment with ciglitazone induced $100-fold
increase in 22, 1–100 fold increase in 4 and 4 fold decrease in
one stemness gene. Moreover, 9 stemness genes expressed in NSCs
were undetectable after treatment with ciglitazone (D-ND) and 4
stemness genes were undetected in NSCs cultured in the absence
or presence of ciglitazone (ND-ND). Similarly, in vitro treatment
of NSCs with 15d-PGJ2 induced $100-fold increase in 14, 1–100
fold increase in 5 and $100 fold decrease in 2 stemness genes.
Moreover, 6 stemness genes expressed in NSCs were undetectable
PPARc Promotes Oligodendrocyte Differentiation
PLOS ONE | www.plosone.org 2 November 2012 | Volume 7 | Issue 11 | e50500](https://image.slidesharecdn.com/ded0abc7-ba86-4cf3-b3d0-afbedba0441b-160418162756/75/article2-2-2048.jpg)
![analyzed, we observed a significant increase in the expression of
NG2 in PPARc agonist treated NSCs, suggesting oligodendrocyte
progenitor differentiation of NSCs in culture. Moreover, an
increase in the expression of antigens detected by O4 antibody,
suggests pre-oligodendrocyte differentiation of NSCs following
treatment with PPARc agonists. These findings are consistent with
previous reports showing the detection of NG2 and O4 as markers
of NSC differentiation to oligodendrocyte progenitor cells in
culture. Stabenfeldt et al., used O4 as a marker for oligodendro-
cyte differentiation of mouse NSCs in 7 day old cultures [43]. A
study by Sypecka et al., using human cord blood derived NSCs
also demonstrated oligodendroglial differentiation by O4 staining
[44]. Sher et al., used several markers to identify various stages of
oligodendrocyte differentiation (PDGFRa - precursor, progenitor,
NG2 - progenitor, RIP - preoligodendrocyte and MBP -
myelinating mature oligodendrocyte) in NSCs derived from
C57BL/6 mice [45]. However, we found that NSCs cultured in
the presence of PPARc agonists failed to express MBP or MOG as
detected in mouse brain extracts, suggesting that additional signals
are required to induce maturation of oligodendrocytes.
Growth and differentiation signals are integrated by key
transcription factors which regulate specific gene clusters to allow
Figure 5. PPARc agonists induce the expression of oligodendrocyte markers in seven days in NSCs. Neurospheres were cultured in poly-
D-lysine coated 8 well chamber slides in NBM+B27 with 10 ng/ml EGF+bFGF in the presence of 0 (DMSO) or 1 mM ciglitazone, 15d-PGJ2 or ATRA.
After 7 days the cells were stained with GFAP, bIII tubulin, and O4 antibodies along with DAPI and photographed (2006) under fluorescence
microscope. The values are mean6SEM and the p values are expressed as *(p,0.05), **(p,0.01), and ***(p,0.001). The figure is a representative of
three independent experiments.
doi:10.1371/journal.pone.0050500.g005
PPARc Promotes Oligodendrocyte Differentiation
PLOS ONE | www.plosone.org 7 November 2012 | Volume 7 | Issue 11 | e50500](https://image.slidesharecdn.com/ded0abc7-ba86-4cf3-b3d0-afbedba0441b-160418162756/75/article2-7-2048.jpg)
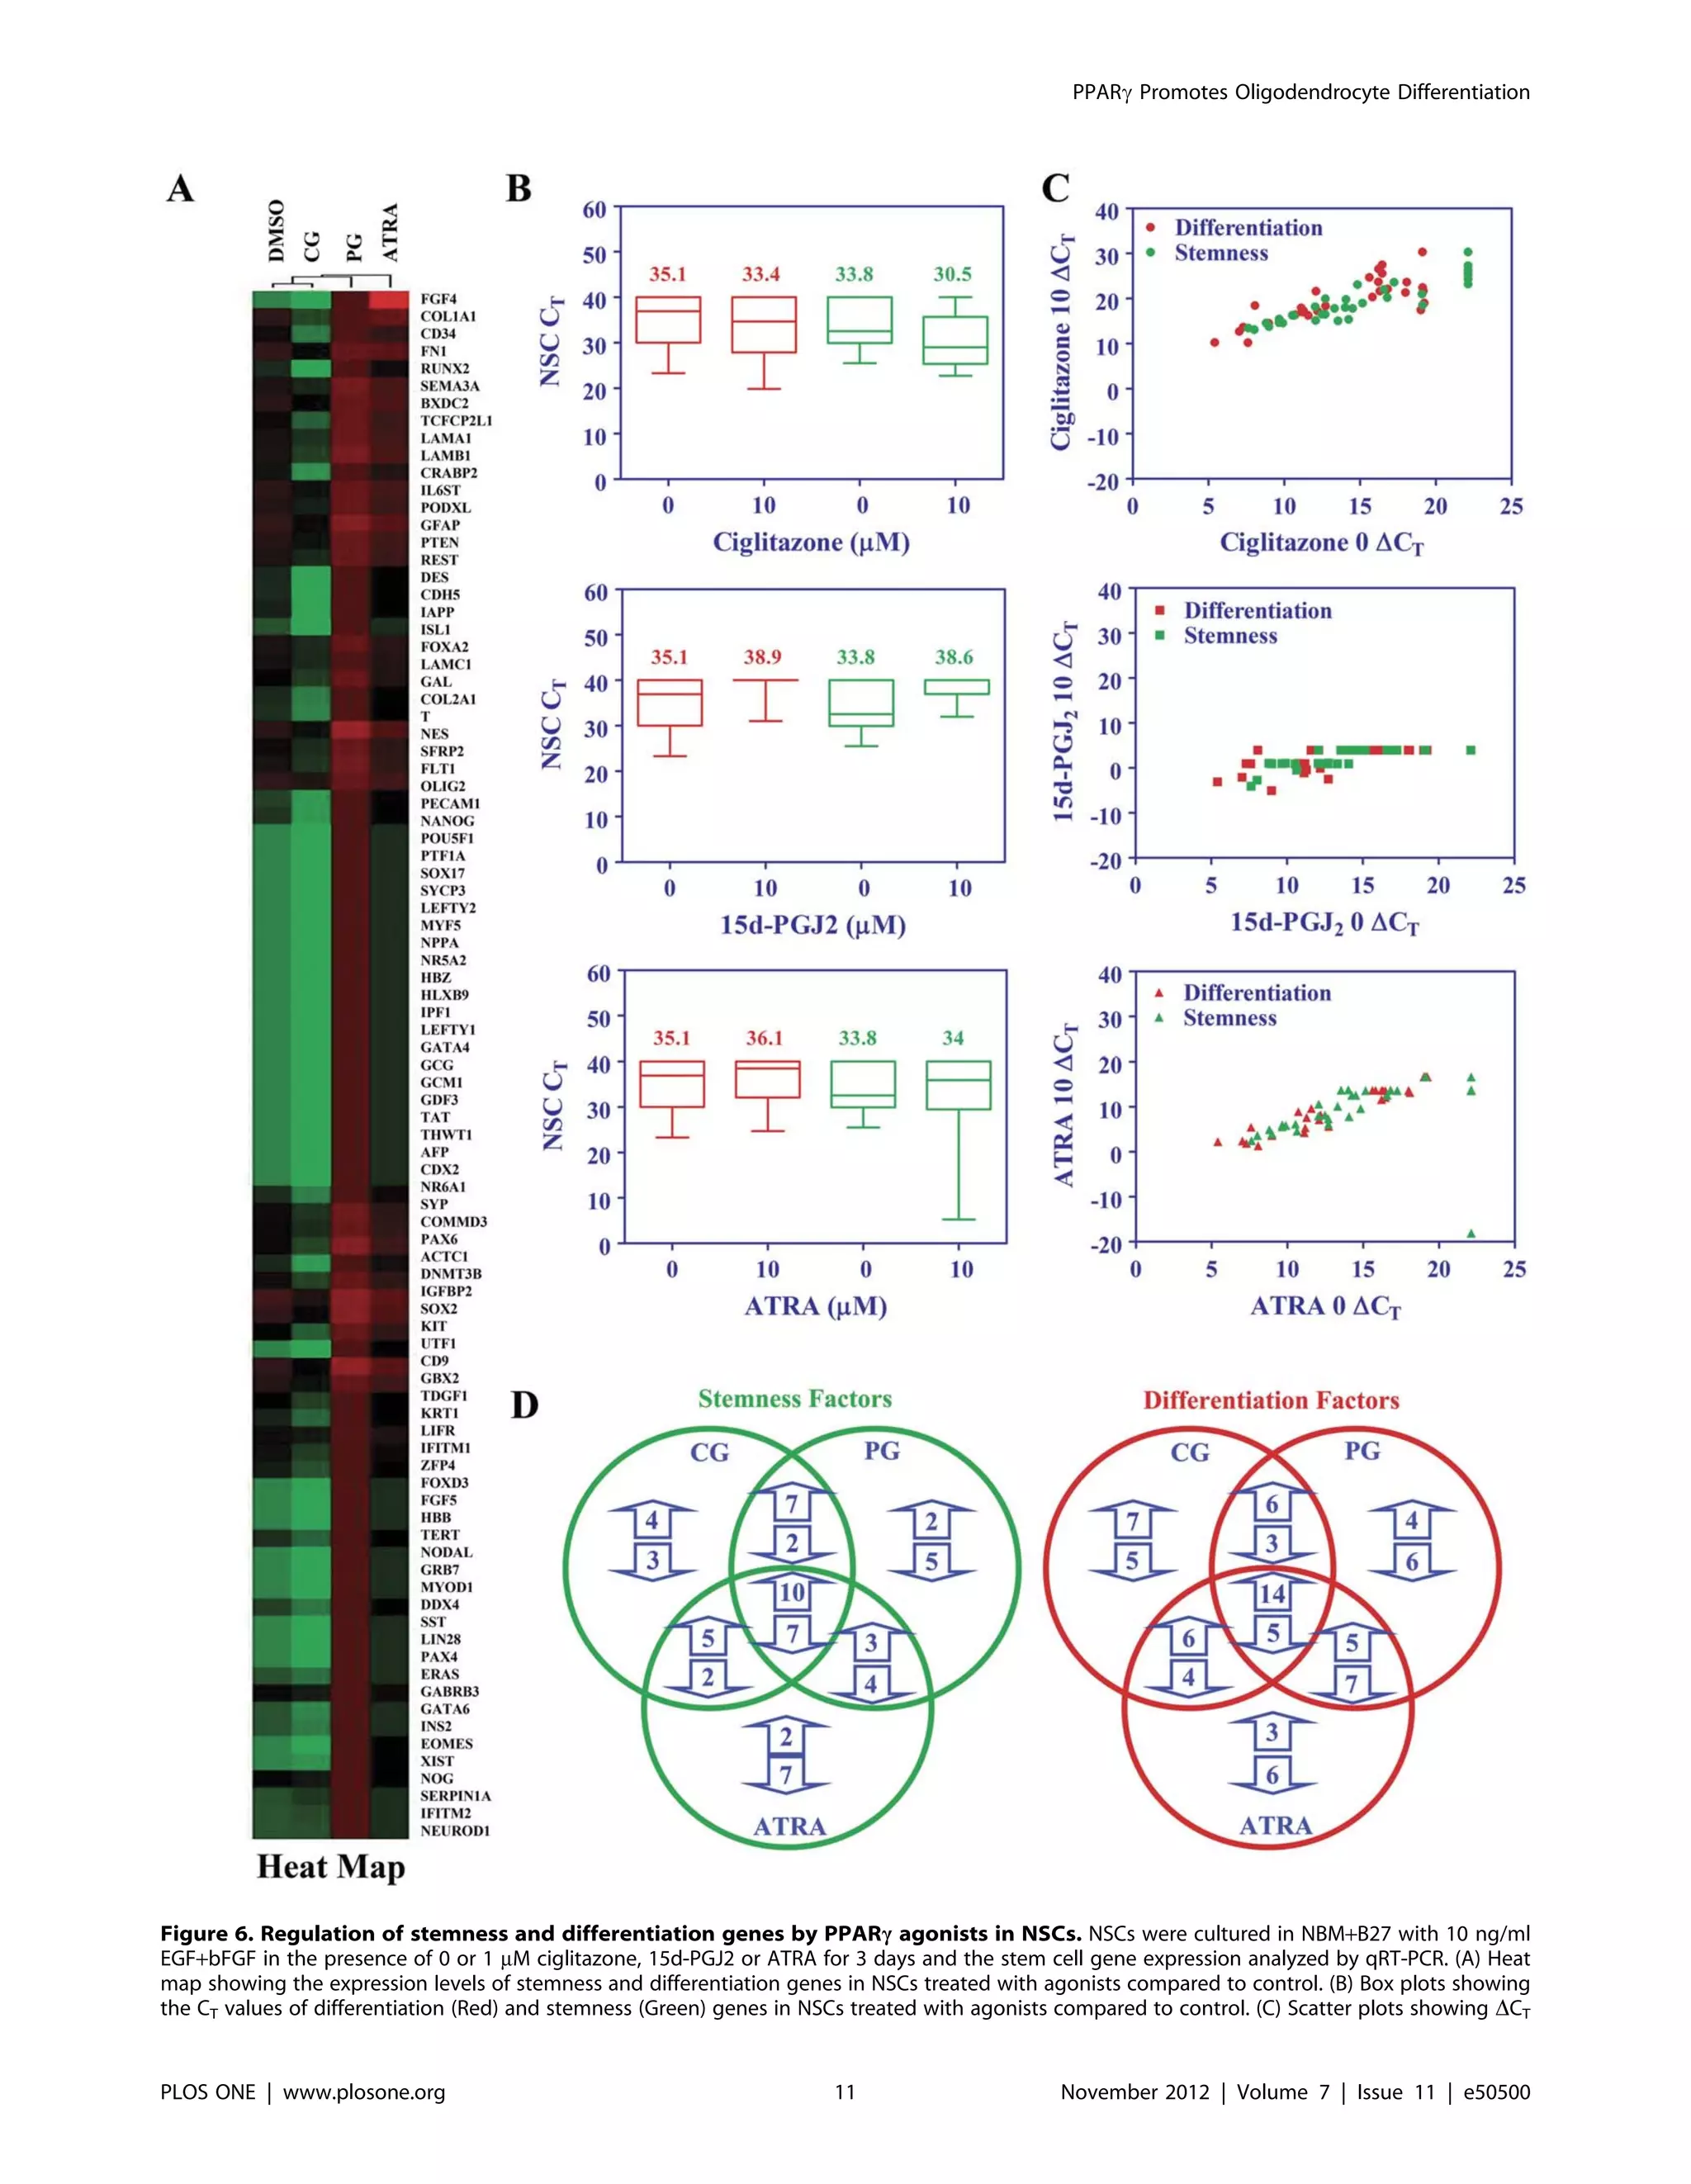
![proliferation or differentiation to acquire specialized functions in
NSCs. To define the mechanisms by which PPARc agonists
regulate growth and self-renewal of NSCs, we analyzed the
expression of 40 stemness genes. Among the many altered
stemness genes, Sox2 was one of the important genes inhibited
by PPARc agonists and ATRA in NSCs. Sox2 is a key member of
the Sox (SRY-like HMG box) family transcription factors
expressed in embryonic stem cells (ES), NSCs and trophoblast
stem cells, but not in differentiated cells and is essential for
maintaining pluripotency [46–49]. CD9 is a surface protein
expressed in neural progenitor cells [50] that was also suppressed
by PPARc agonists. The suppression of Sox2, CD9 and other
Table 1. Regulation of stemness gene profile by PPARc agonists in neural stem cells.
Symbol Gene Name Ciglitazone 15d-PGJ2 Retinoic acid
Nog Noggin 9.2E18q 1.6E15q 4 E12q
Crabp2 Cellular retinoic acid binding protein 2 9.2E18q ND-Dq 4.8E14q
Commd3 COMM domain containing 3 9.2E18q ND-NDQ 8.1E12q
Dnmt3b DNA cytosine-5-methyltransferase 3b 1.4E17q 1.8E12q 1.6E12q
Srfp2 Frizzled-related protein 7.1E13q 2.5E7q 4082q
Gdf3 Growth differentiation factor 3 1.9E12q 5771q ND-NDQ
Rest RE1-silencing transcription factor 3.3E11q ND-NDQ 0.001Q
Igfbp2 Insulin-like growth factor binding protein 2 1.3E11q ND-NDQ 1.7q
Nes Nestin 3.0E10q ND-NDQ 1439q
Gal Galanin prepropeptide 5.8E8q 1.2E9q 24.5q
Pou5f1 POU class 5 homeobox 1 2.3E8q 3.8E14q 0.022Q
Xist X (inactive)-specific transcript 8.05E7q 9.17E9q ND-NDQ
Zfp42 Zinc finger protein 42 homolog 8.8E6q 18.8q ND-NDQ
Bxdc2 BRX1, biogenesis of ribosomes, homolog 1.1E6q 7.6E9q 9.5E6q
Podxl Podocalyxin-like 2.8E5q 7.8E14q 16.1q
Tdgf1 Teratocarcinoma-derived growth factor 1 4.3E4q 14.7q 0.003Q
Lin 28 Lin-28 homolog A 2.1E4q ND-NDQ D-NDQ
Fgf5 Fibroblast growth factor 5 1.8E4q D-NDQ 0.11Q
Utf1 Undifferentiated embryonic cell transcription factor 1.4E4q 2.9q D-NDQ
Pten Phosphatase and tensin homolog 6799q ND-NDQ ND-NDQ
Kit Feline sarcoma viral oncogene 757.2q 191.9q 8.1E11q
Lefty1 Left-right determination factor 1 112.4q 5.9E11q 7.2E11q
NR5a2 Nuclear receptor subfamily 5 12.1q 0.003Q ND-Dq
Ifitm2 Interferon induced transmembrane protein 2 11.8q 1.4E7q D-NDQ
Nodal Nodal homolog 9.8q 0.002Q 1.5E10q
Lefty2 Left-right determination factor 2 1.2q ND-Dq 1.6q
Grb7 Growth factor receptor-bound protein 7 0.4Q ND-Dq 2.5E7q
Fgf4 Fibroblast growth factor 4 D-NDQ 4.3E16q 2.6E14q
Gbx2 Gastrulation brain homeobox 2 D-NDQ 6.3E10q 2.5q
Tert Telomerase reverse transcriptase D-NDQ 16.4q 0.002Q
Tfcp2l1 Transcription factor CP2-like 1 D-NDQ 8.9q 0.003Q
Sox2 SRY-box 2 D-NDQ D-NDQ 0.011Q
Lifr Leukemia inhibitory factor receptor alpha D-NDQ D-NDQ D-NDQ
CD9 CD9 molecule D-NDQ D-NDQ D-NDQ
Nr6a1 Nuclear receptor subfamily 6, group A, member 1 D-NDQ D-NDQ D-NDQ
Nanog Nanog homeobox D-NDQ ND-NDQ D-NDQ
Gabrb3 GABA A receptor, beta 3 ND-NDQ D-NDQ 0.5Q
Il6st Interleukin 6 signal transducer ND-NDQ ND-NDQ ND-Dq
Sema3a Sema domain, immunoglobulin domain (Ig) ND-NDQ ND-NDQ ND-Dq
Ifitm1 Interferon induced transmembrane protein 1 ND-NDQ ND-NDQ ND-NDQ
NSCs were cultured in NBM with EGF+bFGF in the presence of DMSO, ciglitazone, 15d-PGJ2 or ATRA for 3 days. The stemness gene expression was analyzed by qRT-PCR
using a 384 gene card array. The fold change was calculated using automatic threshold setting and is based on expression levels in DMSO treated cells as 1 after
normalizing to 18S or GAPDH. The genes in the table are arranged from high to low expression in ciglitazone treated cells. ND, not detected and D, detected. Arrows
indicate up or down regulated genes. This data is a representative of two independent experiments.
doi:10.1371/journal.pone.0050500.t001
PPARc Promotes Oligodendrocyte Differentiation
PLOS ONE | www.plosone.org 8 November 2012 | Volume 7 | Issue 11 | e50500](https://image.slidesharecdn.com/ded0abc7-ba86-4cf3-b3d0-afbedba0441b-160418162756/75/article2-8-2048.jpg)
![stemness factors in NSCs suggests the inhibition of self-renewal
and stemness by PPARcagonists. We have also observed the
upregulation of many stemness genes by PPARc agonists in NSCs.
Among them Noggin, a stemness gene implicated in neurogenesis
and the formation of anterior neural patterning [51], was elevated
by PPARc agonists and ATRA. PPARc agonists and ATRA also
increased the expression of cellular retinoic acid binding protein
(Crabp2), known to mediate retinoic acid induced motor neuron
differentiation [52]. Moreover, PPARc agonists and ATRA
increased the expression of Galanin, a protein essential for the
development and survival of a subset of dorsal root ganglia cells
[53] and basal forebrain cholinergic neurons [54]. This is
consistent with earlier studies showing the upregulation of Galanin
mRNA and protein levels after sciatic [55], facial [56] or vagal
[57] nerve injury, suggesting its involvement in nerve repair. Our
findings suggest that the down-regulation of a subset of stemness
genes is sufficient to inhibit growth and self-renewal of NSCs.
To further determine the mechanism in the promotion of
neuro-glial differentiation of NSCs by PPARc agonists, we
analyzed the expression of 50 differentiation genes. Oligodendro-
cyte differentiation factor 2 (Olig2) is one of the many
differentiation factors elevated following treatment with PPARc
agonists that is critical in maintaining oligodendrocyte phenotype
[58]. Therefore, elevated Olig2 and O4 expression as demon-
strated in this study could be a mechanism by which PPARc
agonists promote oligodendrocyte differentiation of NSCs. We
have also found that PPARcagonists increase the expression of
glial fibrillary acidic protein (GFAP) in NSCs, indicating astrocyte
differentiation in culture. PPARc agonists and ATRA also induced
the expression of Pecam1 in NSCs. Earlier studies have shown that
PPARc ligands induce gastro-protective and ulcer healing
properties by increasing the expression of Pecam-1 [59]. Pecam-
1 expressed in NSCs residing in specialized niches closely
associated with blood vessels in adult brain [60,61] may mediate
cross-talk with endothelial cells (ECs) to regulate neurogenesis and
angiogenesis [62]. PPARc agonists and ATRA also induced the
expression of Neurogenic differentiation factor (Neurod1), a
member of the basic helix-loop-helix (bHLH) transcription factor
that plays a role in the development of nervous and endocrine
systems [63]. Neurod1-null mice exhibit behavioral abnormalities
due to a reduction in sensory neurons and Neurod1 regulates
insulin gene expression by binding to a critical E-box motif on
insulin promoter [64]. Pancreas specific transcription factor 1a
(Ptf1a), involved in the maturation of pancreatic b cells, insulin
production and glucose homeostasis [65,66] is also induced by
ciglitazone and ATRA in NSCs. Alphafeto protein (Afp)
expression was enhanced in NSCs following treatment with 15d-
PGJ2 or ATRA. AFP is expressed in early embryos, hematopoietic
progenitor cells and in adult brain [67] and PPARc agonists
upregulate Afp expression and differentiation of hepatic oval cells
[68]. Thus the upregulation of selective differentiation factors
could be a mechanism by which PPARcagonists promote neuro-
glial differentiation of NSCs. Other studies have demonstrated
that in vitro differentiation and maturation of oligodendrocytes
depends on many factors, including T3 function, ECM interac-
tions and modulation of signaling pathways [69,70]. We have also
found an increase in the expression of Olig2 and other genes
relevant to oligodendrocyte differentiation of NSCs following
exposure to PPARc agonists. Our future studies will further
explore the role of specific stemness and differentiation genes
altered by PPARc agonists in promoting neuro-glial differentiation
of NSCs. Our findings suggest that PPARc agonists could prove
beneficial in the treatment of neurodegenerative diseases.
Earlier studies have reported conflicting results on the influence
of PPARc agonists on NSCs. Wada et al., reported elevated
expression of PPARc in NSCs and PPARcagonists induce
proliferation and inhibited neuronal differentiation by activating
EGFR/ERK pathway, which are attenuated in PPARc+/2
and
PPARc-silenced NSCs in culture [40]. Morales-Garcia et al.,
showed that PPARc agonists increase the number of proliferating
NSCs in the subventricular zone and rostral migration in adult rats
and neurosphere formation and differentiation of NSCs that are
blocked by PPARc antagonists in culture [41]. On the other hand,
Katura et al., reported a novel biphasic effect of 15d-PGJ2 on
EGF-induced proliferation of NSCs with an increase at lower
doses (#0.3 mM) and suppression at higher doses (0.5–10 mM) in
culture [42]. In this study we demonstrated that PPARc agonists
inhibit EGF+bFGF-induced proliferation of NSCs at 1 to 25 mM
doses in culture. We have also found that PPARc agonists promote
neuro-glial differentiation by modulating stemness and differenti-
ation genes in NSCs. We believe that the discrepancy between
earlier reports and our results on the effect of PPARc agonists on
NSCs could be due to difference in culture conditions used. In
particular, we performed all our proliferation and differentiation
assays by culturing NSCs in NBM+B27 with EGF+bFGF in the
absence or presence of PPARc agonists, while in other studies
NSCs were cultured with PPARc agonists in the absence of
EGF+bFGF [40]. Earlier studies have used serum containing
medium in the absence of EGF and bFGF that promote
spontaneous differentiation of NSCs into different types of
neuro-glial cells in culture. However, our objective was to promote
selective lineage specific differentiation of NSCs. We have shown
earlier that PPARc agonists regulate leukemia inhibitory factor
(LIF) induced growth and self-renewal of mouse embryonic stem
cells by modulating Jak-Stat signaling pathway [71,72]. We
reasoned that PPARc agonists would regulate selected signaling
pathways induced by EGF+bFGF in stem cell culture condition.
We also believe that the discrepancy between earlier reports and our
results could be due to difference in the PPARc agonists and the
dose-ranges used. In particular, in earlier studies the growth
inducing effect on NSCs was observed only at lower doses of PPARc
agonists, while higher doses caused an anti-proliferative effect,
which is consistent with our findings [40]. Thus further studies on
NSCs were cultured in NBM with EGF+bFGF in the presence of DMSO, ciglitazone, 15d-PGJ2 or ATRA for 3 days. The differentiation gene expression profile was analyzed
by qRT-PCR using a 384 gene card array. The fold change was calculated using automatic threshold setting and is based on expression levels in DMSO treated cells as 1
after normalizing to 18S or GAPDH. The genes are arranged in the table from high to low expression in ciglitazone treated cells. ND, not detected and D, detected.
Arrows indicate up or down regulated genes. This data is a representative of two independent experiments.
doi:10.1371/journal.pone.0050500.t002
Table 2. Cont.
PPARc Promotes Oligodendrocyte Differentiation
PLOS ONE | www.plosone.org 10 November 2012 | Volume 7 | Issue 11 | e50500](https://image.slidesharecdn.com/ded0abc7-ba86-4cf3-b3d0-afbedba0441b-160418162756/75/article2-10-2048.jpg)
![the regulation of NSCs by PPARc agonists would help to determine
their use in the treatment of neurodegenerative diseases.
Materials and Methods
Reagents
The murine recombinant epidermal growth factor (EGF) was
purchased from PeproTech (Rocky Hill, NJ) and basic fibroblast
growth factor (bFGF) was purchased from R&D Systems
(Minneapolis, MN). Ciglitazone was purchased from CalBiochem
(La Jolla, CA), while 15-Deoxy-D12,14
-Prostaglandin J2 (15d-PGJ2)
came from Sigma Chemicals (St Louis, MO). Anti-b-Actin
antibody was purchased from Santa Cruz Biotechnology Inc.
(Santa Cruz, CA). The HRP conjugated secondary Abs, all-trans
retinoic acid (ATRA) and other chemicals were purchased from
Sigma Chemicals Co. (St Louis, MO). WST-1 reagent (4-[3-(4-
iodophenyl)-2-(4-nitrophenyl)-2H-5-tetrazolio]-1,3-benzene disul-
fonate) was purchased from Roche (Indianapolis, IN). Primary
antibodies specific to glial fibrillary acidic protein (GFAP, anti-goat
polyclonal IgG, sc-6170), beta III tubulin (bIII tubulin, anti-mouse
mAb IgG, sc-51670), Nestin (goat polyclonal IgG, sc-21248),
myelin basic protein (MBP, anti-goat polyclonal IgG, sc-13912),
myelin oligodendrocyte glycoprotein (MOG, anti-mouse mAb
IgG, sc-376138), Neural/Glial Antigen 2 (NG2, anti-rabbit
polyclonal IgG, sc-20162) and horse radish peroxidase (HRP)
conjugated secondary antibodies (Goat anti-rabbit IgG, sc-2004;
donkey anti-goat IgG, sc-2020; goat anti-mouse IgG, sc-2031)
were purchased from Santa Cruz Biotechnology Inc. (Santa Cruz,
CA). The mouse monoclonal oligodendrocyte progenitor marker
O4 antibody (Clone 81-IgM); GFAP (rabbit polyclonal IgG,
01415) and fluorochrome conjugated secondary antibodies
(AMCA conjugated goat anti-rabbit polyclonal IgG, 10214; Texas
red conjugated goat anti-mouse mAb IgG, 10213; FITC
conjugated goat anti-mouse IgM, 10211) were purchased from
Stem Cell Technologies (Vancouver, Canada). The 384 well
TaqMan low density mouse stem cell array and other PCR
reagents were obtained from Applied Biosystems (Foster City, CA).
Cell culture
C57BL/6 mice were obtained from Harlan (Indianapolis, IN)
and the breading colonies were maintained in the animal care
facility at Methodist Research Institute. All animal protocols used
in the experiments were approved by the Institutional Animal
Care and Use Committee. Primary mouse NSCs were generated
by culturing dissociated brain cells from new born (post natal 0–3
day) C57B/6 mice in neurobasal medium (NBM) supplemented
with B27 in the presence of 10 ng/ml bFGF and EGF. The cells
were cultured in 12 well tissue culture plates in 5% CO2 incubator
at 37uC with a medium change on every 2–3 days. The
neurospheres generated in 7–10 days were photographed under
phase contrast microscope (AX70, Olympus Optical, Japan).
Proliferation assay
Proliferation of NSCs was measured by 3
H thymidine uptake
and WST-1 assays. Briefly, NSCs obtained by dissociating
neurospheres using accutase (Invitrogen) were cultured in 96-well
tissue culture plates (16104
/200 ml/well) in NBM with B27 in the
absence or presence of 10 ng/ml EGF, bFGF or EGF+bFGF. 3
H
thymidine (0.5 mCi/well) was added at 48 h and the cells were
harvested after 72 h using a Tomtech harvester 96 (Hamden, CT,
USA). The amount of 3
H thymidine uptake was counted on
Wallac Microbeta liquid scintillation counter (Perkin Elmer,
Fremont, CA) as a measure of proliferation. For WST-1 assay,
NSCs were cultured in 96-well tissue culture plates (16104
/
200 ml/well) in NBM with B27 and 10 ng/ml EGF+bFGF in the
presence of 0, 1, 2.5, 5, 10, 20 and 25 mM ciglitazone, 15d-PGJ2
or ATRA. After 72 h, 10 ml of WST-1 reagent was added to each
well and the absorbance determined at 450 nm using a titer-plate
reader (Alpha Diagnostics, San Antonio, TX).
Immunocytochemistry
Neurospheres generated by culturing brain cells from newborn
mice were transferred to poly-D-lysine coated 8 well chamber
slides (BD Biosciences, San Jose, CA) with NBM+B27 and 10 ng/
ml of EGF+bFGF. We have added DMSO vehicle in the absence
or presence of 1.0 mM ciglitazone, 15d-PGJ2 or ATRA in two
identical wells. After 3 and 7 days the cells were fixed with 1%
paraformaldehyde in PBS for 15 min and stained with a
combination of primary and secondary antibodies by indirect
immunofluorescence technique. The cells in one set were stained
with rabbit polyclonal IgG specific to GFAP followed by AMCA
conjugated polyclonal anti-rabbit IgG and mouse monoclonal IgG
specific to bIII-tubulin followed by Texas red conjugated mouse
monoclonal IgG (Fig 4A and Fig 5A). Other set of cells were
stained with mouse monoclonal IgM (O4) followed by FITC
conjugated anti-mouse IgM and DAPI (Fig 4B and Fig 5B). The
images were photographed using Leica Leitz DMRB fluorescent
microscope (Leica Microsystems, Buffalo Grove, IL, USA) and
presented as individual or merged pictures. Quantitative analysis
of immunofluorescence was performed using ImageJ software
(NIH, http://rsbweb.nih.gov/ij/) and presented as histograms.
Western Blot Analysis
To examine the effect of PPARc agonists on neuro-glial
differentiation, NSCs were cultured in NBM+B27 with 10 ng/ml
EGF+bFGF in the presence of 0, 1, and 5 mM ciglitazone, 15d-
PGJ2 or ATRA at 37uC. The cells were harvested after 72 h and
whole cell lysates prepared using lysis buffer (0.2 M Tris-HCl
pH 6.8, 0.8% SDS, 4% Glycerol, 0.588 M b-mercaptoethanol,
0.05 M EDTA, 8 mg/ml bromophenol blue) for 5 min. Adult
C57BL/6 mouse brain was homogenized in lysis buffer and used
as positive control. The total protein samples were resolved on 8%
(Nestin and NG-2) or 12% (b-III Tubulin, GFAP, MBP and
MOG) SDS-PAGE, transferred to nylon (PVD) membrane
(BioRad, Hercules, CA), and the residual binding sites blocked
by incubation with TBST (10 mM Tris-HCl, pH 8.0, 150 mM
NaCl, and 0.05% Tween 20) containing 3% BSA for 1 h.
Membranes were incubated with anti-bIII tubulin, anti-GFAP,
anti-NG2, anti-Nestin, anti-MBP, anti-MOG or anti-b-Actin
antibody (1:200–500) in TBST containing 1% BSA at 4uC
overnight. The blots were washed and incubated with horseradish
peroxidase (HRP)-conjugated secondary antibodies in TBST
(1:2500–5000) for 1 h and developed using enhanced chemilumi-
nescence (ECL) detection system and film (Amersham Life
Science, Arlington Heights, IL) according to manufacturer’s
instructions. Quantitative analyses of Western blots were per-
formed using FluorChem HD2 software (Alpha Innotech/
Quansys Biosciences, West Logan, Utah).
values of differentiation (Red) and stemness (Green) genes in NSCs treated with agonists compared to control. (D) Number of stemness and
differentiation genes altered is presented as Venn diagram. The figure is representative of two independent experiments.
doi:10.1371/journal.pone.0050500.g006
PPARc Promotes Oligodendrocyte Differentiation
PLOS ONE | www.plosone.org 12 November 2012 | Volume 7 | Issue 11 | e50500](https://image.slidesharecdn.com/ded0abc7-ba86-4cf3-b3d0-afbedba0441b-160418162756/75/article2-12-2048.jpg)