The document outlines ARK Invest's annual research report for 2020, focusing on investment opportunities in disruptive innovations across various sectors. It emphasizes the importance of understanding technological advancements such as deep learning, streaming media, and electric vehicles in identifying growth areas. Investors are cautioned about risks associated with innovation, including market uncertainties and regulatory challenges.
![7
BIGIDEAS2020
[1] Source: ARK Investment Management LLC, 2019; Based on company derived statistics.
[2] Kyle Wiggers, “Waymo’s autonomous cars have driven 20 million miles on public roads”, VentureBeat https://arkinv.st/2N5fC4D.
This is not a recommendation in relation to any named securities and no warranty or guarantee is provided. Any references to particular securities are for illustrative purposes only.
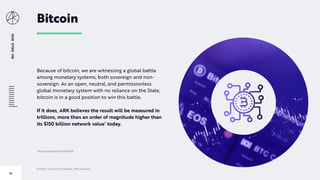
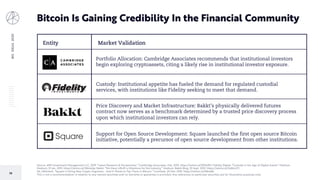
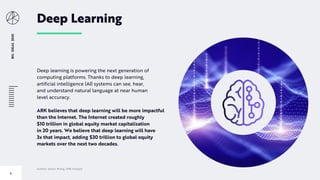
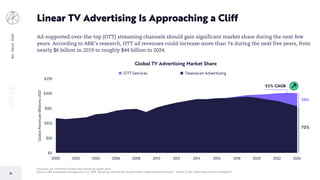
Deep Learning Is Powering the Next Generation
of Computing Platforms
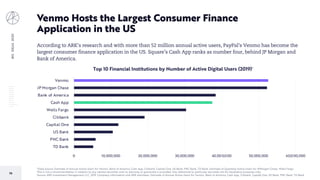
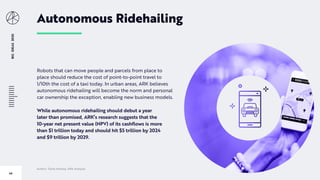
In 2019, smart speakers responded to 100
billion commands and questions, a number
that increased 50% in just one year.1
Waymo vehicles have traveled
more than 20 million fully
autonomous miles.2
TikTok uses deep learning for video
recommendations and is growing its
user base 10x faster than is Snapchat.1
Conversational
Computers
Self-Driving Cars Consumer Apps](https://image.slidesharecdn.com/bigideas2020-final011020-200725115030/85/ARK-Invest-Big-Ideas-2020-7-320.jpg)
![8
BIGIDEAS2020
[1] Moore’s Law: Gordon Moore’s prediction that the number of transistors on a chip would double every two years.
Forecasts are inherently limited and cannot be relied upon. | Source: ARK Investment Management LLC, 2019; “Worldwide Server Market Revenue Declined 6.7% Year Over Year in the Third Quarter of 2019,
According to IDC.” IDC, 5 Dec. 2019, https://arkinv.st/2ZSWcFh. Assumes 15% OEM margin.
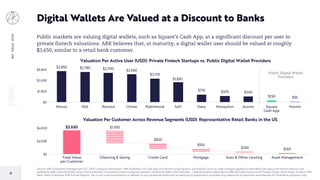
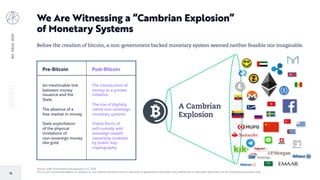
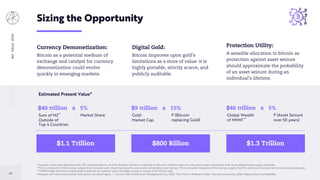
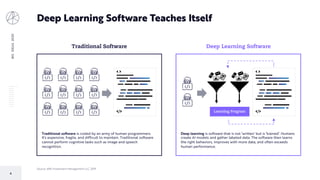
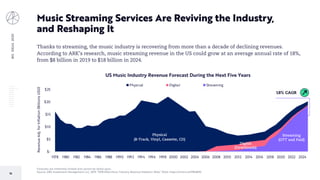
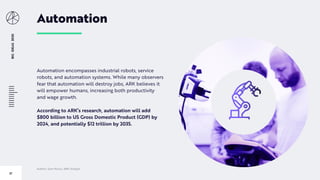
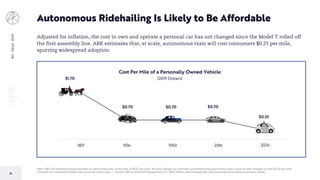
AI Software Should Create an $18 Billion Market
for AI Hardware
The slowdown in Moore’s Law1 means no more ‘free’ performance upgrades every two years. As a result, the server
industry will have to invest in more computing hardware. AI accelerator chips, which optimize deep learning
workloads, generated $4 billion in revenue last year and should grow 36% at a compound annual growth rate (CAGR)
to $18 billion in 2024.
$0
$20
$40
$60
$80
$100
2019 2024
Billions(USD)
Global Server Revenue by Component
CPU Memory Storage Other AI Accelerator
36% CAGR](https://image.slidesharecdn.com/bigideas2020-final011020-200725115030/85/ARK-Invest-Big-Ideas-2020-8-320.jpg)
![BIGIDEAS2020
17
[1] We consider cloud gaming to be subscription-based services that offer instant access to gaming content libraries.
Forecasts are inherently limited and cannot be relied upon.
Source: ARK Investment Management LLC, 2019; “Newzoo's Global Games Market Report.” Newzoo, https://arkinv.st/37su2nc.
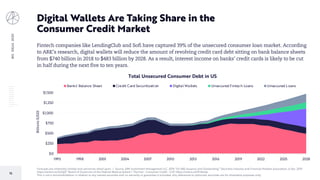
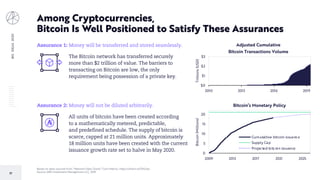
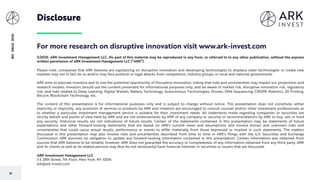
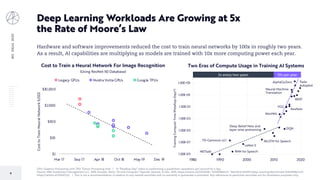
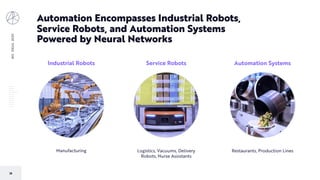
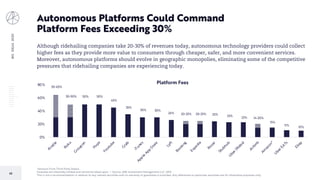
Cloud Gaming Is Poised For Explosive Growth
Cloud gaming1 is likely to take share from console- and PC-gaming, growing from nearly $263 million in 2019 to
$13.5 billion, or from 0.2% to 6.3% share during the next five years. Among the reasons for this share shift are
instant access to games, dynamic back end support, and compatibility with any device.
45.8%
23.7%
30.4%
0.2%
2019 Estimated Global Game Market Share
Mobile PC Console Cloud
2019
Total $149 B 55.0%
15.4%
23.4%
6.3%
2024 Forecast of Global Game Market Share
Mobile PC Console Cloud
2024
Total $216 B
120% CAGR](https://image.slidesharecdn.com/bigideas2020-final011020-200725115030/85/ARK-Invest-Big-Ideas-2020-17-320.jpg)
![BIGIDEAS2020
18
[1] We consider live streaming to be web-based platforms that allow users to stream their game-play to a broader audience.
Source: ARK Investment Management LLC, 2019 based on data sourced from twitchtracker.com ; “Livestreaming - A $5 Billion Global Phenomenon.” Roundhill Investments, https://arkinv.st/2FcVUiX.
This is not a recommendation in relation to any named securities and no warranty or guarantee is provided. Any references to particular securities are for illustrative purposes only.
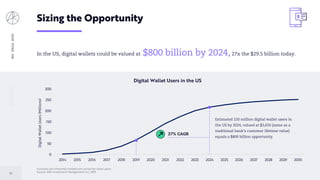
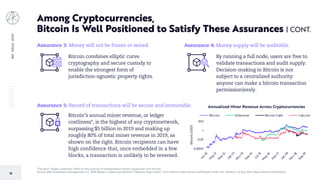
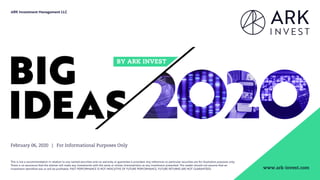
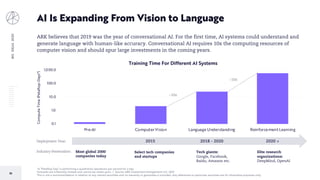
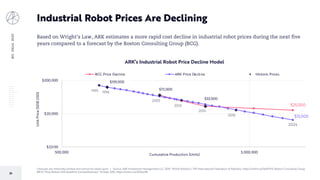
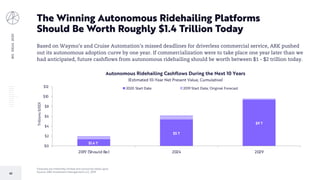
Live Streaming Is Taking Off in New Verticals
Typically in the form of video, live streaming1 is gaining popularity globally, with a particularly strong impact on
Esports. Amazon’s Twitch is the 58th most popular site in the world, streaming more than 11 billion hours in
2019 alone, according to ARK’s estimates.
0
2
4
6
8
10
12
2013 2014 2015 2016 2017 2018 2019
NumberofHoursWatched(Billions)
Twitch Viewership
(Number of Hours Watched)
36.5% CAGR](https://image.slidesharecdn.com/bigideas2020-final011020-200725115030/85/ARK-Invest-Big-Ideas-2020-18-320.jpg)
![BIGIDEAS2020
21
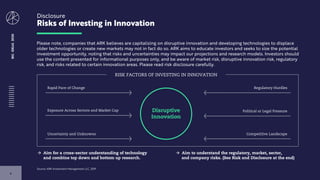
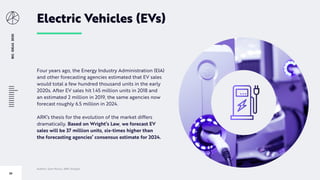
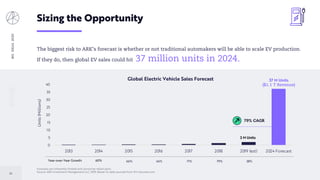
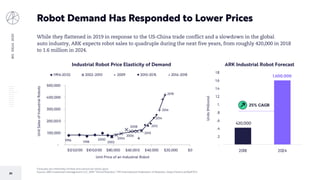
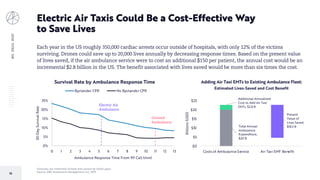
EV Sales Are Increasing As Gas-Powered Auto Sales Shrink
Despite an estimated 3.1 million drop in total auto sales worldwide,1 EV sales are expected to grow significantly
during the next five years. EV sales growth could be lumpy as factories build to scale but should be robust over
time as EV adoption gains traction.
[1] Raimonde, Olivia. “Global Car Sales Expected to Slide by 3.1 Million This Year in Steepest Drop since Great Recession.” CNBC, CNBC, 25 Nov. 2019, https://arkinv.st/35bYEYHl.
Forecasts are inherently limited and cannot be relied upon. | Source: ARK Investment Management LLC, 2019; Based on data sourced from: EV-volumes.com.
.
.5
1.
1.5
2.
2.5
2013 2014 2015 2016 2017 2018 2019 (est)
Units(Millions)
Global Electric Vehicle Sales
Year-over-Year Growth: 60% 66% 46% 71% 79% 38%
2 M Units
~2.5% Penetration
80 M Units
20
40
60
80
100
EV Sales Global Auto Sales
Units(Millions)
Auto Sales in 2019](https://image.slidesharecdn.com/bigideas2020-final011020-200725115030/85/ARK-Invest-Big-Ideas-2020-21-320.jpg)
![BIGIDEAS2020
35
[1] ARK used Google Search Trends to illustrate the decline in investor interest for 3D printing stocks. While this analysis is limited, it mirrors the general investor sentiment for 3D printing stocks and their price decline.
Source: ARK Investment Management LLC, 2019; Data sourced from https://trends.google.com/.
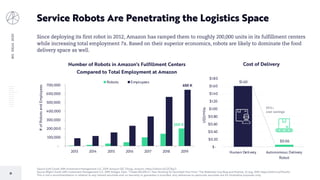
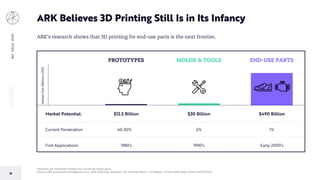
Investors Seem to Be Underestimating 3D Printing
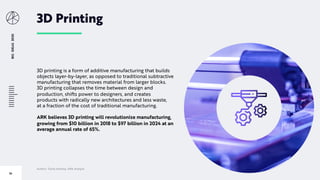
3D printing companies have not recovered from the consumer-3D printing hype of 2013-2014. As they have
entered the so called “valley of despair,” 3D printing stocks have suffered from a lack of interest, creating a
mismatch between the valuation of public and private companies in the space.
0
25
50
75
100
Jun-13
Aug-13
Oct-13
Dec-13
Feb-14
Apr-14
Jun-14
Aug-14
Oct-14
Dec-14
Feb-15
Apr-15
Jun-15
Aug-15
Oct-15
Dec-15
Feb-16
Apr-16
Jun-16
Aug-16
Oct-16
Dec-16
Feb-17
Apr-17
Jun-17
Aug-17
Oct-17
Dec-17
Feb-18
Apr-18
Jun-18
Aug-18
Oct-18
Dec-18
Feb-19
Apr-19
Jun-19
Aug-19
Oct-19
Dec-19
GoogleSearchTrendsInterestOverTime
Google Trends "3D Printing Stocks”1
(Category: Finance, Worldwide)](https://image.slidesharecdn.com/bigideas2020-final011020-200725115030/85/ARK-Invest-Big-Ideas-2020-35-320.jpg)
![BIGIDEAS2020
36
[1] Kellner, Tomas. “How 3D Printing Will Change Manufacturing.” GE Reports, 16 Feb. 2018, https://arkinv.st/2MQQNcJ.
[2] Donaldson, Brent. “Mission Critical: An Additive Manufacturing Breakthrough in Commercial Aviation.” Additive Manufacturing, 20 May 2019, https://arkinv.st/2ZIqYAP.
Forecasts are inherently limited and cannot be relied upon. | Source: ARK Investment Management LLC, 2019. Data sourced from Bloomberg.
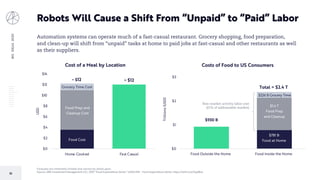
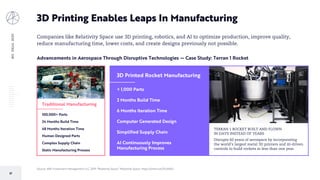
The Adoption of 3D Printing Is at a Tipping Point
In 2015, General Electric (GE) produced the first 3D printed fuel nozzle, combining 20 parts into one.1 In 2019,
the GE9X engine contained 304 3D printed parts.2 At that rate of adoption, and adjusting for the reduction in
complexity, a large percentage of the GE9X engine could be 3D printed by the late 2020s.
19
304
4,000
2015 2019 2024
3D Printed Parts in One Aircraft Engine*
-
50,000
100,000
150,000
200,000
250,000
2014
2016
2018
2020
2022
2024
2026
2028
2030
2032
2034
3D Printing Reduces The Number of Parts
Required For An Aircraft Engine
Total Part Count
*Note: There are 19 fuel nozzles per engine](https://image.slidesharecdn.com/bigideas2020-final011020-200725115030/85/ARK-Invest-Big-Ideas-2020-36-320.jpg)
![BIGIDEAS2020
56
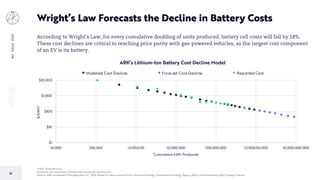
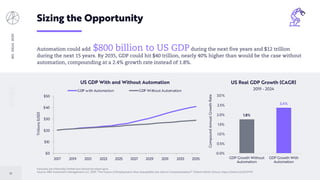
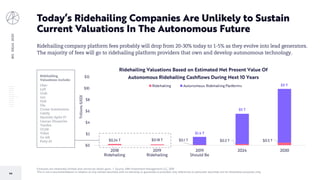
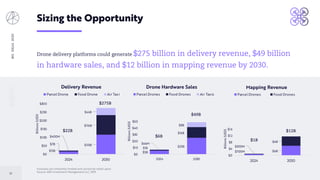
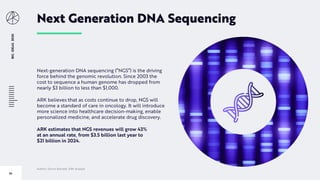
As Costs Decline, Demand for Sequencing Is Surging
ARK believes that the number of whole human genomes sequenced per year should scale 110% at an annual
rate, from roughly 2.6 million in 2019 to 105 million in 2024, thanks to the clinical adoption of molecular
diagnostics. Among these sequencing-intensive tests are: liquid biopsies, solid tumor profiling, germline testing,
immune-oncology, and non-invasive prenatal screening.
[1] Illumina combined its technology with Solexa's to commercialize the first wave of NGS instruments.
Forecasts are inherently limited and cannot be relied upon. | Source: ARK Investment Management LLC, 2019; “The Cost of Sequencing a Human Genome.” Genome.gov, https://arkinv.st/2SImMzm.
This is not a recommendation in relation to any named securities and no warranty or guarantee is provided. Any references to particular securities are for illustrative purposes only.
1
10
100
1,000
10,000
100,000
1,000,000
10,000,000
100,000,000
1,000,000,000
Apr-01 Jan-04 Oct-06 Jul-09 Apr-12 Dec-14 Sep-17 Jun-20 Mar-23 Dec-25
GenomesSequencedPerYear
Annual Sequencing Volume Is Accelerating as NGS Enters Clinical Practice
Annual Sequencing Volume ARK Estimate (2024)
Illumina (ILMN)
Acquires Solexa (Jan. 07)1
2.6 Million
Genomes in 2019
105 Million
Genomes in 2024](https://image.slidesharecdn.com/bigideas2020-final011020-200725115030/85/ARK-Invest-Big-Ideas-2020-56-320.jpg)
![BIGIDEAS2020
59
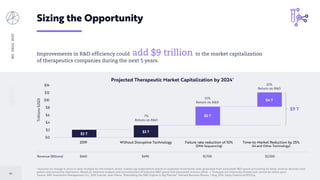
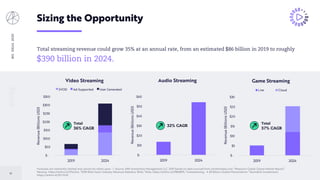
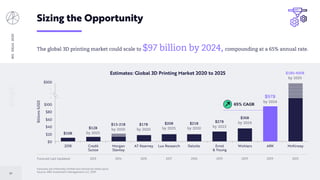
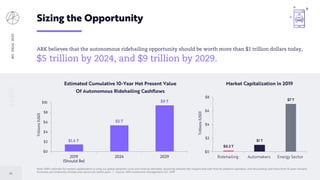
Sizing the Opportunity
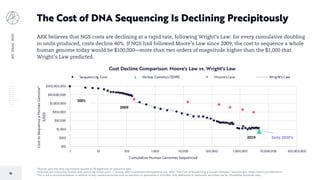
ARK believes that the average price to sequence a
whole human genome will fall to roughly $200 by 2024.1
Based on Wright’s Law, ARK estimates that NGS
revenues could grow at an annual rate of 43%, reaching
$21 billion in 2024.
$3.5 B
$21 B
$0
$5
$10
$15
$20
$25
TotalAddressableMarket(USD)
DNA Sequencing Market
2019 2024
43% CAGR
[1] ARK adjusted its previous cost of $100 by 2023. We believe market leaders in this space are not lowering
costs as quickly as they could. In addition, the average selling price is inclusive of labor, hardware amortization,
consumables and other associated costs, as the National Institutes of Healthcare (NIH) recently delineated.
Forecasts are inherently limited and cannot be relied upon. | Source: ARK Investment Management LLC, 2019](https://image.slidesharecdn.com/bigideas2020-final011020-200725115030/85/ARK-Invest-Big-Ideas-2020-59-320.jpg)
![BIGIDEAS2020
62
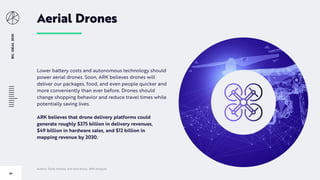
Next Generation DNA Sequencing (NGS) Is Critical
to Clinical Trial Success Rates
[1] Assumes 10% cost of capital.
*A lower failure rate constitutes an improvement in clinical trial success. Targeted drugs have a mechanism of action that usually is genetic in nature and tailored to a patient.
Source: ARK Investment Management LLC, 2019; Falconi, Adam, et al. “Biomarkers and Receptor Targeted Therapies Reduce Clinical Trial Risk in Non–Small-Cell Lung Cancer.” Journal of Thoracic Oncology,
Elsevier, 20 Nov. 2015, https://arkinv.st/35AnSA2.
Drug development companies are making clinical trials more efficient by using NGS to find and enroll patients
likely to respond. Half of clinical trials and 80% of oncology trials now collect genetic information. ARK believes
clinical trials using genetic diagnostics will result in fewer failed drugs and will increase capital efficiency.
Failure Rate
Reduction
(%)
Failed Drugs
(#)
Total Cost of R&D1
(Million USD)
0 28 $720
10 18 $520
25 9 $350
45 3 $220
Next generation sequencing diagnostic tests, in combination
with artificial intelligence, should reduce clinical trial failure rates
materially at every stage of the drug development process
72%
69%
38%
0%
15%
30%
45%
60%
75%
Overall Targeted Drugs* Genetic Diagnostic
Drugs*
FailureRate
Genetic Diagnostics Can Lower Failure Rates
by 45% in Phase III Lung Cancer Trials
The Cost to Produce One FDA-Approved Drug
Given Reduced Failure Rates](https://image.slidesharecdn.com/bigideas2020-final011020-200725115030/85/ARK-Invest-Big-Ideas-2020-62-320.jpg)
![BIGIDEAS2020
63
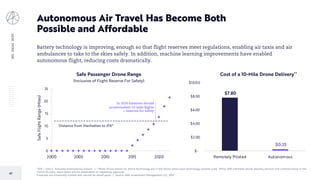
Artificial Intelligence (AI) Should Reduce
the Time-to-Market for New Therapies
[1] Academic papers mentioning “machine learning” or “deep learning” and one of the top 5 mortal diseases in the US in the title or abstract
[2] Assumes 10% cost of capital.
Source: ARK Investment Management LLC, 2019; “Home - PubMed - NCBI.” National Center for Biotechnology Information, U.S. National Library of Medicine, https://arkinv.st/2ZZk9L4.
AI is being deployed increasingly to address major diseases and to boost efficiency throughout the healthcare
ecosystem. AI should increase clinical trial throughput by improving patient recruitment and retention,
potentially cutting trial times by more than half.
0
500
1,000
1,500
2,000
2,500
3,000
3,500
2019
2017
2015
2013
2011
2009
2007
2005
2003
2001
1999
1997
1995
Publication Volume of Machine Learning and Deep
Learning Papers Focused on Major Diseases1
The combination of AI, DNA sequencing, and gene editing should improve
clinical trial speed and lower cost-of-capital adjusted R&D costs.
Cost To Develop A Single Successful Drug
Time-to-Market Reduction
(%)
Total Cost of R&D2
(Million USD)
0 $720
10 $675
25 $610
45 $535](https://image.slidesharecdn.com/bigideas2020-final011020-200725115030/85/ARK-Invest-Big-Ideas-2020-63-320.jpg)
![BIGIDEAS2020
64
Curing Disease Comes at a Higher Sticker Price But a
Much Better Bang For the Buck
[1] Life-year: Year of survival while on therapy. | [2] Chronic cancer treatments include treatments approved 2014 to 2019.
Source: ARK Investment Management LLC, 2019; Biologics Evaluation and Research. “Approved Cellular and Gene Therapy Products.” U.S. Food and Drug Administration, FDA, https://arkinv.st/37LrKQh; Shahryari,
Alireza, et al. “Development and Clinical Translation of Approved Gene Therapy Products for Genetic Disorders.” Frontiers, Frontiers, 20 Aug. 2019, https://arkinv.st/39MZOxg.
Gene editing promises to transform our ability to create and deliver gene and cell therapies. To date, only 10
therapies have been FDA approved—three of them targeting cancer—but more than 2,000 trials have been
registered. Approved by the FDA in the last two years, the first three gene therapies demonstrated high rates of
complete remission in liquid tumors at a low cost per "life-year”.1
$158
$424
$-
$150
$300
$450
Average Cost of
Cancer Treatment
2014-2019
Average Cost of
ACT Therapies
CostperTreatment
(ThousandsUSD)
Average Cost of Chronic Cancer
Treatment2 vs. Gene Therapies
Chronic Cancer
Treatments
Cancer Gene
Therapies
$134
$100
$-
$150
$300
$450
Average Cost Per
Life Year Gained
2014-2019
Average Cost of ACT
per Life Year Gained
CostperTreatment
(ThousandsUSD)
Average Cost of Cancer Care
Per Life-Year Gained
Chronic Cancer
Treatment
Gene
Therapies
1.6
4.9
0.0
1.0
2.0
3.0
4.0
5.0
Chronic Tr eatment s Immunotherapies/ Gene Therapies
IncrementalLife-YearsGained
Average Life-Years Gained by
Treatment Paradigm
Chronic Cancer
Treatments
Cancer Gene
Therapies
+3x
While the list price is 2-3x
higher, Gene Therapies can
be more cost effective
per-life-year gained.
Gene Therapies
likely will be a one-time
administered cure.](https://image.slidesharecdn.com/bigideas2020-final011020-200725115030/85/ARK-Invest-Big-Ideas-2020-64-320.jpg)
![BIGIDEAS2020
65
The Combination of Sequencing, Editing and AI Could
Reverse Decaying Returns on Therapeutic R&D
[1] Returns on Drug R&D = The rate of return, less the risk-free rate, on the R&D dollars spent (inclusive of drug failures) in the years leading up to drug releases and associated present value of earnings in any given year.
[2] Garnier, J-P. 2008. Rebuilding the R&D Engine in Big Pharma. Harvard Business Review May 2008.
Forecasts are inherently limited and cannot be relied upon.
Source: ARK Investment Management LLC, 2019; Garnier, Jean-Pierre. “Rebuilding the R&D Engine in Big Pharma.” Harvard Business Review, 1 Aug. 2014, https://arkinv.st/37JClLp.
A marginal increase in clinical trial success rates coupled with an increase in trial throughput and the premium
pricing afforded to curative therapies could catalyze returns to R&D not seen since the biotech revolution.
0%
5%
10%
15%
20%
25%
30%
35%
40%
20242021201620122008200420001996199219881984
Pharma and Biotech: Returns on Drug R&D1 and Potential Trajectories
(5 Year Moving Average)
10% trial phase
failure reduction
25% time to market
reduction
+
2x pricing for curing
chronic conditions
+
The biotech revolution, triggered by the discovery of
recombinant DNA technology and signaled by Genentech’s
1980 IPO, spurred 2 decades of productive R&D spend
Generics, consolidation, and a lack of disruptive
innovation lead to “risk aversion, promises with no
obligation to deliver, and bureaucratic inertia.”2
Potential continued R&D return
decay without disruptive technology](https://image.slidesharecdn.com/bigideas2020-final011020-200725115030/85/ARK-Invest-Big-Ideas-2020-65-320.jpg)