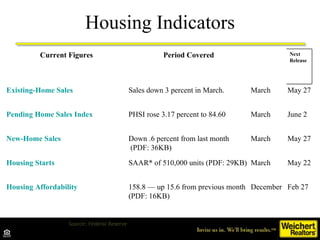
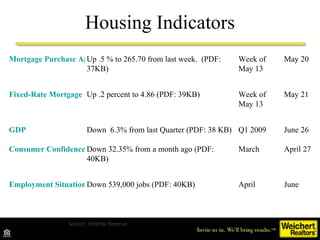
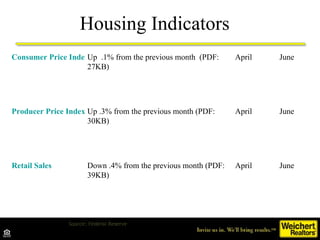
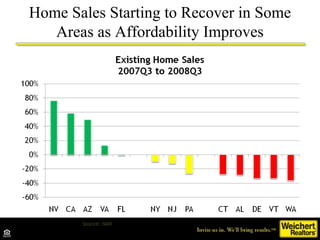
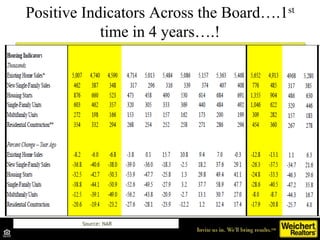
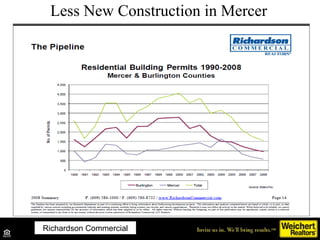
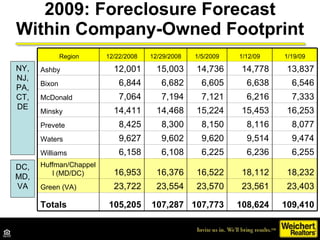
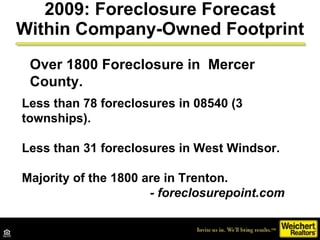
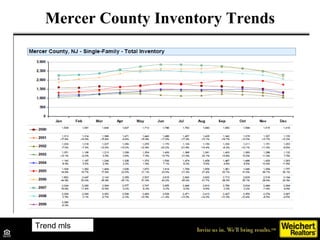
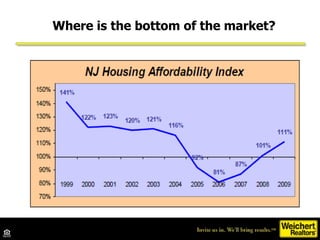
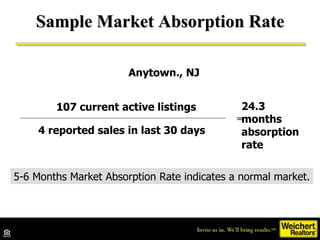
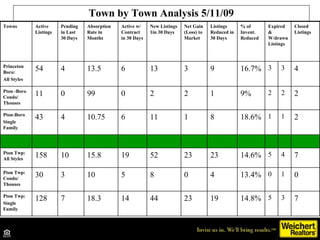
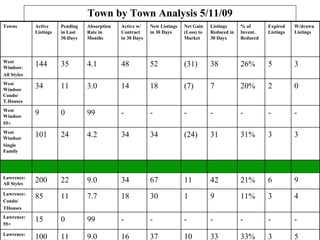
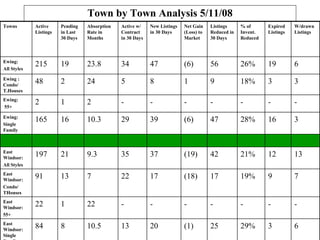
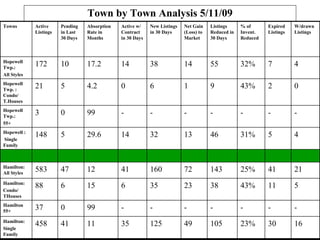
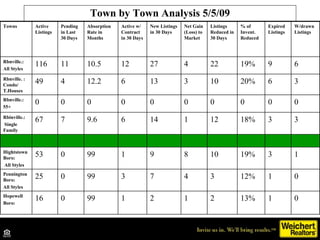
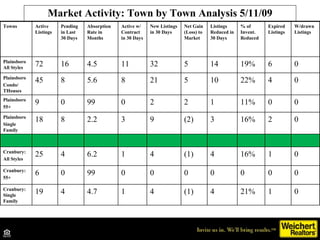
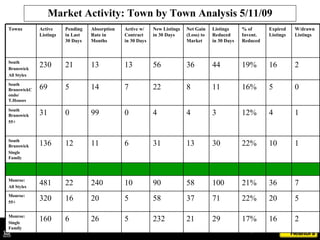
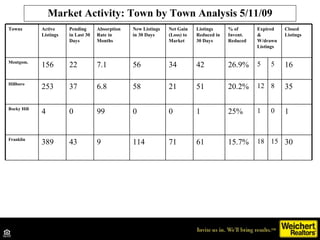
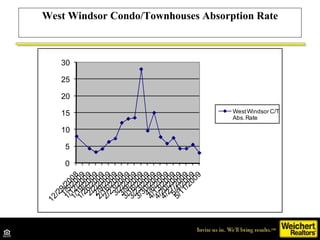
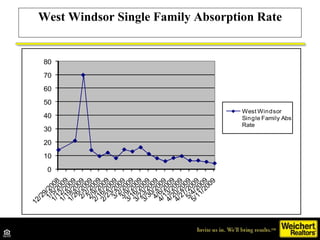
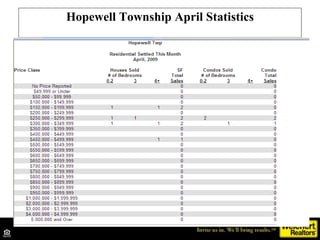
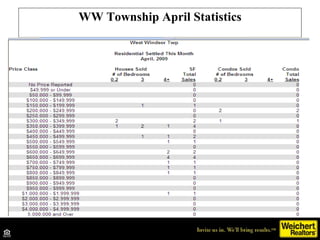
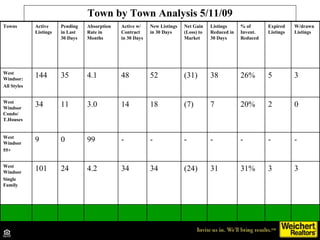
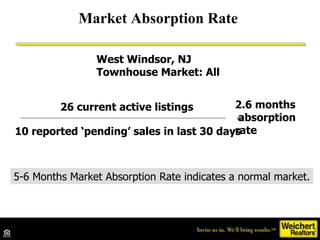
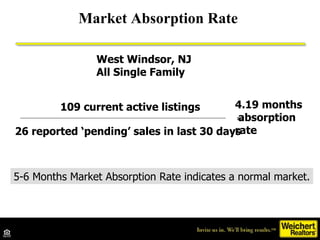
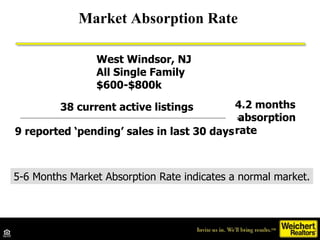
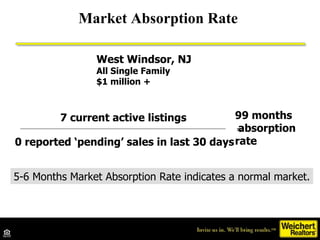
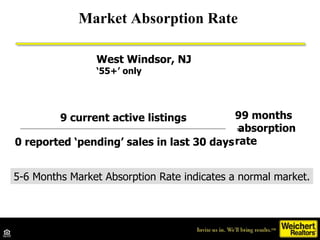
Making Sense of the Real Estate Market of 2009 Weichert, Princeton’s Market Seminar  A complimentary service of Weichert, Realtors Each WEICHERT® franchised office is independently owned and operated. ®
Agenda The Market Strategies for Buying Strategies for Selling
What are you hearing about the economy?
Job Market Retrenches in 2008 thousands Source: Bureau of Labor Statistics
Auto Sales at Lowest Level Since 1992 Source: Autodata
Chrysler in Bankruptcy…GM Next…Over 1000 Chrysler Dealers to be shuttered… Source: Autodata
Financial Turmoil Not Just a U.S. Problem Source: Haver Analytics
Consumer Sentiment Not This Low Since Early 1980s Source: University of Michigan 1966Q1 = 100
Employment Year over Year Percent Change
Good news, we only lost 549,000 jobs in April, 2009…
                                               January 1, 2009                                                Thursday, January 1,   2009  
The ‘recession’ officially started in December 2007 Source: Federal Reserve
What about the Housing Market…?
% Appreciation in 5 Year Increments Source: Brookings Papers 9/08
Housing Indicators Source: Federal Reserve Current Figures Period Covered Next Release Existing-Home Sales Sales down 3 percent in March. March May 27 Pending Home Sales Index PHSI rose 3.17 percent to 84.60 March June 2 New-Home Sales Down .6 percent from last month  (PDF: 36KB) March May 27 Housing Starts SAAR* of 510,000 units (PDF: 29KB) March May 22 Housing Affordability 158.8 — up 15.6 from previous month (PDF: 16KB) December Feb 27
Housing Indicators Source: Federal Reserve Mortgage Purchase Application Index Up .5 % to 265.70 from last week.  (PDF: 37KB) Week of May 13 May 20 Fixed-Rate Mortgage Rate Up .2 percent to 4.86 (PDF: 39KB) Week of May 13 May 21 GDP Down  6.3% from last Quarter (PDF: 38 KB) Q1 2009 June 26 Consumer Confidence Down 32.35% from a month ago (PDF: 40KB) March April 27 Employment Situation Down 539,000 jobs (PDF: 40KB) April June
Housing Indicators Source: Federal Reserve Consumer Price Index Up  .1% from the previous month  (PDF: 27KB) April June Producer Price Index Up .3% from the previous month (PDF: 30KB) April June Retail Sales Down .4% from the previous month (PDF: 39KB) April June
Source: NAR Home Sales Starting to Recover in Some Areas as Affordability Improves
Source: NAR Positive Indicators Across the Board….1 st  time in 4 years….!
Less New Construction in Mercer Source: NAR, November 2008 Forecast Richardson Commercial
Mercer Population Growth will Outpace NJ Source: NAR, November 2008 Forecast http://lwd.dol.state.nj.us/labor/lpa/pub/jobdmnd/mercer.pdf         The region’s overall population will increase by 11.9 percent, faster than the state’s 8.1 percent growth rate, from 3,167,200 in 2002 to 3,542,900 in 2012. The number of persons 45-64 years old will grow substantially while the 25-44 age group will decline due to the baby boom-to-baby bust effect. Senior citizens will account for 14.7 percent of the region’s total residents, higher than the statewide proportion of 13.8 percent.
2009: Foreclosure Forecast Within Company-Owned Footprint NY, NJ, PA, CT, DE DC, MD, VA   Region 12/22/2008 12/29/2008 1/5/2009 1/12/09 1/19/09 Ashby 12,001 15,003 14,736 14,778 13,837 Bixon 6,844 6,682 6,605 6,638 6,546 McDonald 7,064 7,194 7,121 6,216 7,333 Minsky 14,411 14,468 15,224 15,453 16,253 Prevete 8,425 8,300 8,150 8,116 8,077 Waters 9,627 9,602 9,620 9,514 9,474 Williams 6,158 6,108 6,225 6,236 6,255 Huffman/Chappell (MD/DC) 16,953 16,376 16,522 18,112 18,232 Green (VA) 23,722 23,554 23,570 23,561 23,403 Totals 105,205 107,287 107,773 108,624 109,410
2009: Foreclosure Forecast Within Company-Owned Footprint Over 1800 Foreclosure in  Mercer County. Less than 78 foreclosures in 08540 (3 townships). Less than 31 foreclosures in West Windsor. Majority of the 1800 are in Trenton. - foreclosurepoint.com
Home Price Trends in Down Markets:  Big Declines in Subprime Neighborhoods Yellow – Conforming Loans Only (OFHEO) Orange – All Loans including subprime and jumbo loans (Case-Shiller) Red – Subprime Loans (NAR estimate based on subprime weight)
Mercer County Inventory Trends Trend mls
Where is the bottom of the market? “ The effects (of foreclosures) are continued declining prices….probably another 5-8%* to the bottom.  As for the effect of foreclosure pricing, all of these problems are  causing home prices to go lower than is necessary from an affordability perspective .    That’s because everyone is now worrying about job security.  As a result, the recovery will take place at a faster pace once it gets started.” –  Jeff Otteau (otteau.com- January 2009)
Where is the bottom of the market?
1.  Real Estate is Local Top Five Rules for Understanding the Real Estate Market: 2.  Real Estate is Local 3.  Real Estate is Local 4.  Real Estate is Local 5.  Real Estate is Local
Joshua D. Wilton, Manager Strategies for Buying
1. Understand the Local Market That You are Buying into…
Sample Market Absorption Rate 107 current active listings  4 reported sales in last 30 days = 24.3 months  absorption rate Anytown., NJ 5-6 Months Market Absorption Rate indicates a normal market.
Market Absorption Scale (Absorption Rate in Months) 5-6 months absorption rate indicates a normal market.
Town by Town Analysis 5/11/09 Towns Active Listings Pending in Last 30 Days Absorption Rate in Months Active w/ Contract in 30 Days New Listings 1in 30 Days Net Gain (Loss) to Market Listings Reduced in 30 Days % of Invent. Reduced Expired  & W/drawnListings Closed Listings Princeton Boro:  All Styles 54 4 13.5 6 13 3 9 16.7% 3 3 4 Pton -Boro Condo/ Thouses 11 0 99 0 2 2 1 9% 2 2 2 Pton-Boro Single Family 43 4 10.75 6 11 1 8 18.6% 1 1 2 Pton Twp: All Styles 158 10 15.8 19 52 23 23 14.6% 5 4 7 Pton Twp: Condo/ Thouses 30 3 10 5 8 0 4 13.4% 0 1 0 Pton Twp: Single Family 128 7 18.3 14 44 23 19 14.8% 5 3 7
Town by Town Analysis 5/11/09 Towns Active Listings Pending in Last 30 Days Absorption Rate in Months Active w/ Contract in 30 Days New Listings in 30 Days Net Gain (Loss) to Market Listings Reduced in 30 Days % of Invent. Reduced Expired Listings W/drawn Listings West Windsor:  All Styles 144 35 4.1 48 52 (31) 38 26% 5 3 West Windsor Condo/ T.Houses 34 11 3.0 14 18 (7) 7 20% 2 0 West Windsor 55+ 9 0 99 - - - - - - - West Windsor  Single Family 101 24 4.2 34 34 (24) 31 31% 3 3 Lawrence: All Styles 200 22 9.0 34 67 11 42 21% 6 9 Lawrence: Condo/ THouses 85 11 7.7 18 30 1 9 11% 3 4 Lawrence:  55+ 15 0 99 - - - - - - - Lawrence:  Single Family 100 11 9.0 16 37 10 33 33% 3 5
Town by Town Analysis 5/11/08 Towns Active Listings Pending in Last 30 Days Absorption Rate in Months Active w/ Contract in 30 Days New Listings in 30 Days Net Gain (Loss) to Market Listings Reduced in 30 Days % of Invent. Reduced Expired Listings W/drawn Listings Ewing:  All Styles 215 19 23.8 34 47 (6) 56 26% 19 6 Ewing : Condo/ T.Houses 48 2 24 5 8 1 9 18% 3 3 Ewing: 55+ 2 1 2 - - - - - - - Ewing: Single Family 165 16 10.3 29 39 (6) 47 28% 16 3 East Windsor: All Styles 197 21 9.3 35 37 (19) 42 21% 12 13 East Windsor: Condo/ THouses 91 13 7 22 17 (18) 17 19% 9 7 East Windsor: 55+ 22 1 22 - - - - - - - East Windsor: Single Family 84 8 10.5 13 20 (1) 25 29% 3 6
Town by Town Analysis 5/11/09 Towns Active Listings Pending in Last 30 Days Absorption Rate in Months Active w/ Contract in 30 Days New Listings in 30 Days Net Gain (Loss) to Market Listings Reduced in 30 Days % of Invent. Reduced Expired Listings W/drawn Listings Hopewell Twp.:  All Styles 172 10 17.2 14 38 14 55 32% 7 4 Hopewell Twp. : Condo/ T.Houses 21 5 4.2 0 6 1 9 43% 2 0 Hopewell Twp.: 55+ 3 0 99 - - - - - - - Hopewell : Single Family 148 5 29.6 14 32 13 46 31% 5 4 Hamilton: All Styles 583 47 12 41 160 72 143 25% 41 21 Hamilton: Condo/ THouses 88 6 15 6 35 23 38 43% 11 5 Hamilton 55+ 37 0 99 - - - - - - - Hamilton: Single Family 458 41 11 35 125 49 105 23% 30 16
Town by Town Analysis 5/5/09 Towns Active Listings Pending in Last 30 Days Absorption Rate in Months Active w/ Contract in 30 Days New Listings in 30 Days Net Gain (Loss) to Market Listings Reduced in 30 Days % of Invent. Reduced Expired Listings W/drawn Listings Rbnville.:  All Styles 116 11 10.5 12 27 4 22 19% 9 6 Rbnville. : Condo/ T.Houses 49 4 12.2 6 13 3 10 20% 6 3 Rbnville.: 55+ 0 0 0 0 0 0 0 0 0 0 Rbinville.: Single Family 67 7 9.6 6 14 1 12 18% 3 3 HightstownBoro: All Styles 53 0 99 1 9 8 10 19% 3 1 Pennington Boro: All Styles 25 0 99 3 7 4 3 12% 1 0 Hopewell Boro: 16 0 99 1 2 1 2 13% 1 0
Market Activity: Town by Town Analysis 5/11/09 Towns Active Listings Pending in Last 30 Days Absorption Rate in Months Active w/ Contract in 30 Days New Listings in 30 Days Net Gain (Loss) to Market Listings Reduced in 30 Days % of Invent. Reduced Expired Listings W/drawn Listings PlainsboroAll Styles 72 16 4.5 11 32 5 14 19% 6 0 Plainsboro Condo/ THouses 45 8 5.6 8 21 5 10 22% 4 0 Plainsboro 55+ 9 0 99 0 2 2 1 11% 0 0 Plainsboro Single Family 18 8 2.2 3 9 (2) 3 16% 2 0 Cranbury: All Styles 25 4 6.2 1 4 (1) 4 16% 1 0 Cranbury: 55+ 6 0 99 0 0 0 0 0 0 0 Cranbury: Single Family 19 4 4.7 1 4 (1) 4 21% 1 0
Market Activity: Town by Town Analysis 5/11/09 Towns Active Listings Pending in Last 30 Days Absorption Rate in Months Active w/ Contract in 30 Days New Listings in 30 Days Net Gain (Loss) to Market Listings Reduced in 30 Days % of Invent. Reduced Expired Listings W/drawn Listings South Brunswick All Styles 230 21 13 13 56 36 44 19% 16 2 South BrunswickCondo/ T.Houses 69 5 14 7 22 8 11 16% 5 0 South Brunswick 55+ 31 0 99 0 4 4 3 12% 4 1 South Brunswick Single Family 136 12 11 6 31 13 30 22% 10 1 Monroe: All Styles 481 22 240 10 90 58 100 21% 36 7 Monroe: 55+ 320 16 20 5 58 37 71 22% 20 5 Monroe: Single Family 160 6 26 5 232 21 29 17% 16 2
Market Activity: Town by Town Analysis 5/11/09 Towns Active Listings Pending in Last 30 Days Absorption Rate in Months New Listings in 30 Days Net Gain (Loss) to Market Listings Reduced in 30 Days % of Invent. Reduced Expired & W/drawn Listings Closed Listings Montgom. 156 22 7.1 56 34 42 26.9% 5 5 16 Hillboro 253 37 6.8 58 21 51 20.2% 12 8 35 Rocky Hill 4 0 99 0 0 1 25% 1 0 1 Franklin 389 43 9 114 71 61 15.7% 18 15 30
West Windsor Condo/Townhouses Absorption Rate
West Windsor Single Family Absorption Rate
South Brunswick Condo/Townhouse Absorption Rate
South Brunswick Single Family Absorption Rate
Lawrence April Statistics
Princeton Township April Statistics
Hopewell Township April Statistics
WW Township April Statistics
Understand the Market That You are Buying into… I want to live in West Windsor because of the schools and the trains
Town by Town Analysis 5/11/09 Towns Active Listings Pending in Last 30 Days Absorption Rate in Months Active w/ Contract in 30 Days New Listings in 30 Days Net Gain (Loss) to Market Listings Reduced in 30 Days % of Invent. Reduced Expired Listings W/drawn Listings West Windsor:  All Styles 144 35 4.1 48 52 (31) 38 26% 5 3 West Windsor Condo/ T.Houses 34 11 3.0 14 18 (7) 7 20% 2 0 West Windsor 55+ 9 0 99 - - - - - - - West Windsor  Single Family 101 24 4.2 34 34 (24) 31 31% 3 3
Market Absorption Rate  26 current active listings  10 reported ‘pending’ sales in last 30 days = 2.6 months  absorption rate West Windsor, NJ Townhouse Market: All 5-6 Months Market Absorption Rate indicates a normal market.
Market Absorption Rate  109 current active listings  26 reported ‘pending’ sales in last 30 days = 4.19 months  absorption rate West Windsor, NJ All Single Family 5-6 Months Market Absorption Rate indicates a normal market.
Market Absorption Rate  38 current active listings  9 reported ‘pending’ sales in last 30 days = 4.2 months  absorption rate West Windsor, NJ All Single Family $600-$800k 5-6 Months Market Absorption Rate indicates a normal market.
Market Absorption Rate  7 current active listings  0 reported ‘pending’ sales in last 30 days = 99 months  absorption rate West Windsor, NJ All Single Family $1 million + 5-6 Months Market Absorption Rate indicates a normal market.
Market Absorption Rate  9 current active listings  0 reported ‘pending’ sales in last 30 days = 99 months  absorption rate West Windsor, NJ ‘ 55+’ only 5-6 Months Market Absorption Rate indicates a normal market.
2. ‘I am going to time the Market and buy at the peak inventory level  and  when no one else buys…’ Source: MLS
Source: MLS Weekly Guests Thru the Weichert Princeton Open Houses, 2007
Source: MLS Inventory Levels, Princeton, New Jersey, 2007
3. ‘I am going to wait until the price comes down further  and then  make an offer…’ Source: MLS
Town by Town Analysis 5/11/09 Towns Active Listings Pending in Last 30 Days Absorption Rate in Months Active w/ Contract in 30 Days New Listings in 30 Days Net Gain (Loss) to Market Listings Reduced in 30 Days % of Invent. Reduced Expired Listings W/drawn Listings Hopewell Twp.:  All Styles 172 10 17.2 14 38 14 55 32% 7 4 Hopewell Twp. : Condo/ T.Houses 21 5 4.2 0 6 1 9 43% 2 0 Hopewell Twp.: 55+ 3 0 99 - - - - - - - Hopewell : Single Family 148 5 29.6 14 32 13 46 31% 5 4 Hamilton: All Styles 583 47 12 41 160 72 143 25% 41 21 Hamilton: Condo/ THouses 88 6 15 6 35 23 38 43% 11 5 Hamilton 55+ 37 0 99 - - - - - - - Hamilton: Single Family 458 41 11 35 125 49 105 23% 30 16
Source: trend mls Relationship of Price Reductions to ‘Pending Sales’
Factors to consider when buying and selling… Source: MLS Inventory(supply and demand) Interest Rates
Interest Rates Remain Low Source: Freddie Mac
Interest Rates Remain Low Source: otteau
Seeing the Opportunity.
Seeing the Opportunity. Q. If this were 2005,  where would you place the Price and Rate dots? Prices Rates High Mid-Range Low A. In 2005, the V would look somewhat like this one, where prices were on the high end of the scale and rates were in the lower range.
Seizing the Opportunity. In recent history, there has never been an opportunity like this, with low prices and low rates. In real estate, this circular area at the bottom of the V is called  the “Buying Zone” – it’s an unbelievable time to buy.  Prices Rates High Mid-Range Low
Jeff Smith,  Gold Services Manager/ Loan Officer Financial Benefits and Process of Home-Ownership.
‘ I don’t want to buy a house and then watch it drop in value!’
The Real Estate Market is not like the Stock Market. If you buy $400,000 in stock you need $400,000 in cash. If you buy a $400,000 home you need only $14,000 down-payment.
  Purchase Price $329,000 Loan Amount $281,000 Down Payment $11,515 Monthly P&I $1,590  Appreciation/Depreciation Home Value 1st Year -3% $305,970 2nd Year 0% $305,970 3rd Year 1% $309,030 4th Year 3% $318,301 5th Year 5% $334,216 5 Year Appreciation/Depreciation $5,216 Tax Benefit   Rent  @ $1600/mo 1st Year $5,000 $19,200 2nd Year $5,000 $19,200 3rd Year $5,000 $19,200 4th Year $5,000 $19,200 5th Year $5,000 $19,200 5 Year Total $25,000 $96,000 Total $30,216 Create Equity v  Pay Rent
Incentive From the Government First-time homebuyers can receive a tax credit up to $8000!
Tax Credit Overview Distribute NAR Tax Credit Overview handout Amount Ten percent of the cost of home, not to exceed $8,000 Property Any single family residence that will be used as a principal residence Refundable Reduces income tax liability for the year of purchase Income Limit Adjusted gross income of $75,000 single or $150,000 joint tax returns First-Time Must not have owned a principal residence in 3 years prior to purchase
Tax Credit FAQs Can individuals with incomes higher than the income limits still benefit from the tax credit? How does a tax credit work? How do I apply for the credit? Is there a way to get the credit before I file my tax return? How does the repayment work?  Distribute NAR Frequently Asked Question handout
How much house can I really afford?
The first step is to meet with me! Establish  Your  Buying Power
Joshua D. Wilton, Manager Strategies for Selling
Understand the Market That You are Selling Out of … I live in Montgomery
Market Absorption Rate  Comparable Properties 7 current active listings  2 reported ‘pending’ sales in last 30 days = 3.5 month  absorption rate 5-6 Months Market Absorption Rate indicates a normal market. Montgomery, NJ Townhouses Only
Market Absorption Rate  Comparable Properties 62 current active listings  6 reported ‘pending’ sales in last 30 days = 10.3 month  absorption rate 5-6 Months Market Absorption Rate indicates a normal market. Montgomery, NJ Single Family $500-799
Market Absorption Rate  Comparable Properties 42 current active listings  3 reported ‘pending’ sales in last 30 days = 14 month  absorption rate 5-6 Months Market Absorption Rate indicates a normal market. Montgomery, NJ Single Family $800+
Market Absorption Rate  Comparable Properties 13 current active listings  0 reported ‘pending’ sales in last 30 days = 99 month  absorption rate 5-6 Months Market Absorption Rate indicates a normal market. Montgomery, NJ 4+ Bed, Single Family $600 - $800k
‘ Great speech but does it really work?
We know the best way to evaluate pricing Does this really work?
2 .  The Effect of  Staging  on the Value of a  Your  Home .
The process of preparing homes for sale regardless of  Price, Location, or Condition To achieve the  maximum  sales price in  the  minimum   marketing time. The  GOAL  is to appeal to the broadest range of  BUYERS .
Non-Staged The Way You Live In Your Home…
…  And The Way We Market And Sell A House Are Two Different Things. Staged
“ The Investment in Home Staging  is  Always Less  than Your  First Price Reduction!”
Non-Staged Buyers Only Know What They See …
…  Not The Way It Is Going To Be. Staged
Based on a StagedHomes.com survey of over 400 homes across Canada & the Continental US prepared for sale by an Accredited Staging Professional (ASP™) from June 2007 through November 2007.
Why  Promote  Home Staging  ? The average  increase in sales   price  of an ASP Staged vs. non-Staged home is  6.9% . That is an  additional $31,050  on a  $450,000  sale.
The average  marketing time  of an ASP Staged vs. non-Staged home is  80% less . Why  Promote  Home Staging  ?
3. The Effect of ‘ Pre-Inspection’  on the Sale of  Your  Home.
What is  ‘ Pre-Inspection?’
Home Inspection WHAT DOES PRE-INSPECTION INCLUDE?  The standard home inspector's report will review the condition of the home's heating system, central air conditioning system (temperature permitting), interior plumbing and electrical systems; the roof, attic, and visible insulation; walls, ceilings, floors, windows and doors; the foundation, basement, and visible structure.   
PRE-LISTING Home Inspection DOESN’T THE BUYER DO THE HOME INSPECTION?
All Negotiations, including real estate, are all about negotiation and control. Who is in control? Right Price Right Staging All Repairs are done in advance. Offer a Home Warranty to the buyer..
PRE-LISTING Home Inspection Data on where most sales fall apart: attorney review, home inspection. Fall Thru Percentage 2007: 26% Fall Thru Percentage 2008: 10.2% .
Home Improvements I am moving out of the house, I do not want spend too much money to move. Or I just spent $$ on a new kitchen, I want $$$$$$ back on that investment when I move.
 
 
Reality of today’s market is that you will see the return on your investment not in an inflated sales price but in retaining the highest percentage of your list price and staying on the market the fewest # of days. Please consult with your Realtor & staging professional as to which improvements you should finish to make your home the most salable.
Weichert Family of Companies What will a real estate company do for me?
Making Your Purchase as  Smooth as Possible Buying a home involves the careful coordination of many people. Choosing a real estate team  you can count on will make the process smoother and easier.
Time is money. The Weichert Difference Stress kills. Time is life.
Educate You. Negotiate on your behalf. Offer advice on due diligence. Manage all aspects of the transaction process. What Will a Weichert Agent Do for Me?
We’re Here to Help The Entire Process is reviewed by Legal Council.
Resource and website list: Realtor.org Remodeling.com NAR.
Resource and Website List http://www.realtor.org/research/research/housinginx Remodeling.com www.Otteau.com www.Pre-listing-inspection.com
Resource and Website List: www.Housemaster.com www.Stagingshoppingcenter.com
Resource and website list: www.Stagedhomes.com www.realestatestagingassociation.com www.foreclosurepoint.com www.realtytrac.com
Good Luck with your Move!

April Market Seminar

  • 1.
    Making Sense ofthe Real Estate Market of 2009 Weichert, Princeton’s Market Seminar A complimentary service of Weichert, Realtors Each WEICHERT® franchised office is independently owned and operated. ®
  • 2.
    Agenda The MarketStrategies for Buying Strategies for Selling
  • 3.
    What are youhearing about the economy?
  • 4.
    Job Market Retrenchesin 2008 thousands Source: Bureau of Labor Statistics
  • 5.
    Auto Sales atLowest Level Since 1992 Source: Autodata
  • 6.
    Chrysler in Bankruptcy…GMNext…Over 1000 Chrysler Dealers to be shuttered… Source: Autodata
  • 7.
    Financial Turmoil NotJust a U.S. Problem Source: Haver Analytics
  • 8.
    Consumer Sentiment NotThis Low Since Early 1980s Source: University of Michigan 1966Q1 = 100
  • 9.
    Employment Year overYear Percent Change
  • 10.
    Good news, weonly lost 549,000 jobs in April, 2009…
  • 11.
                                                January 1, 2009                                                Thursday, January 1, 2009  
  • 12.
    The ‘recession’ officiallystarted in December 2007 Source: Federal Reserve
  • 13.
    What about theHousing Market…?
  • 14.
    % Appreciation in5 Year Increments Source: Brookings Papers 9/08
  • 15.
    Housing Indicators Source:Federal Reserve Current Figures Period Covered Next Release Existing-Home Sales Sales down 3 percent in March. March May 27 Pending Home Sales Index PHSI rose 3.17 percent to 84.60 March June 2 New-Home Sales Down .6 percent from last month  (PDF: 36KB) March May 27 Housing Starts SAAR* of 510,000 units (PDF: 29KB) March May 22 Housing Affordability 158.8 — up 15.6 from previous month (PDF: 16KB) December Feb 27
  • 16.
    Housing Indicators Source:Federal Reserve Mortgage Purchase Application Index Up .5 % to 265.70 from last week.  (PDF: 37KB) Week of May 13 May 20 Fixed-Rate Mortgage Rate Up .2 percent to 4.86 (PDF: 39KB) Week of May 13 May 21 GDP Down  6.3% from last Quarter (PDF: 38 KB) Q1 2009 June 26 Consumer Confidence Down 32.35% from a month ago (PDF: 40KB) March April 27 Employment Situation Down 539,000 jobs (PDF: 40KB) April June
  • 17.
    Housing Indicators Source:Federal Reserve Consumer Price Index Up  .1% from the previous month  (PDF: 27KB) April June Producer Price Index Up .3% from the previous month (PDF: 30KB) April June Retail Sales Down .4% from the previous month (PDF: 39KB) April June
  • 18.
    Source: NAR HomeSales Starting to Recover in Some Areas as Affordability Improves
  • 19.
    Source: NAR PositiveIndicators Across the Board….1 st time in 4 years….!
  • 20.
    Less New Constructionin Mercer Source: NAR, November 2008 Forecast Richardson Commercial
  • 21.
    Mercer Population Growthwill Outpace NJ Source: NAR, November 2008 Forecast http://lwd.dol.state.nj.us/labor/lpa/pub/jobdmnd/mercer.pdf         The region’s overall population will increase by 11.9 percent, faster than the state’s 8.1 percent growth rate, from 3,167,200 in 2002 to 3,542,900 in 2012. The number of persons 45-64 years old will grow substantially while the 25-44 age group will decline due to the baby boom-to-baby bust effect. Senior citizens will account for 14.7 percent of the region’s total residents, higher than the statewide proportion of 13.8 percent.
  • 22.
    2009: Foreclosure ForecastWithin Company-Owned Footprint NY, NJ, PA, CT, DE DC, MD, VA   Region 12/22/2008 12/29/2008 1/5/2009 1/12/09 1/19/09 Ashby 12,001 15,003 14,736 14,778 13,837 Bixon 6,844 6,682 6,605 6,638 6,546 McDonald 7,064 7,194 7,121 6,216 7,333 Minsky 14,411 14,468 15,224 15,453 16,253 Prevete 8,425 8,300 8,150 8,116 8,077 Waters 9,627 9,602 9,620 9,514 9,474 Williams 6,158 6,108 6,225 6,236 6,255 Huffman/Chappell (MD/DC) 16,953 16,376 16,522 18,112 18,232 Green (VA) 23,722 23,554 23,570 23,561 23,403 Totals 105,205 107,287 107,773 108,624 109,410
  • 23.
    2009: Foreclosure ForecastWithin Company-Owned Footprint Over 1800 Foreclosure in Mercer County. Less than 78 foreclosures in 08540 (3 townships). Less than 31 foreclosures in West Windsor. Majority of the 1800 are in Trenton. - foreclosurepoint.com
  • 24.
    Home Price Trendsin Down Markets: Big Declines in Subprime Neighborhoods Yellow – Conforming Loans Only (OFHEO) Orange – All Loans including subprime and jumbo loans (Case-Shiller) Red – Subprime Loans (NAR estimate based on subprime weight)
  • 25.
    Mercer County InventoryTrends Trend mls
  • 26.
    Where is thebottom of the market? “ The effects (of foreclosures) are continued declining prices….probably another 5-8%* to the bottom.  As for the effect of foreclosure pricing, all of these problems are causing home prices to go lower than is necessary from an affordability perspective .   That’s because everyone is now worrying about job security.  As a result, the recovery will take place at a faster pace once it gets started.” – Jeff Otteau (otteau.com- January 2009)
  • 27.
    Where is thebottom of the market?
  • 28.
    Where is thebottom of the market?
  • 29.
    1. RealEstate is Local Top Five Rules for Understanding the Real Estate Market: 2. Real Estate is Local 3. Real Estate is Local 4. Real Estate is Local 5. Real Estate is Local
  • 30.
    Joshua D. Wilton,Manager Strategies for Buying
  • 31.
    1. Understand theLocal Market That You are Buying into…
  • 32.
    Sample Market AbsorptionRate 107 current active listings 4 reported sales in last 30 days = 24.3 months absorption rate Anytown., NJ 5-6 Months Market Absorption Rate indicates a normal market.
  • 33.
    Market Absorption Scale(Absorption Rate in Months) 5-6 months absorption rate indicates a normal market.
  • 34.
    Town by TownAnalysis 5/11/09 Towns Active Listings Pending in Last 30 Days Absorption Rate in Months Active w/ Contract in 30 Days New Listings 1in 30 Days Net Gain (Loss) to Market Listings Reduced in 30 Days % of Invent. Reduced Expired & W/drawnListings Closed Listings Princeton Boro: All Styles 54 4 13.5 6 13 3 9 16.7% 3 3 4 Pton -Boro Condo/ Thouses 11 0 99 0 2 2 1 9% 2 2 2 Pton-Boro Single Family 43 4 10.75 6 11 1 8 18.6% 1 1 2 Pton Twp: All Styles 158 10 15.8 19 52 23 23 14.6% 5 4 7 Pton Twp: Condo/ Thouses 30 3 10 5 8 0 4 13.4% 0 1 0 Pton Twp: Single Family 128 7 18.3 14 44 23 19 14.8% 5 3 7
  • 35.
    Town by TownAnalysis 5/11/09 Towns Active Listings Pending in Last 30 Days Absorption Rate in Months Active w/ Contract in 30 Days New Listings in 30 Days Net Gain (Loss) to Market Listings Reduced in 30 Days % of Invent. Reduced Expired Listings W/drawn Listings West Windsor: All Styles 144 35 4.1 48 52 (31) 38 26% 5 3 West Windsor Condo/ T.Houses 34 11 3.0 14 18 (7) 7 20% 2 0 West Windsor 55+ 9 0 99 - - - - - - - West Windsor Single Family 101 24 4.2 34 34 (24) 31 31% 3 3 Lawrence: All Styles 200 22 9.0 34 67 11 42 21% 6 9 Lawrence: Condo/ THouses 85 11 7.7 18 30 1 9 11% 3 4 Lawrence: 55+ 15 0 99 - - - - - - - Lawrence: Single Family 100 11 9.0 16 37 10 33 33% 3 5
  • 36.
    Town by TownAnalysis 5/11/08 Towns Active Listings Pending in Last 30 Days Absorption Rate in Months Active w/ Contract in 30 Days New Listings in 30 Days Net Gain (Loss) to Market Listings Reduced in 30 Days % of Invent. Reduced Expired Listings W/drawn Listings Ewing: All Styles 215 19 23.8 34 47 (6) 56 26% 19 6 Ewing : Condo/ T.Houses 48 2 24 5 8 1 9 18% 3 3 Ewing: 55+ 2 1 2 - - - - - - - Ewing: Single Family 165 16 10.3 29 39 (6) 47 28% 16 3 East Windsor: All Styles 197 21 9.3 35 37 (19) 42 21% 12 13 East Windsor: Condo/ THouses 91 13 7 22 17 (18) 17 19% 9 7 East Windsor: 55+ 22 1 22 - - - - - - - East Windsor: Single Family 84 8 10.5 13 20 (1) 25 29% 3 6
  • 37.
    Town by TownAnalysis 5/11/09 Towns Active Listings Pending in Last 30 Days Absorption Rate in Months Active w/ Contract in 30 Days New Listings in 30 Days Net Gain (Loss) to Market Listings Reduced in 30 Days % of Invent. Reduced Expired Listings W/drawn Listings Hopewell Twp.: All Styles 172 10 17.2 14 38 14 55 32% 7 4 Hopewell Twp. : Condo/ T.Houses 21 5 4.2 0 6 1 9 43% 2 0 Hopewell Twp.: 55+ 3 0 99 - - - - - - - Hopewell : Single Family 148 5 29.6 14 32 13 46 31% 5 4 Hamilton: All Styles 583 47 12 41 160 72 143 25% 41 21 Hamilton: Condo/ THouses 88 6 15 6 35 23 38 43% 11 5 Hamilton 55+ 37 0 99 - - - - - - - Hamilton: Single Family 458 41 11 35 125 49 105 23% 30 16
  • 38.
    Town by TownAnalysis 5/5/09 Towns Active Listings Pending in Last 30 Days Absorption Rate in Months Active w/ Contract in 30 Days New Listings in 30 Days Net Gain (Loss) to Market Listings Reduced in 30 Days % of Invent. Reduced Expired Listings W/drawn Listings Rbnville.: All Styles 116 11 10.5 12 27 4 22 19% 9 6 Rbnville. : Condo/ T.Houses 49 4 12.2 6 13 3 10 20% 6 3 Rbnville.: 55+ 0 0 0 0 0 0 0 0 0 0 Rbinville.: Single Family 67 7 9.6 6 14 1 12 18% 3 3 HightstownBoro: All Styles 53 0 99 1 9 8 10 19% 3 1 Pennington Boro: All Styles 25 0 99 3 7 4 3 12% 1 0 Hopewell Boro: 16 0 99 1 2 1 2 13% 1 0
  • 39.
    Market Activity: Townby Town Analysis 5/11/09 Towns Active Listings Pending in Last 30 Days Absorption Rate in Months Active w/ Contract in 30 Days New Listings in 30 Days Net Gain (Loss) to Market Listings Reduced in 30 Days % of Invent. Reduced Expired Listings W/drawn Listings PlainsboroAll Styles 72 16 4.5 11 32 5 14 19% 6 0 Plainsboro Condo/ THouses 45 8 5.6 8 21 5 10 22% 4 0 Plainsboro 55+ 9 0 99 0 2 2 1 11% 0 0 Plainsboro Single Family 18 8 2.2 3 9 (2) 3 16% 2 0 Cranbury: All Styles 25 4 6.2 1 4 (1) 4 16% 1 0 Cranbury: 55+ 6 0 99 0 0 0 0 0 0 0 Cranbury: Single Family 19 4 4.7 1 4 (1) 4 21% 1 0
  • 40.
    Market Activity: Townby Town Analysis 5/11/09 Towns Active Listings Pending in Last 30 Days Absorption Rate in Months Active w/ Contract in 30 Days New Listings in 30 Days Net Gain (Loss) to Market Listings Reduced in 30 Days % of Invent. Reduced Expired Listings W/drawn Listings South Brunswick All Styles 230 21 13 13 56 36 44 19% 16 2 South BrunswickCondo/ T.Houses 69 5 14 7 22 8 11 16% 5 0 South Brunswick 55+ 31 0 99 0 4 4 3 12% 4 1 South Brunswick Single Family 136 12 11 6 31 13 30 22% 10 1 Monroe: All Styles 481 22 240 10 90 58 100 21% 36 7 Monroe: 55+ 320 16 20 5 58 37 71 22% 20 5 Monroe: Single Family 160 6 26 5 232 21 29 17% 16 2
  • 41.
    Market Activity: Townby Town Analysis 5/11/09 Towns Active Listings Pending in Last 30 Days Absorption Rate in Months New Listings in 30 Days Net Gain (Loss) to Market Listings Reduced in 30 Days % of Invent. Reduced Expired & W/drawn Listings Closed Listings Montgom. 156 22 7.1 56 34 42 26.9% 5 5 16 Hillboro 253 37 6.8 58 21 51 20.2% 12 8 35 Rocky Hill 4 0 99 0 0 1 25% 1 0 1 Franklin 389 43 9 114 71 61 15.7% 18 15 30
  • 42.
  • 43.
    West Windsor SingleFamily Absorption Rate
  • 44.
  • 45.
    South Brunswick SingleFamily Absorption Rate
  • 46.
  • 47.
  • 48.
  • 49.
  • 50.
    Understand the MarketThat You are Buying into… I want to live in West Windsor because of the schools and the trains
  • 51.
    Town by TownAnalysis 5/11/09 Towns Active Listings Pending in Last 30 Days Absorption Rate in Months Active w/ Contract in 30 Days New Listings in 30 Days Net Gain (Loss) to Market Listings Reduced in 30 Days % of Invent. Reduced Expired Listings W/drawn Listings West Windsor: All Styles 144 35 4.1 48 52 (31) 38 26% 5 3 West Windsor Condo/ T.Houses 34 11 3.0 14 18 (7) 7 20% 2 0 West Windsor 55+ 9 0 99 - - - - - - - West Windsor Single Family 101 24 4.2 34 34 (24) 31 31% 3 3
  • 52.
    Market Absorption Rate 26 current active listings 10 reported ‘pending’ sales in last 30 days = 2.6 months absorption rate West Windsor, NJ Townhouse Market: All 5-6 Months Market Absorption Rate indicates a normal market.
  • 53.
    Market Absorption Rate 109 current active listings 26 reported ‘pending’ sales in last 30 days = 4.19 months absorption rate West Windsor, NJ All Single Family 5-6 Months Market Absorption Rate indicates a normal market.
  • 54.
    Market Absorption Rate 38 current active listings 9 reported ‘pending’ sales in last 30 days = 4.2 months absorption rate West Windsor, NJ All Single Family $600-$800k 5-6 Months Market Absorption Rate indicates a normal market.
  • 55.
    Market Absorption Rate 7 current active listings 0 reported ‘pending’ sales in last 30 days = 99 months absorption rate West Windsor, NJ All Single Family $1 million + 5-6 Months Market Absorption Rate indicates a normal market.
  • 56.
    Market Absorption Rate 9 current active listings 0 reported ‘pending’ sales in last 30 days = 99 months absorption rate West Windsor, NJ ‘ 55+’ only 5-6 Months Market Absorption Rate indicates a normal market.
  • 57.
    2. ‘I amgoing to time the Market and buy at the peak inventory level and when no one else buys…’ Source: MLS
  • 58.
    Source: MLS WeeklyGuests Thru the Weichert Princeton Open Houses, 2007
  • 59.
    Source: MLS InventoryLevels, Princeton, New Jersey, 2007
  • 60.
    3. ‘I amgoing to wait until the price comes down further and then make an offer…’ Source: MLS
  • 61.
    Town by TownAnalysis 5/11/09 Towns Active Listings Pending in Last 30 Days Absorption Rate in Months Active w/ Contract in 30 Days New Listings in 30 Days Net Gain (Loss) to Market Listings Reduced in 30 Days % of Invent. Reduced Expired Listings W/drawn Listings Hopewell Twp.: All Styles 172 10 17.2 14 38 14 55 32% 7 4 Hopewell Twp. : Condo/ T.Houses 21 5 4.2 0 6 1 9 43% 2 0 Hopewell Twp.: 55+ 3 0 99 - - - - - - - Hopewell : Single Family 148 5 29.6 14 32 13 46 31% 5 4 Hamilton: All Styles 583 47 12 41 160 72 143 25% 41 21 Hamilton: Condo/ THouses 88 6 15 6 35 23 38 43% 11 5 Hamilton 55+ 37 0 99 - - - - - - - Hamilton: Single Family 458 41 11 35 125 49 105 23% 30 16
  • 62.
    Source: trend mlsRelationship of Price Reductions to ‘Pending Sales’
  • 63.
    Source: trend mlsRelationship of Price Reductions to ‘Pending Sales’
  • 64.
    Source: trend mlsRelationship of Price Reductions to ‘Pending Sales’
  • 65.
    Factors to considerwhen buying and selling… Source: MLS Inventory(supply and demand) Interest Rates
  • 66.
    Interest Rates RemainLow Source: Freddie Mac
  • 67.
    Interest Rates RemainLow Source: otteau
  • 68.
  • 69.
    Seeing the Opportunity.Q. If this were 2005, where would you place the Price and Rate dots? Prices Rates High Mid-Range Low A. In 2005, the V would look somewhat like this one, where prices were on the high end of the scale and rates were in the lower range.
  • 70.
    Seizing the Opportunity.In recent history, there has never been an opportunity like this, with low prices and low rates. In real estate, this circular area at the bottom of the V is called the “Buying Zone” – it’s an unbelievable time to buy. Prices Rates High Mid-Range Low
  • 71.
    Jeff Smith, Gold Services Manager/ Loan Officer Financial Benefits and Process of Home-Ownership.
  • 72.
    ‘ I don’twant to buy a house and then watch it drop in value!’
  • 73.
    The Real EstateMarket is not like the Stock Market. If you buy $400,000 in stock you need $400,000 in cash. If you buy a $400,000 home you need only $14,000 down-payment.
  • 74.
      Purchase Price$329,000 Loan Amount $281,000 Down Payment $11,515 Monthly P&I $1,590 Appreciation/Depreciation Home Value 1st Year -3% $305,970 2nd Year 0% $305,970 3rd Year 1% $309,030 4th Year 3% $318,301 5th Year 5% $334,216 5 Year Appreciation/Depreciation $5,216 Tax Benefit   Rent @ $1600/mo 1st Year $5,000 $19,200 2nd Year $5,000 $19,200 3rd Year $5,000 $19,200 4th Year $5,000 $19,200 5th Year $5,000 $19,200 5 Year Total $25,000 $96,000 Total $30,216 Create Equity v Pay Rent
  • 75.
    Incentive From theGovernment First-time homebuyers can receive a tax credit up to $8000!
  • 76.
    Tax Credit OverviewDistribute NAR Tax Credit Overview handout Amount Ten percent of the cost of home, not to exceed $8,000 Property Any single family residence that will be used as a principal residence Refundable Reduces income tax liability for the year of purchase Income Limit Adjusted gross income of $75,000 single or $150,000 joint tax returns First-Time Must not have owned a principal residence in 3 years prior to purchase
  • 77.
    Tax Credit FAQsCan individuals with incomes higher than the income limits still benefit from the tax credit? How does a tax credit work? How do I apply for the credit? Is there a way to get the credit before I file my tax return? How does the repayment work? Distribute NAR Frequently Asked Question handout
  • 78.
    How much housecan I really afford?
  • 79.
    The first stepis to meet with me! Establish Your Buying Power
  • 80.
    Joshua D. Wilton,Manager Strategies for Selling
  • 81.
    Understand the MarketThat You are Selling Out of … I live in Montgomery
  • 82.
    Market Absorption Rate Comparable Properties 7 current active listings 2 reported ‘pending’ sales in last 30 days = 3.5 month absorption rate 5-6 Months Market Absorption Rate indicates a normal market. Montgomery, NJ Townhouses Only
  • 83.
    Market Absorption Rate Comparable Properties 62 current active listings 6 reported ‘pending’ sales in last 30 days = 10.3 month absorption rate 5-6 Months Market Absorption Rate indicates a normal market. Montgomery, NJ Single Family $500-799
  • 84.
    Market Absorption Rate Comparable Properties 42 current active listings 3 reported ‘pending’ sales in last 30 days = 14 month absorption rate 5-6 Months Market Absorption Rate indicates a normal market. Montgomery, NJ Single Family $800+
  • 85.
    Market Absorption Rate Comparable Properties 13 current active listings 0 reported ‘pending’ sales in last 30 days = 99 month absorption rate 5-6 Months Market Absorption Rate indicates a normal market. Montgomery, NJ 4+ Bed, Single Family $600 - $800k
  • 86.
    ‘ Great speechbut does it really work?
  • 87.
    We know thebest way to evaluate pricing Does this really work?
  • 88.
    We know thebest way to evaluate pricing Does this really work?
  • 89.
    2 . The Effect of Staging on the Value of a Your Home .
  • 90.
    The process ofpreparing homes for sale regardless of Price, Location, or Condition To achieve the maximum sales price in the minimum marketing time. The GOAL is to appeal to the broadest range of BUYERS .
  • 91.
    Non-Staged The WayYou Live In Your Home…
  • 92.
    … AndThe Way We Market And Sell A House Are Two Different Things. Staged
  • 93.
    “ The Investmentin Home Staging is Always Less than Your First Price Reduction!”
  • 94.
    Non-Staged Buyers OnlyKnow What They See …
  • 95.
    … NotThe Way It Is Going To Be. Staged
  • 96.
    Based on aStagedHomes.com survey of over 400 homes across Canada & the Continental US prepared for sale by an Accredited Staging Professional (ASP™) from June 2007 through November 2007.
  • 97.
    Why Promote Home Staging ? The average increase in sales price of an ASP Staged vs. non-Staged home is 6.9% . That is an additional $31,050 on a $450,000 sale.
  • 98.
    The average marketing time of an ASP Staged vs. non-Staged home is 80% less . Why Promote Home Staging ?
  • 99.
    3. The Effectof ‘ Pre-Inspection’ on the Sale of Your Home.
  • 100.
    What is ‘ Pre-Inspection?’
  • 101.
    Home Inspection WHATDOES PRE-INSPECTION INCLUDE? The standard home inspector's report will review the condition of the home's heating system, central air conditioning system (temperature permitting), interior plumbing and electrical systems; the roof, attic, and visible insulation; walls, ceilings, floors, windows and doors; the foundation, basement, and visible structure.  
  • 102.
    PRE-LISTING Home InspectionDOESN’T THE BUYER DO THE HOME INSPECTION?
  • 103.
    All Negotiations, includingreal estate, are all about negotiation and control. Who is in control? Right Price Right Staging All Repairs are done in advance. Offer a Home Warranty to the buyer..
  • 104.
    PRE-LISTING Home InspectionData on where most sales fall apart: attorney review, home inspection. Fall Thru Percentage 2007: 26% Fall Thru Percentage 2008: 10.2% .
  • 105.
    Home Improvements Iam moving out of the house, I do not want spend too much money to move. Or I just spent $$ on a new kitchen, I want $$$$$$ back on that investment when I move.
  • 106.
  • 107.
  • 108.
    Reality of today’smarket is that you will see the return on your investment not in an inflated sales price but in retaining the highest percentage of your list price and staying on the market the fewest # of days. Please consult with your Realtor & staging professional as to which improvements you should finish to make your home the most salable.
  • 109.
    Weichert Family ofCompanies What will a real estate company do for me?
  • 110.
    Making Your Purchaseas Smooth as Possible Buying a home involves the careful coordination of many people. Choosing a real estate team you can count on will make the process smoother and easier.
  • 111.
    Time is money.The Weichert Difference Stress kills. Time is life.
  • 112.
    Educate You. Negotiateon your behalf. Offer advice on due diligence. Manage all aspects of the transaction process. What Will a Weichert Agent Do for Me?
  • 113.
    We’re Here toHelp The Entire Process is reviewed by Legal Council.
  • 114.
    Resource and websitelist: Realtor.org Remodeling.com NAR.
  • 115.
    Resource and WebsiteList http://www.realtor.org/research/research/housinginx Remodeling.com www.Otteau.com www.Pre-listing-inspection.com
  • 116.
    Resource and WebsiteList: www.Housemaster.com www.Stagingshoppingcenter.com
  • 117.
    Resource and websitelist: www.Stagedhomes.com www.realestatestagingassociation.com www.foreclosurepoint.com www.realtytrac.com
  • 118.
    Good Luck withyour Move!