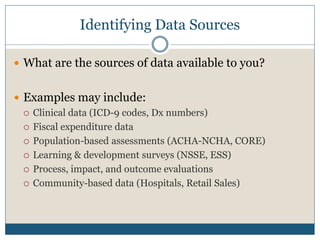
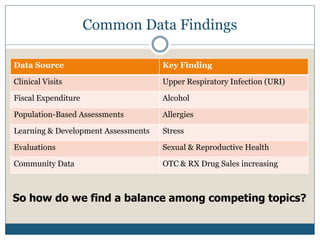
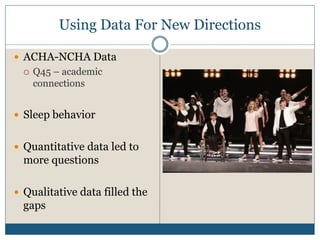
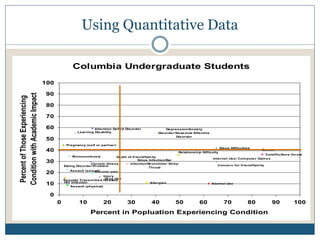
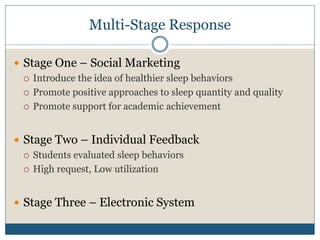
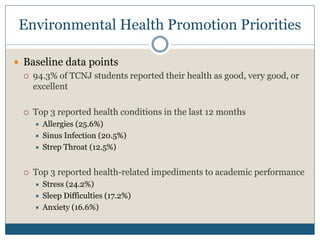
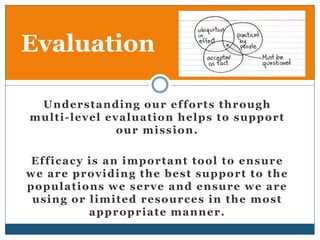
Applying Data & Research to
Developing Campus Priorities

           New Jersey Peer Institute
                May 25, 2010


     Michael P. McNeil, MS, CHES, FACHA
   Director, Alice! Health Promotion Program
              Columbia University

 Adjunct Faculty, Health Services Administration
           City University of New York
Learning Objectives

At the conclusion of the session the participant will be
 able to:

 List 4 different strategies for decision-making
 Identify 3 unique sources for health-related data that
  supports priority setting
 Describe campus specific application of research and
  data to develop priorities
 Discuss the evaluation of data and research-based
  priorities
An Exercise in Understanding

 Please take one of the note cards and list the single
 most important health-related priority on campus.

 In a moment we will make a list and discuss the
 justification for these items.
Background & History

There are a number of historical factors that may be helpful
 related to how we develop health-related priorities:

 Clinical data and experiences


 Past understanding of health issues on campus (historical
  records)

 Crisis response


 Broad-based data sources
Establishing Priorities on Campus

Priorities are determined by:
 History – a program continues to exist because it has become core to the unit
   operations
 Perception – a stated need that may not be supported by other data (includes
   emergent needs and anticipated needs)
 Directives – a mandate given from a source of authority to provide a program
   or service
 Mission-Driven – selecting priorities that reflect commitment to and support
   for the organizational mission
 Relevance to Higher Priorities – related the directives, this strategy is based on
   the need to support efforts of a higher level part of the organization
 Higher-Level Impact – some priority issues cannot be justified with process
   measures as the true impact is often unknown or under reported.
 Data-Driven Decisions – quantitative or qualitative data that support priorities
Identifying Data Sources

 What are the sources of data available to you?


 Examples may include:
   Clinical data (ICD-9 codes, Dx numbers)

   Fiscal expenditure data

   Population-based assessments (ACHA-NCHA, CORE)

   Learning & development surveys (NSSE, ESS)

   Process, impact, and outcome evaluations

   Community-based data (Hospitals, Retail Sales)
Common Data Findings

Data Source                          Key Finding

Clinical Visits                      Upper Respiratory Infection (URI)

Fiscal Expenditure                   Alcohol

Population-Based Assessments         Allergies

Learning & Development Assessments   Stress

Evaluations                          Sexual & Reproductive Health

Community Data                       OTC & RX Drug Sales increasing


So how do we find a balance among competing topics?
Program Dominance Example


 Our most well known program
 Accurate, culturally competent, non-judgmental
  information a basis for supporting positive health
  decision-making
 Provides significant recognition and positive
  reputation for Health Services
 Accounted for more than 50% of the OTPS budget
Using Data For New Directions

 ACHA-NCHA Data
     Q45 – academic
      connections


 Sleep behavior


 Quantitative data led to
  more questions

 Qualitative data filled the
  gaps
Using Quantitative Data

                                                Columbia Undergraduate Students
                                 100

                                  90
Condition with Academic Impact
 Percent of Those Experiencing


                                  80

                                  70

                                  60                         Atte ntion De ficit Dis orde r                De pre s s ion/Anxie ty
                                                   Le arning Dis ability                              Dis orde r/Se as onal Affe ctive
                                                                                                                 Dis orde r
                                  50
                                            Pre gnancy (s e lf or partne r)
                                                                                                                                                  Sle e p Difficultie s
                                  40                                                                                  Re lations hip Difficulty
                                                                                                                                                                          Stre s s
                                                                                                                                                                           Cold/Flu/Sore throat
                                                M ononucle os is             De ath of frie nd/fam ily
                                                                                                                                           Inte rne t Us e / Com pute r Gam e s
                                                                                          Sinus Infe ction/Ear
                                  30                         Chronic illne s s       Infe ction/Bronchitis / Stre p
                                           Eating Dis orde r/Proble m                                                                         Conce rn for frie nd/fam ily
                                                                                                 Throat
                                               As s ault (s e xual)
                                  20                            Chronic pain
                                                                     Injury
                                                                      Drug Us e
                                           Se xually Trans m itte d Dis e as e
                                           HIV Infe ction
                                  10           As s ault (phys ical)
                                                                                                 Alle rgie s                              Alcohol Us e


                                   0
                                       0            10             20             30              40             50                60                70              80         90        100
                                                           Percent in Popluation Experiencing Condition
Multi-Stage Response

 Stage One – Social Marketing
   Introduce the idea of healthier sleep behaviors

   Promote positive approaches to sleep quantity and quality

   Promote support for academic achievement


 Stage Two – Individual Feedback
   Students evaluated sleep behaviors

   High request, Low utilization


 Stage Three – Electronic System
A!sleep
Environmental Health Promotion Priorities

 Baseline data points
   94.3% of TCNJ students reported their health as good, very good, or
    excellent

     Top 3 reported health conditions in the last 12 months
         Allergies (25.6%)
         Sinus Infection (20.5%)
         Strep Throat (12.5%)


     Top 3 reported health-related impediments to academic performance
         Stress (24.2%)
         Sleep Difficulties (17.2%)
         Anxiety (16.6%)
Environmental Health Promotion Priorities

The two lists on the previous     Strategies engaged to address
                                  both lists can be mutually
slide are not in conflict
                                  supportive

       Allergies (25.6%)                 Stress (24.2%)


       Sinus Infection (20.5%)           Sleep Difficulties (17.2%)


       Strep Throat (12.5%)              Anxiety (16.6%)
Environmental Health Promotion Priorities

Strategies
 Wash your hands


 Appropriate quantity and quality of sleep
     Policy


 Positive stress coping strategies
     Modeling
     Faculty involvement


 Time management


 Clean living and learning environments
Environmental Health Promotion Priorities

 Measuring the impact will be difficult on the
 individual level
    Matched samples approach within select populations


 ACHA-NCHA data can help measure longitudinal
 shift, but can not attribute causality

 Program-specific evaluation strategies can get closer
 to understanding impacts and outcomes
Program Example

 Objective: Students exposed to the Washroom
 Weekly will report increases in health knowledge.

 Expected Findings: Double digit increases in
 knowledge reported.

 Unexpected Findings: More than 25% increase in
 hand washing behaviors.
Evaluation

 U n d e r s t a n d i ng o u r e f f o r t s t h r o u g h
multi-level evaluation helps to support
                    our mission.

 Efficacy is an important tool to ensure
we are providing the best support to the
populations we serve and ensure we are
 using or limited resources in the most
          appropriate manner.
Likeable Versus Effective

 Step One – What is your purpose/goal?


 Step Two – Is this mission driven?


 Step Three – How have you involved key
 stakeholders?

 Step Four – How will you measure success?
Measuring Success

       Why do we evaluate our
       efforts?

       How do we evaluate our
       efforts?
Evaluation

 Process          Short-term


 Impact
                   Intermediate
 Outcome


                   Long-term
Your Turn

Questions?

Comments?

 Cares?

Concerns?
Contact Me

Michael P. McNeil
Director, Alice! Health Promotion Program
Health Services at Columbia

212-854-5453
mm3117@columbia.edu

www.alice.columbia.edu

Applying data and research to developing campus priorities tcnj 2010

  • 1.
    Applying Data &Research to Developing Campus Priorities New Jersey Peer Institute May 25, 2010 Michael P. McNeil, MS, CHES, FACHA Director, Alice! Health Promotion Program Columbia University Adjunct Faculty, Health Services Administration City University of New York
  • 2.
    Learning Objectives At theconclusion of the session the participant will be able to:  List 4 different strategies for decision-making  Identify 3 unique sources for health-related data that supports priority setting  Describe campus specific application of research and data to develop priorities  Discuss the evaluation of data and research-based priorities
  • 3.
    An Exercise inUnderstanding  Please take one of the note cards and list the single most important health-related priority on campus.  In a moment we will make a list and discuss the justification for these items.
  • 4.
    Background & History Thereare a number of historical factors that may be helpful related to how we develop health-related priorities:  Clinical data and experiences  Past understanding of health issues on campus (historical records)  Crisis response  Broad-based data sources
  • 5.
    Establishing Priorities onCampus Priorities are determined by:  History – a program continues to exist because it has become core to the unit operations  Perception – a stated need that may not be supported by other data (includes emergent needs and anticipated needs)  Directives – a mandate given from a source of authority to provide a program or service  Mission-Driven – selecting priorities that reflect commitment to and support for the organizational mission  Relevance to Higher Priorities – related the directives, this strategy is based on the need to support efforts of a higher level part of the organization  Higher-Level Impact – some priority issues cannot be justified with process measures as the true impact is often unknown or under reported.  Data-Driven Decisions – quantitative or qualitative data that support priorities
  • 6.
    Identifying Data Sources What are the sources of data available to you?  Examples may include:  Clinical data (ICD-9 codes, Dx numbers)  Fiscal expenditure data  Population-based assessments (ACHA-NCHA, CORE)  Learning & development surveys (NSSE, ESS)  Process, impact, and outcome evaluations  Community-based data (Hospitals, Retail Sales)
  • 7.
    Common Data Findings DataSource Key Finding Clinical Visits Upper Respiratory Infection (URI) Fiscal Expenditure Alcohol Population-Based Assessments Allergies Learning & Development Assessments Stress Evaluations Sexual & Reproductive Health Community Data OTC & RX Drug Sales increasing So how do we find a balance among competing topics?
  • 8.
    Program Dominance Example Our most well known program  Accurate, culturally competent, non-judgmental information a basis for supporting positive health decision-making  Provides significant recognition and positive reputation for Health Services  Accounted for more than 50% of the OTPS budget
  • 9.
    Using Data ForNew Directions  ACHA-NCHA Data  Q45 – academic connections  Sleep behavior  Quantitative data led to more questions  Qualitative data filled the gaps
  • 10.
    Using Quantitative Data Columbia Undergraduate Students 100 90 Condition with Academic Impact Percent of Those Experiencing 80 70 60 Atte ntion De ficit Dis orde r De pre s s ion/Anxie ty Le arning Dis ability Dis orde r/Se as onal Affe ctive Dis orde r 50 Pre gnancy (s e lf or partne r) Sle e p Difficultie s 40 Re lations hip Difficulty Stre s s Cold/Flu/Sore throat M ononucle os is De ath of frie nd/fam ily Inte rne t Us e / Com pute r Gam e s Sinus Infe ction/Ear 30 Chronic illne s s Infe ction/Bronchitis / Stre p Eating Dis orde r/Proble m Conce rn for frie nd/fam ily Throat As s ault (s e xual) 20 Chronic pain Injury Drug Us e Se xually Trans m itte d Dis e as e HIV Infe ction 10 As s ault (phys ical) Alle rgie s Alcohol Us e 0 0 10 20 30 40 50 60 70 80 90 100 Percent in Popluation Experiencing Condition
  • 11.
    Multi-Stage Response  StageOne – Social Marketing  Introduce the idea of healthier sleep behaviors  Promote positive approaches to sleep quantity and quality  Promote support for academic achievement  Stage Two – Individual Feedback  Students evaluated sleep behaviors  High request, Low utilization  Stage Three – Electronic System
  • 12.
  • 13.
    Environmental Health PromotionPriorities  Baseline data points  94.3% of TCNJ students reported their health as good, very good, or excellent  Top 3 reported health conditions in the last 12 months  Allergies (25.6%)  Sinus Infection (20.5%)  Strep Throat (12.5%)  Top 3 reported health-related impediments to academic performance  Stress (24.2%)  Sleep Difficulties (17.2%)  Anxiety (16.6%)
  • 14.
    Environmental Health PromotionPriorities The two lists on the previous Strategies engaged to address both lists can be mutually slide are not in conflict supportive  Allergies (25.6%)  Stress (24.2%)  Sinus Infection (20.5%)  Sleep Difficulties (17.2%)  Strep Throat (12.5%)  Anxiety (16.6%)
  • 15.
    Environmental Health PromotionPriorities Strategies  Wash your hands  Appropriate quantity and quality of sleep  Policy  Positive stress coping strategies  Modeling  Faculty involvement  Time management  Clean living and learning environments
  • 16.
    Environmental Health PromotionPriorities  Measuring the impact will be difficult on the individual level  Matched samples approach within select populations  ACHA-NCHA data can help measure longitudinal shift, but can not attribute causality  Program-specific evaluation strategies can get closer to understanding impacts and outcomes
  • 17.
    Program Example  Objective:Students exposed to the Washroom Weekly will report increases in health knowledge.  Expected Findings: Double digit increases in knowledge reported.  Unexpected Findings: More than 25% increase in hand washing behaviors.
  • 18.
    Evaluation U nd e r s t a n d i ng o u r e f f o r t s t h r o u g h multi-level evaluation helps to support our mission. Efficacy is an important tool to ensure we are providing the best support to the populations we serve and ensure we are using or limited resources in the most appropriate manner.
  • 19.
    Likeable Versus Effective Step One – What is your purpose/goal?  Step Two – Is this mission driven?  Step Three – How have you involved key stakeholders?  Step Four – How will you measure success?
  • 20.
    Measuring Success  Why do we evaluate our efforts?  How do we evaluate our efforts?
  • 21.
    Evaluation  Process  Short-term  Impact  Intermediate  Outcome  Long-term
  • 22.
  • 23.
    Contact Me Michael P.McNeil Director, Alice! Health Promotion Program Health Services at Columbia 212-854-5453 mm3117@columbia.edu www.alice.columbia.edu