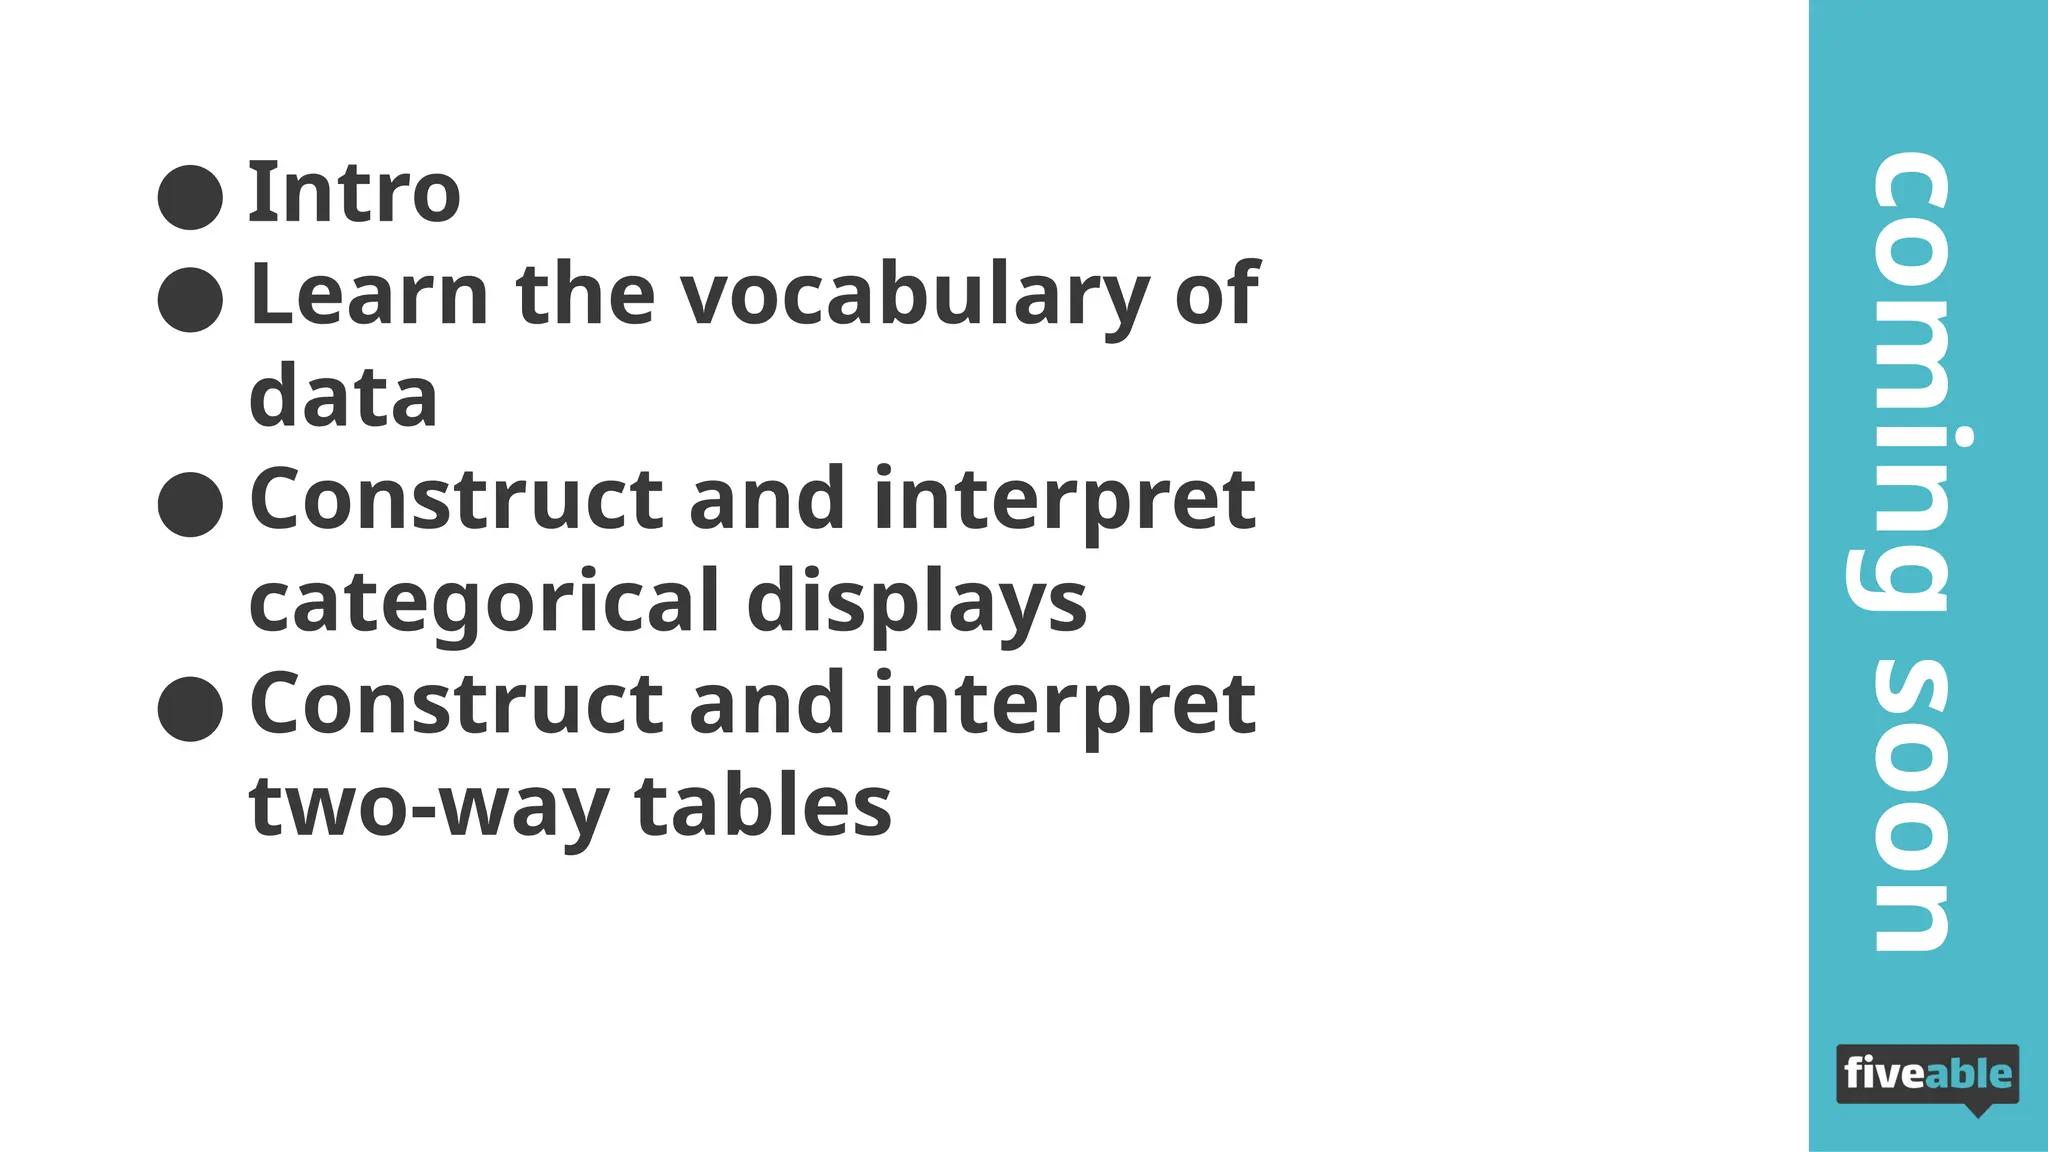
● Intro
● Learnthe vocabulary of
data
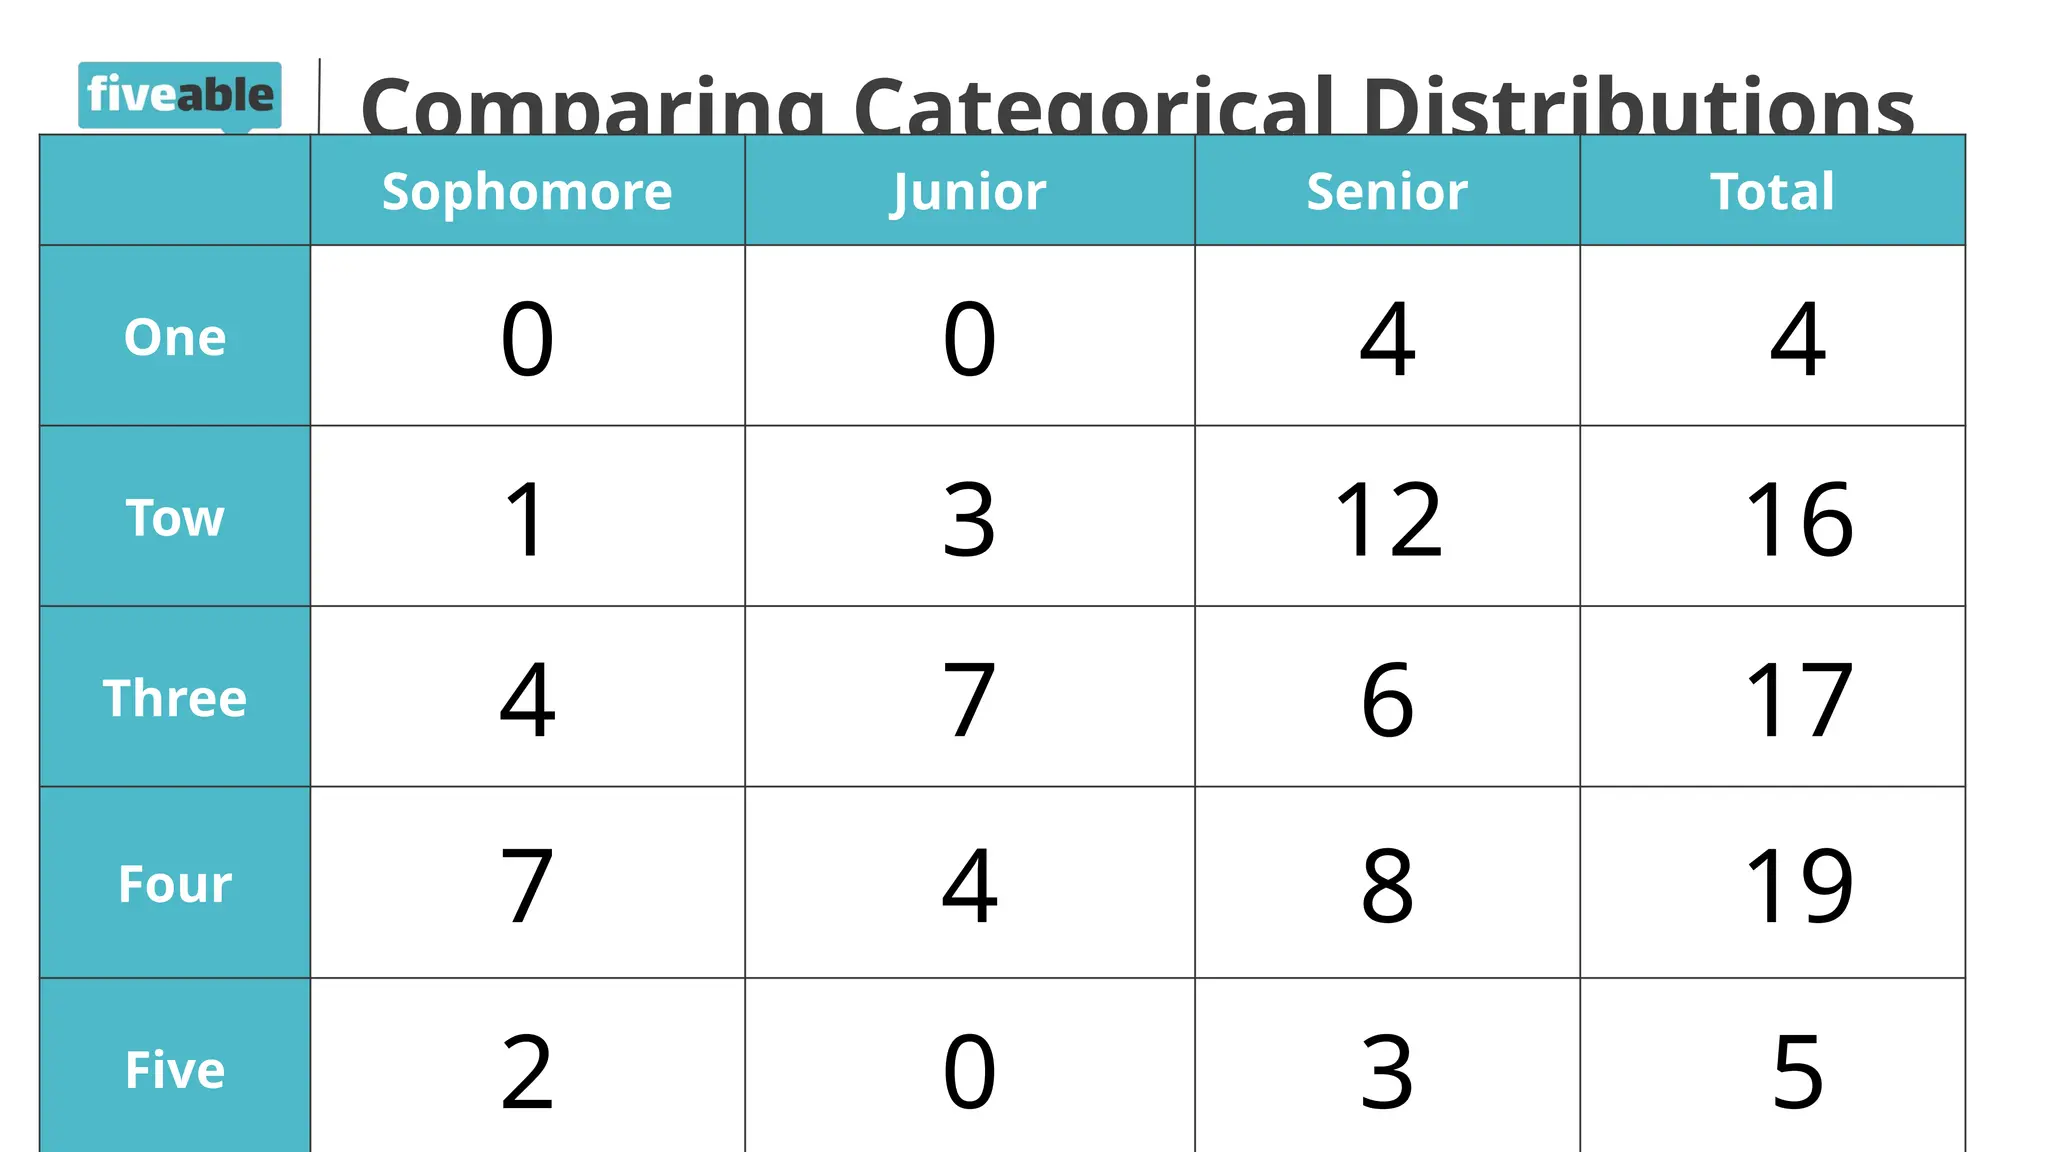
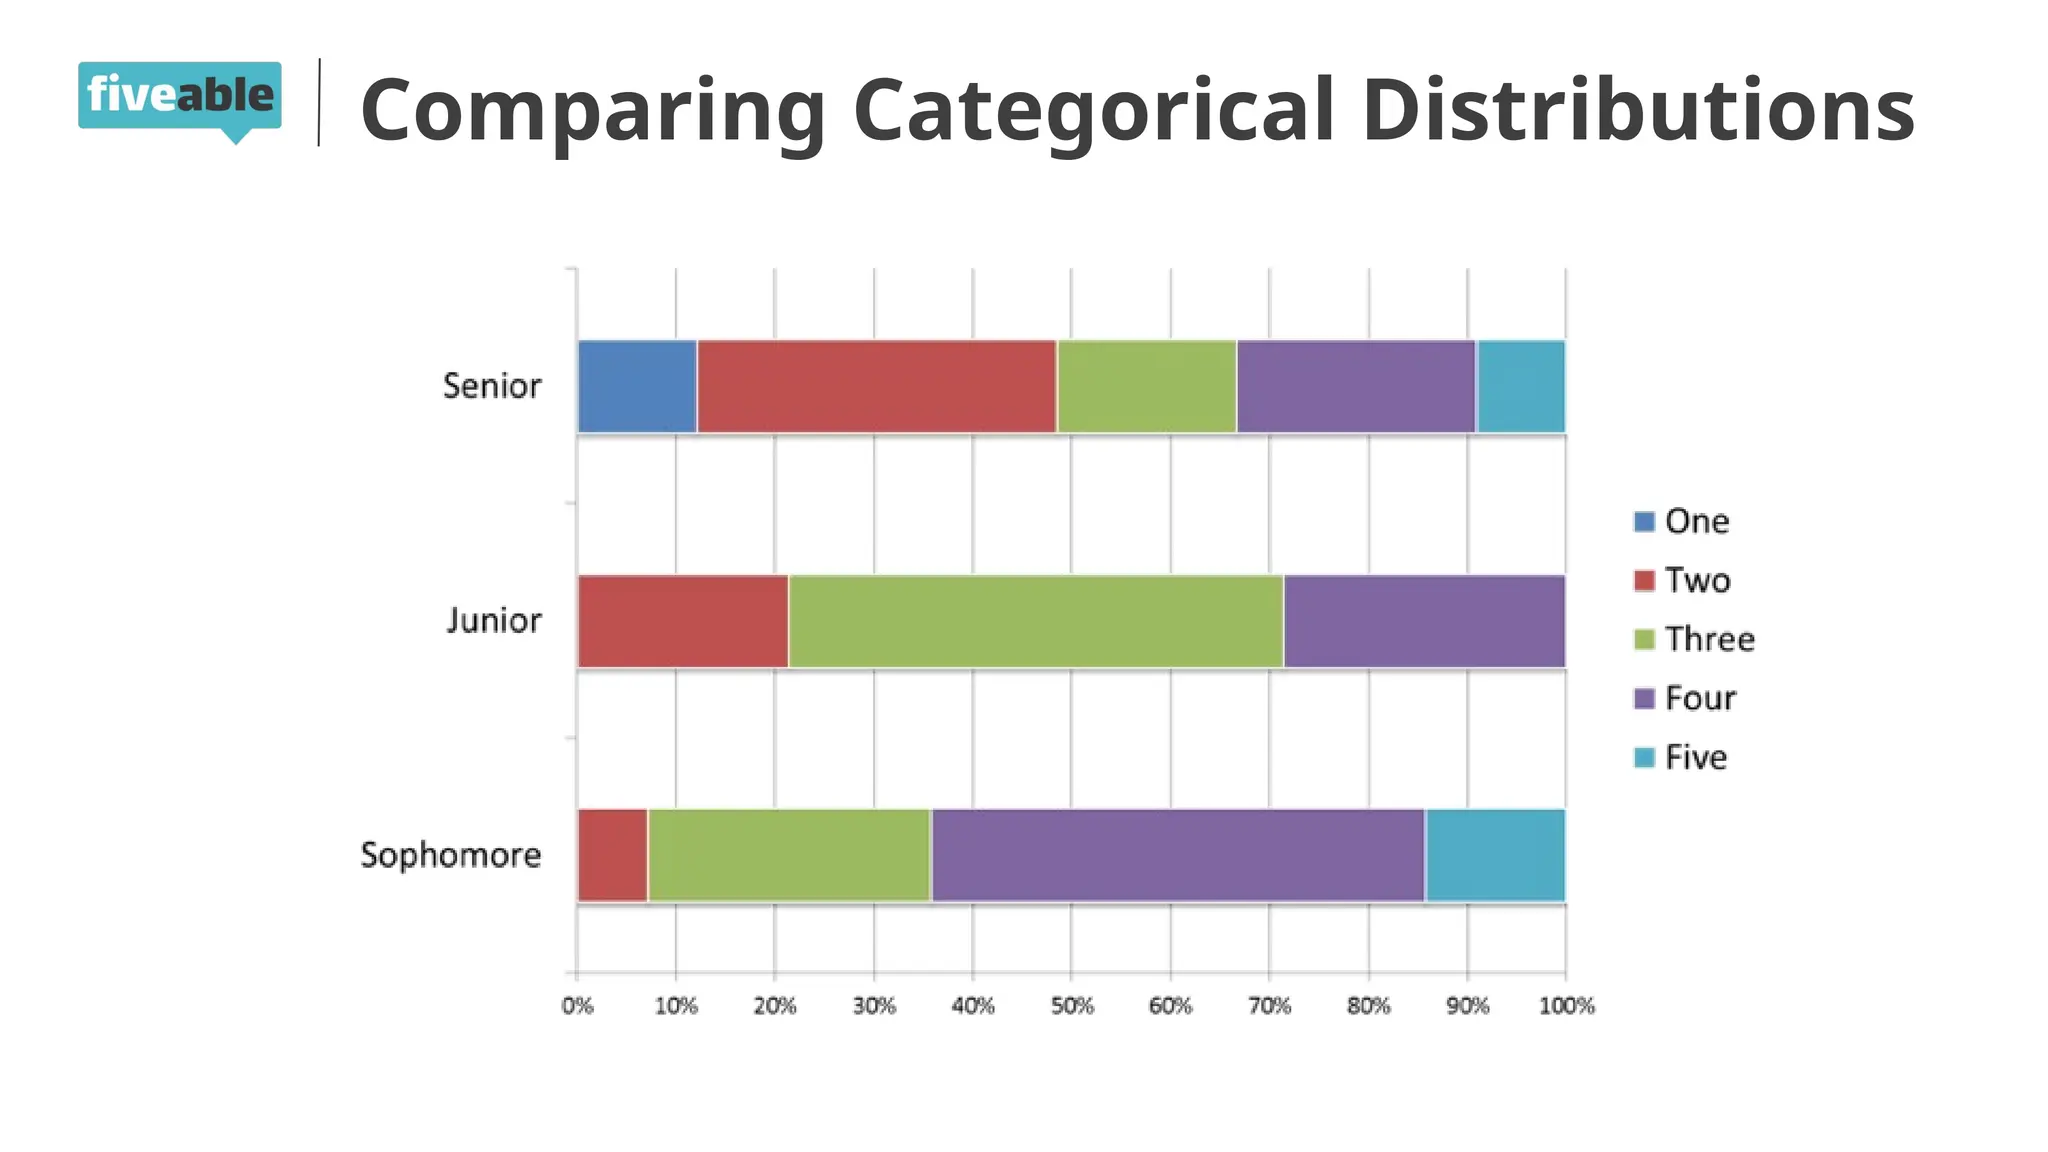
● Construct and interpret
categorical displays
● Construct and interpret
two-way tables
in
this
stream
coming
soon
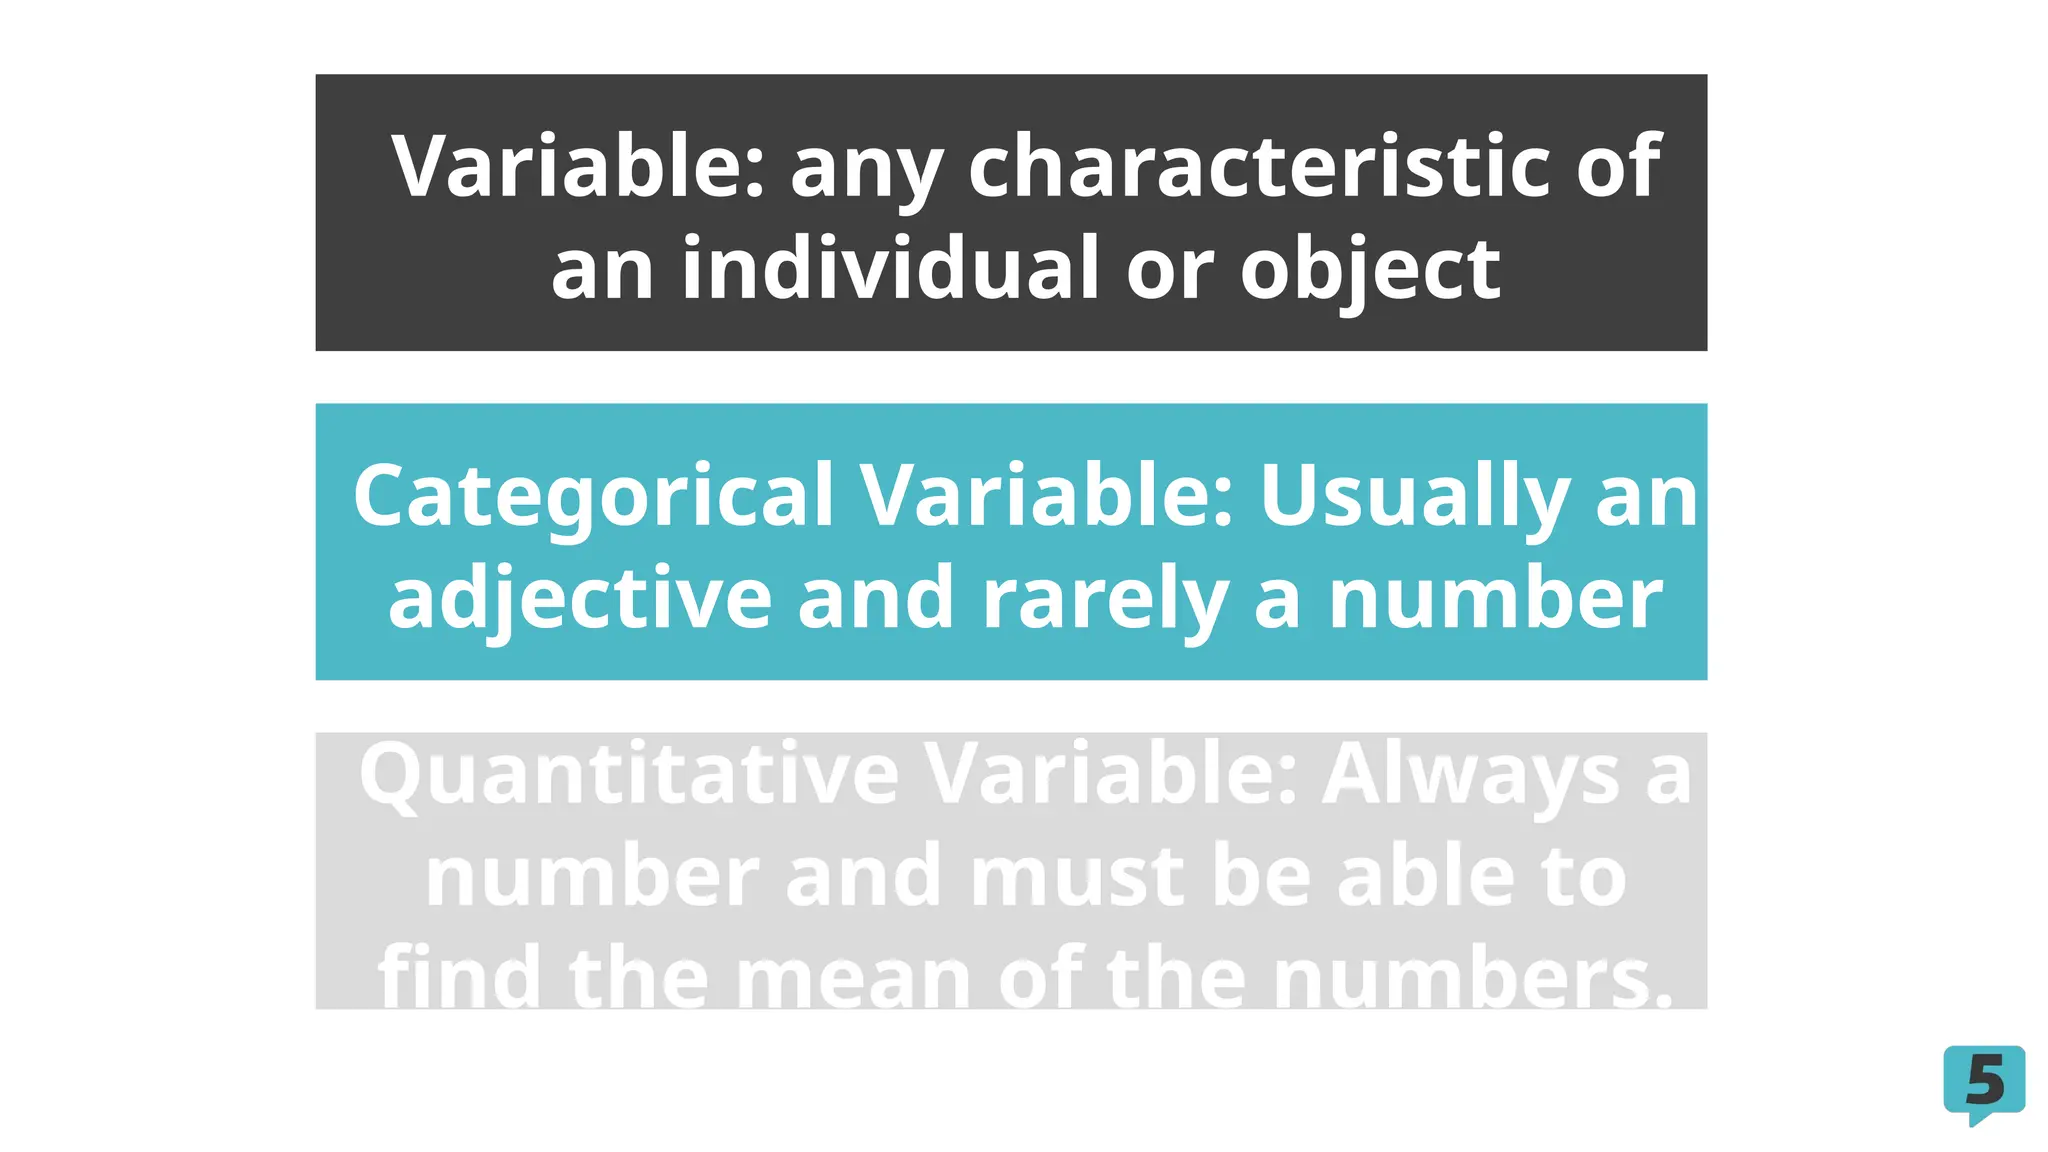
Categorical Variable: Usuallyan
adjective and rarely a number
Quantitative Variable: Always a
number and must be able to
find the mean of the numbers.
Variable: any characteristic of
an individual or object
6.
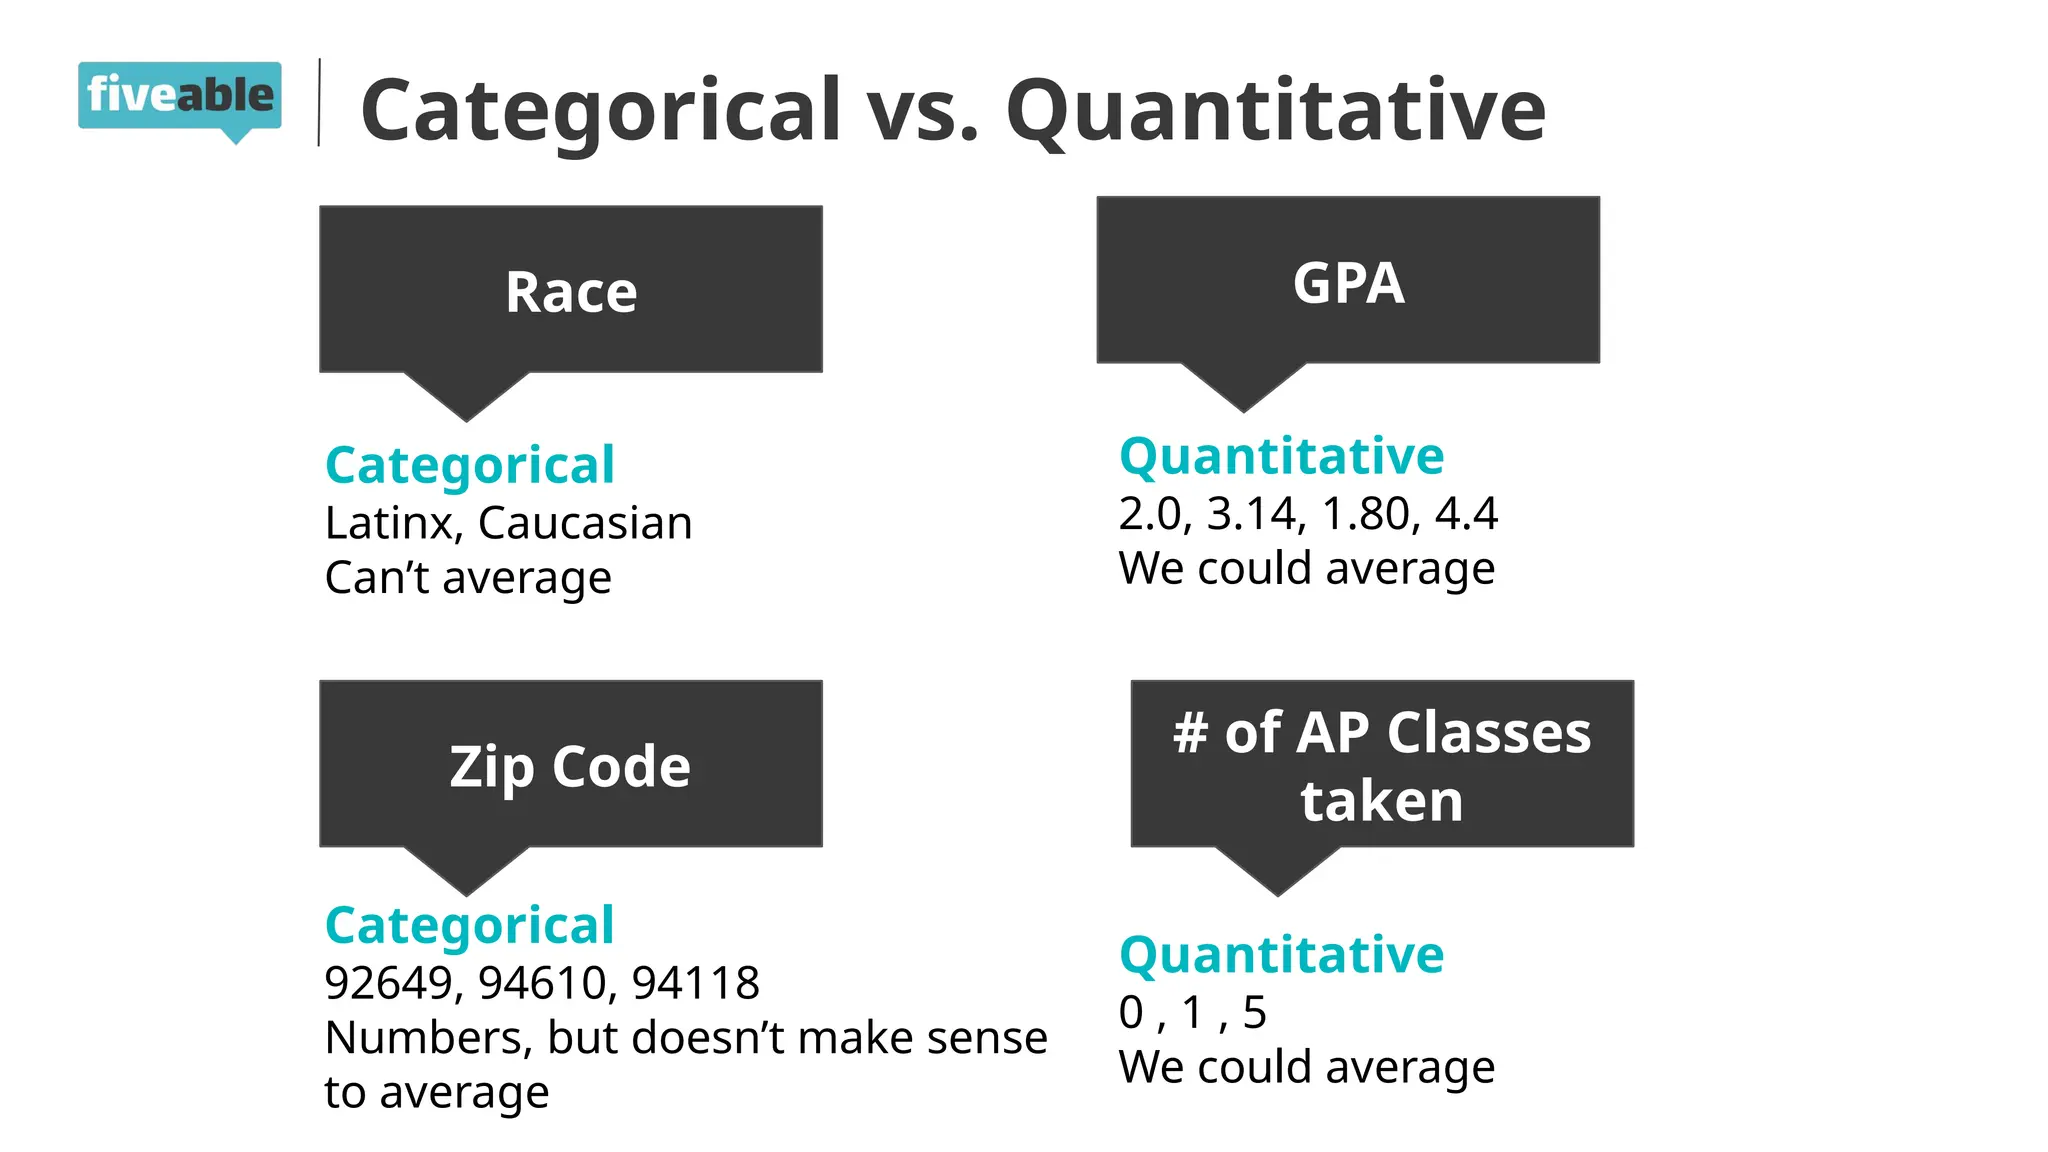
Categorical vs. Quantitative
Race
ZipCode
GPA
# of AP Classes
taken
Categorical
Latinx, Caucasian
Can’t average
Quantitative
2.0, 3.14, 1.80, 4.4
We could average
Quantitative
0 , 1 , 5
We could average
Categorical
92649, 94610, 94118
Numbers, but doesn’t make sense
to average
7.
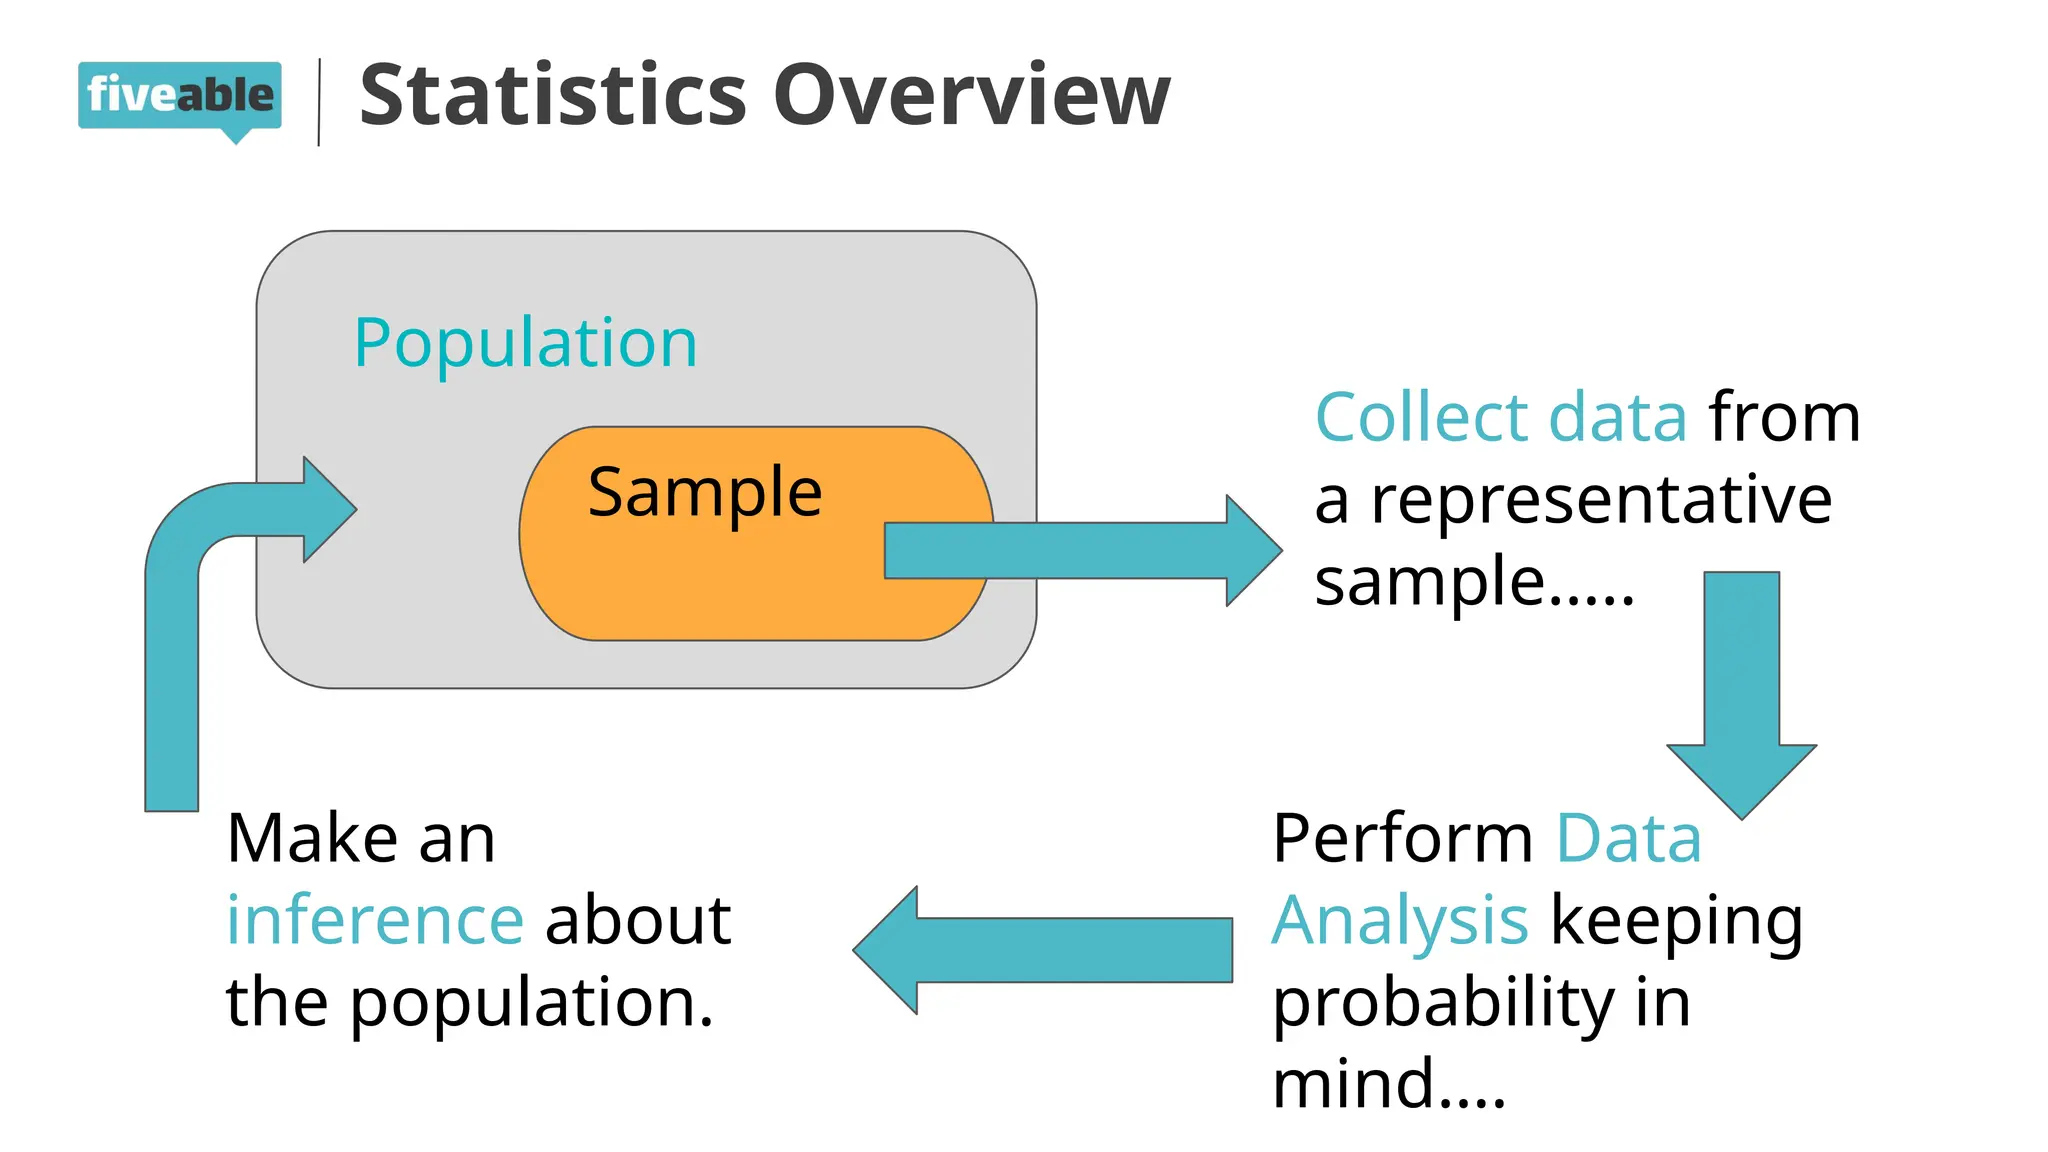
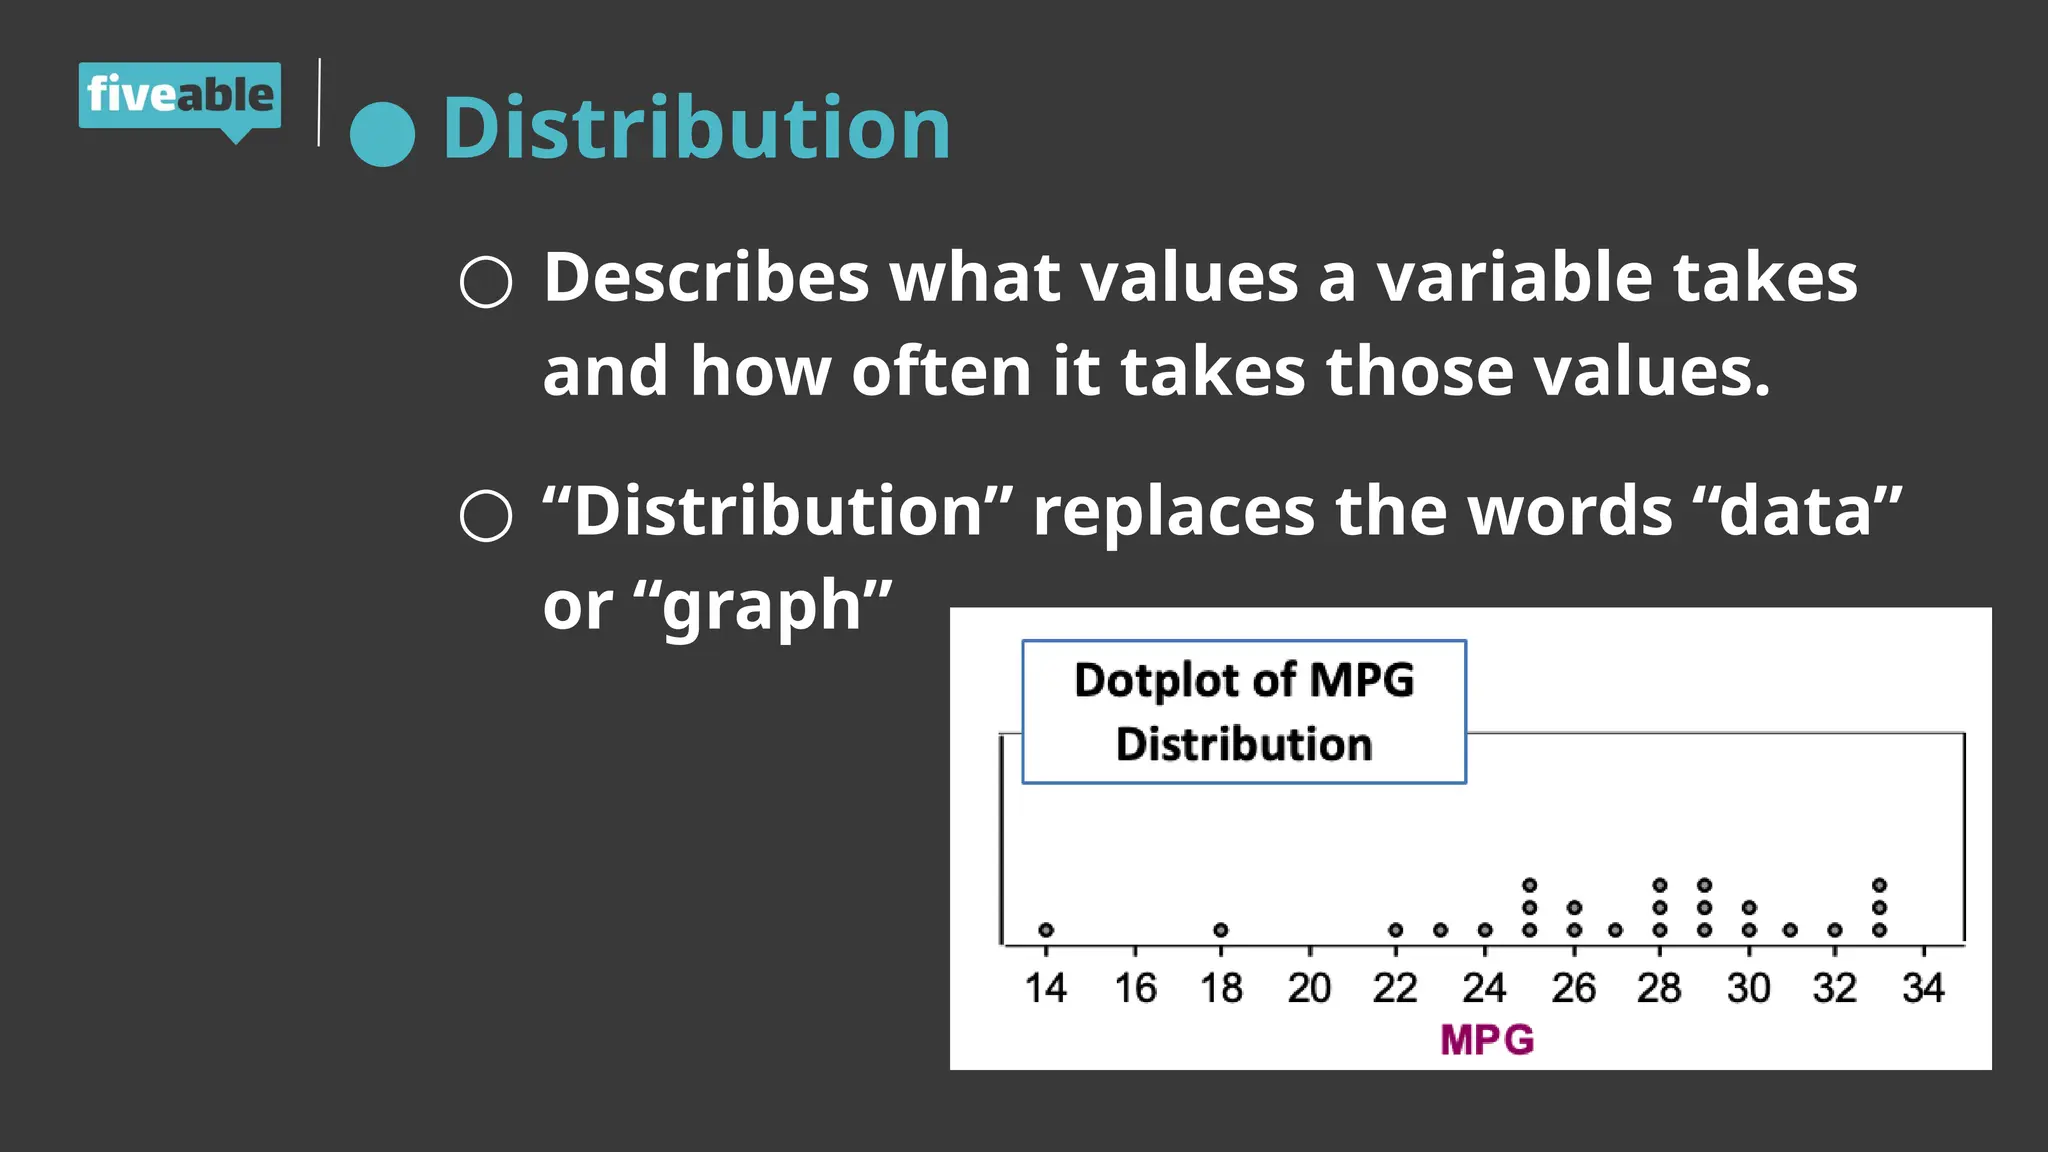
● Distribution
○ Describeswhat values a variable takes
and how often it takes those values.
○ “Distribution” replaces the words “data”
or “graph”
8.
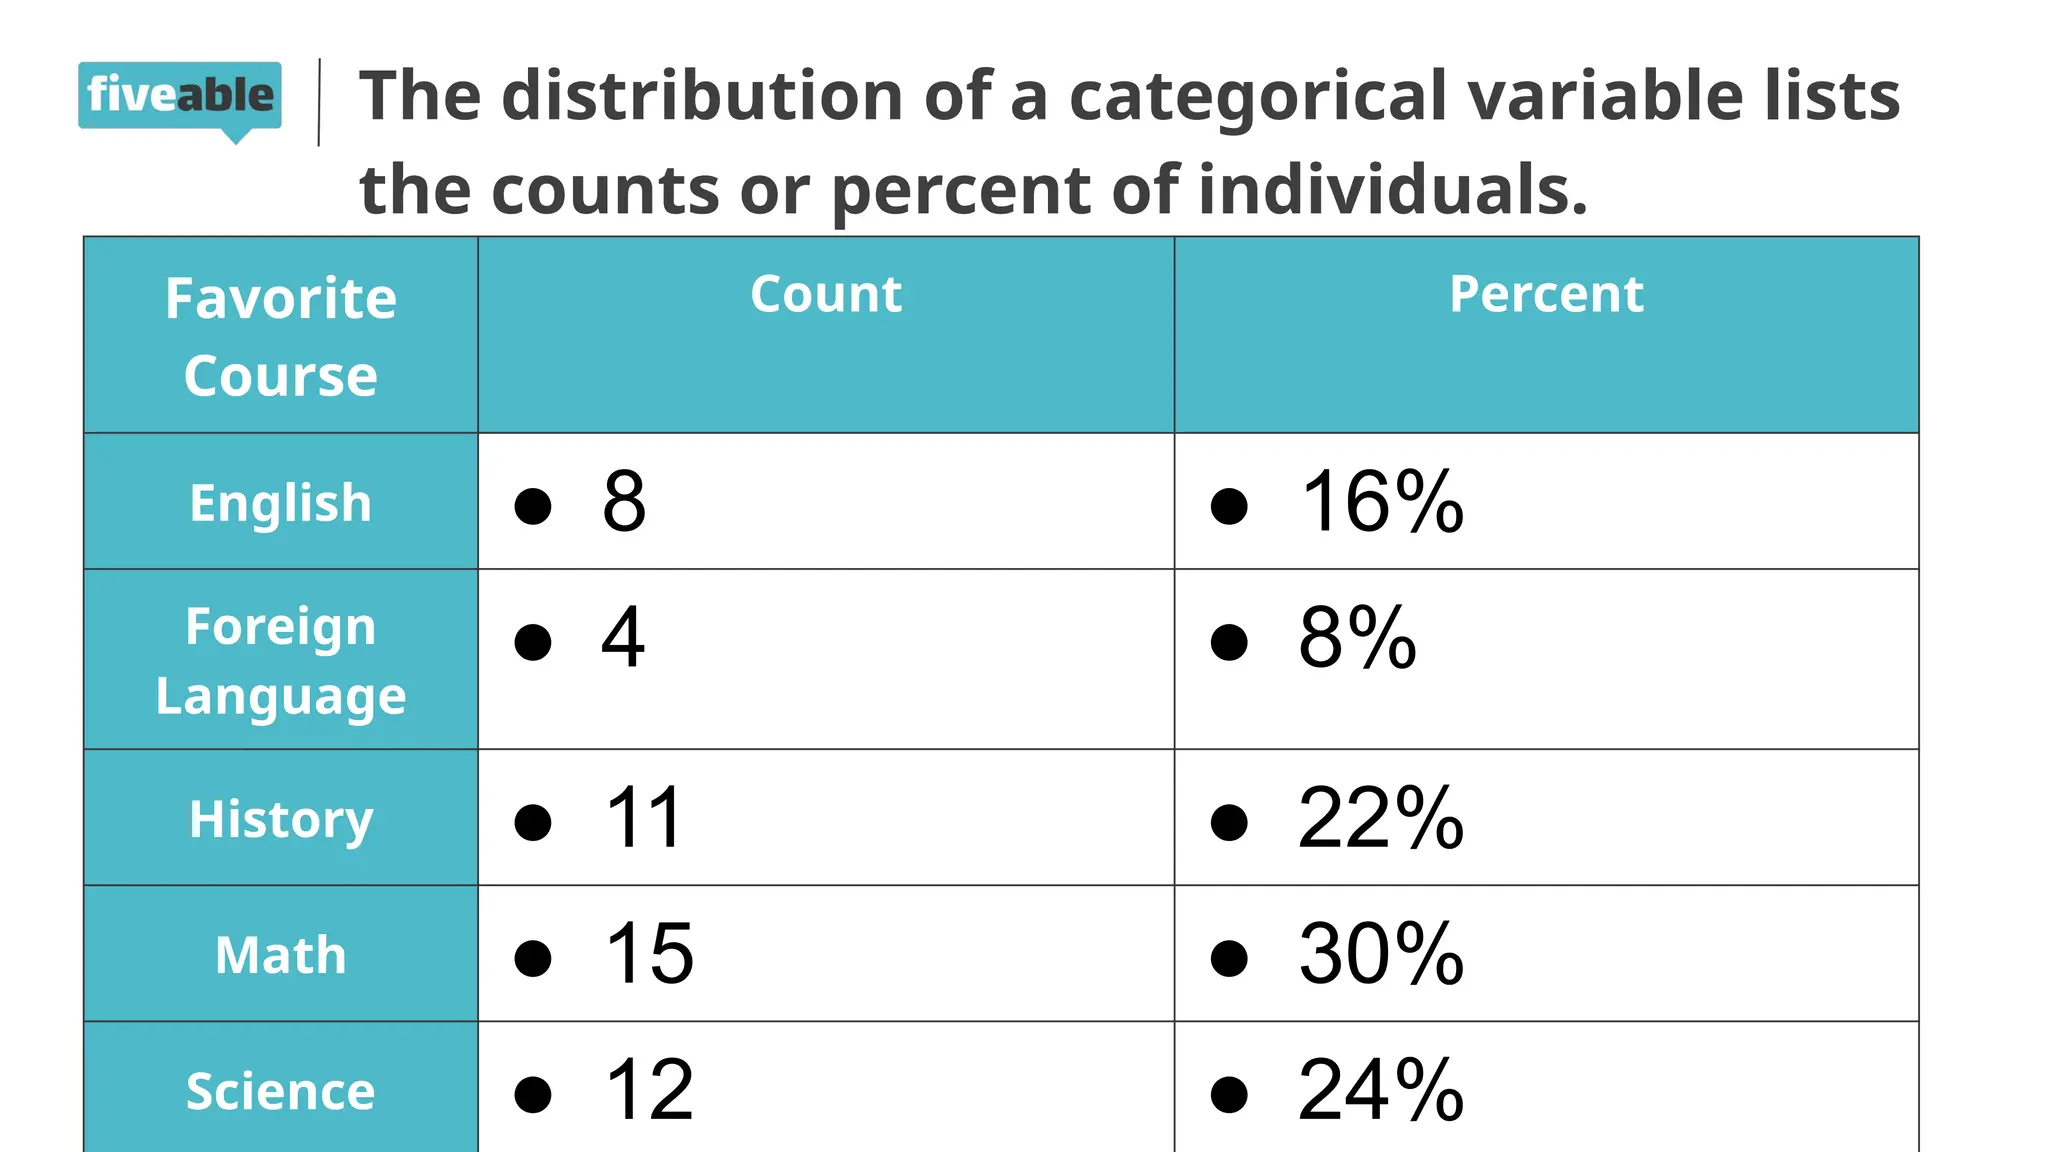
The distribution ofa categorical variable lists
the counts or percent of individuals.
Favorite
Course
Count Percent
English ● 8 ● 16%
Foreign
Language
● 4 ● 8%
History ● 11 ● 22%
Math ● 15 ● 30%
Science ● 12 ● 24%
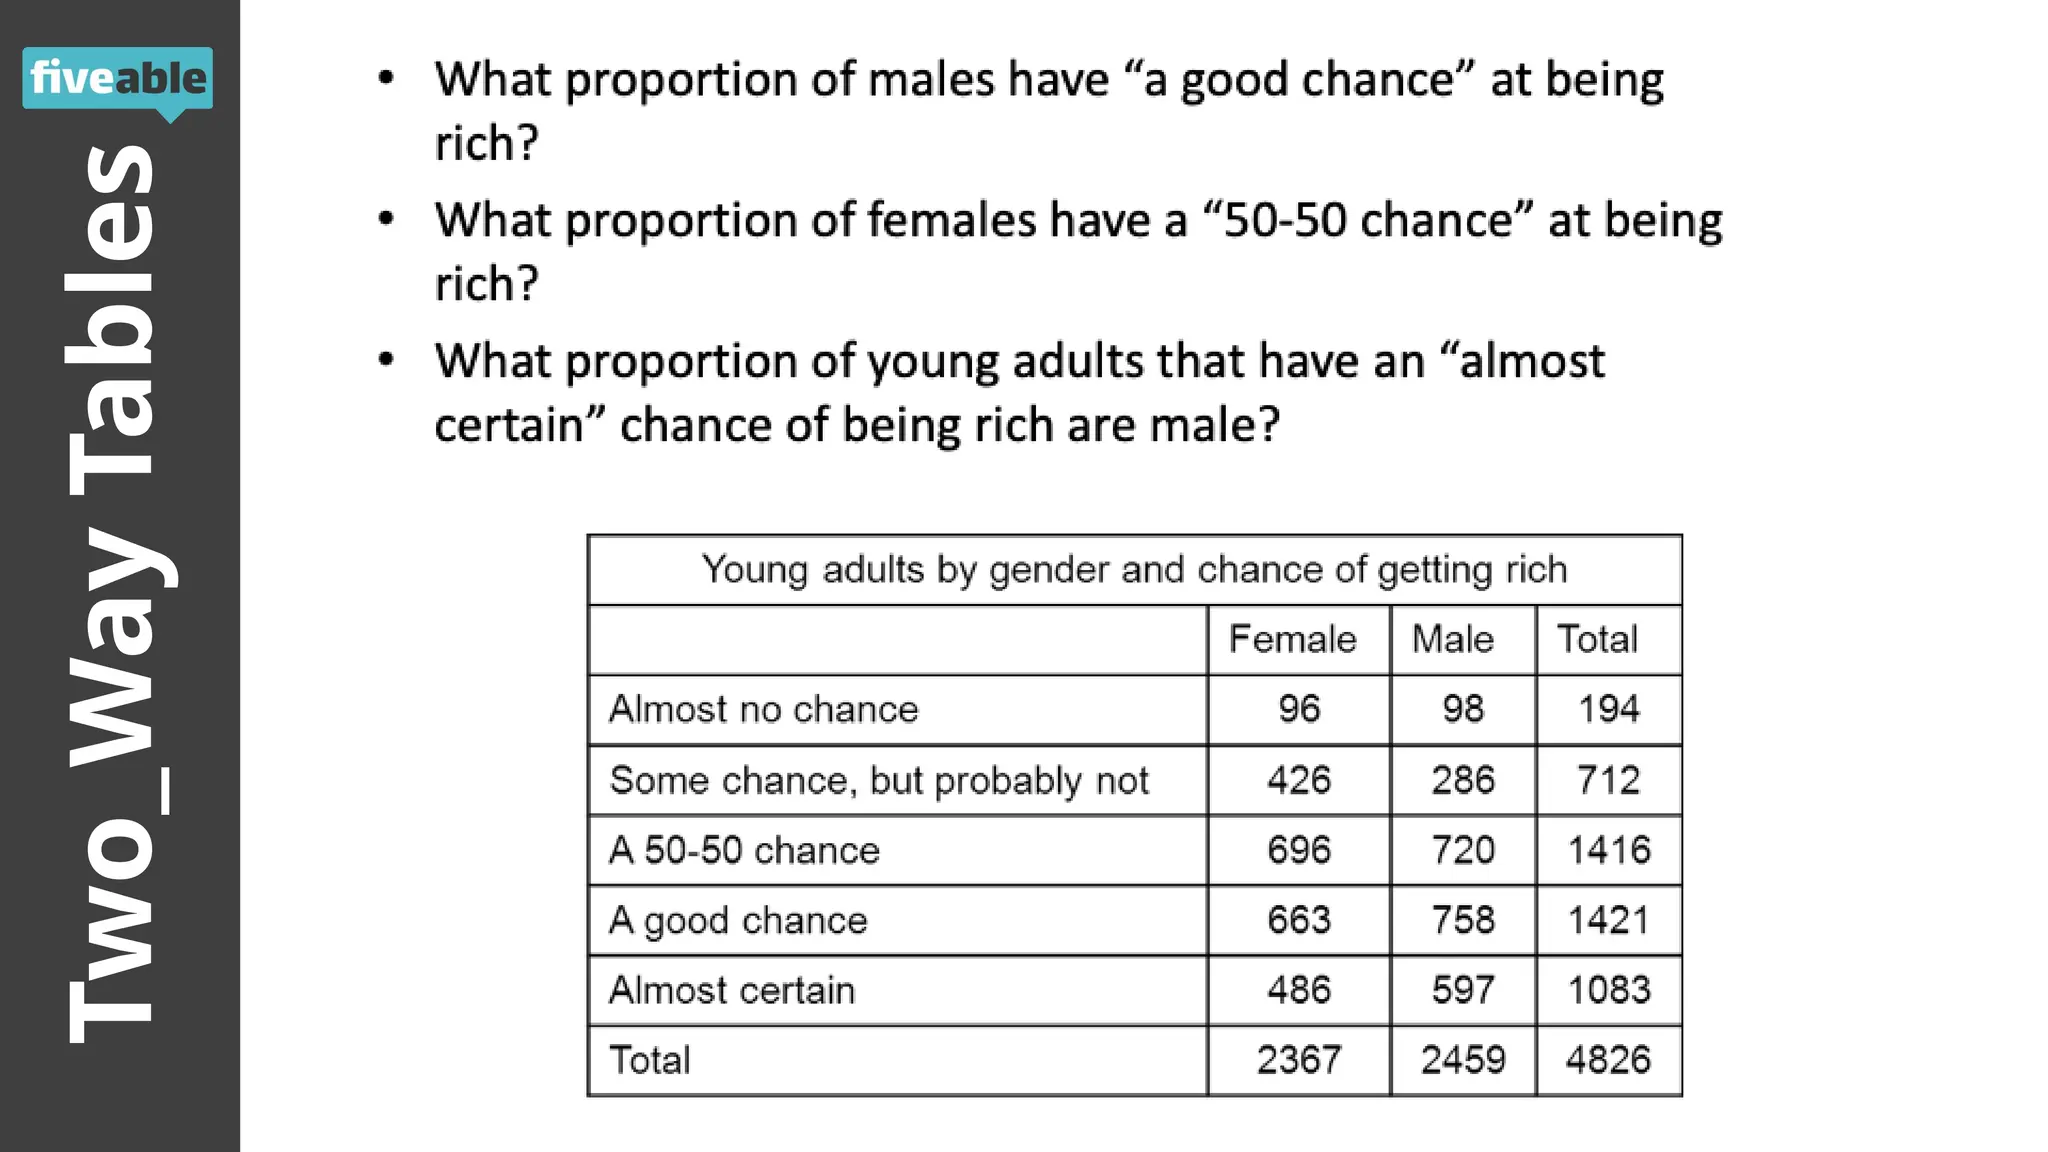
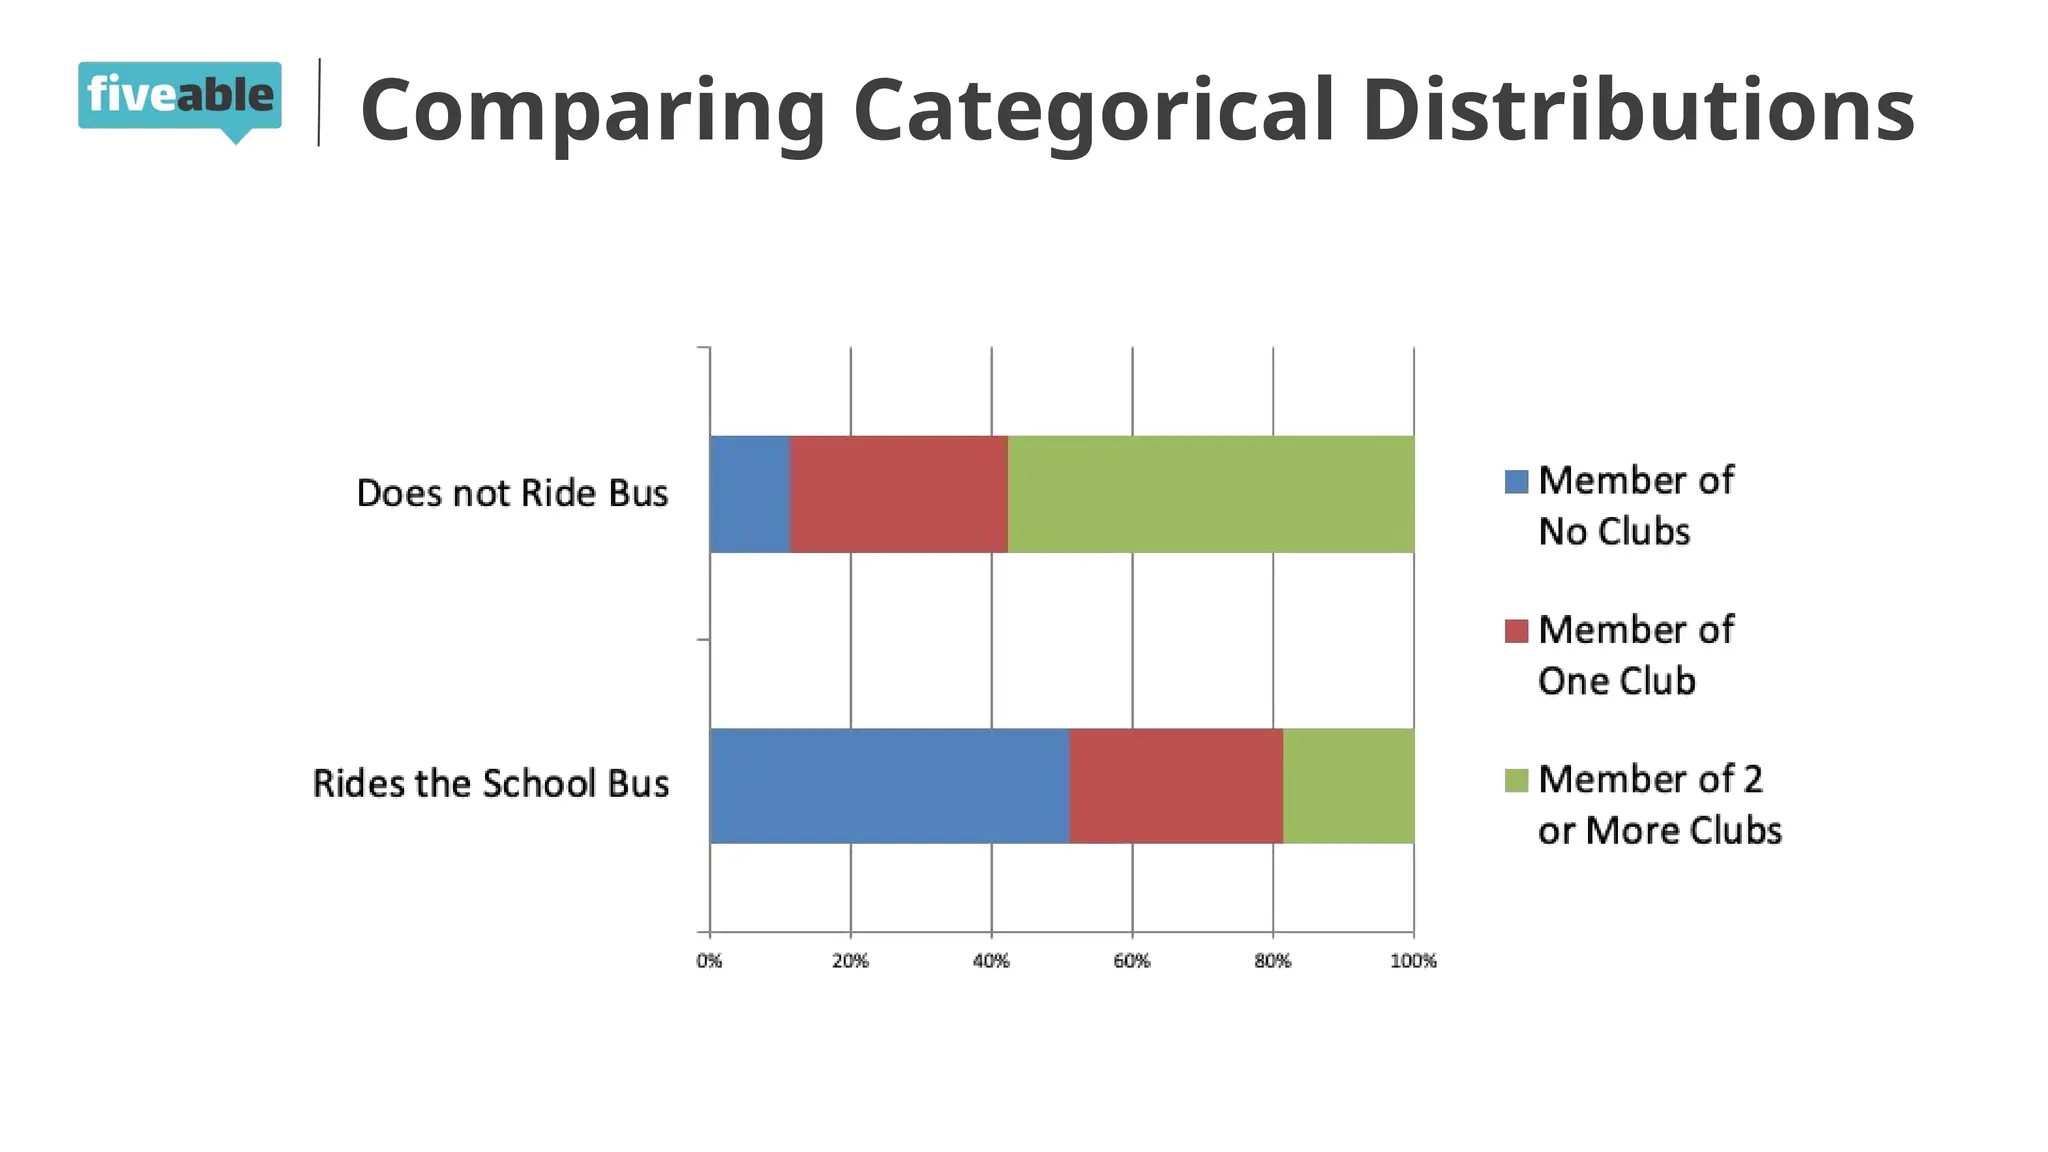
Two-Way Tables
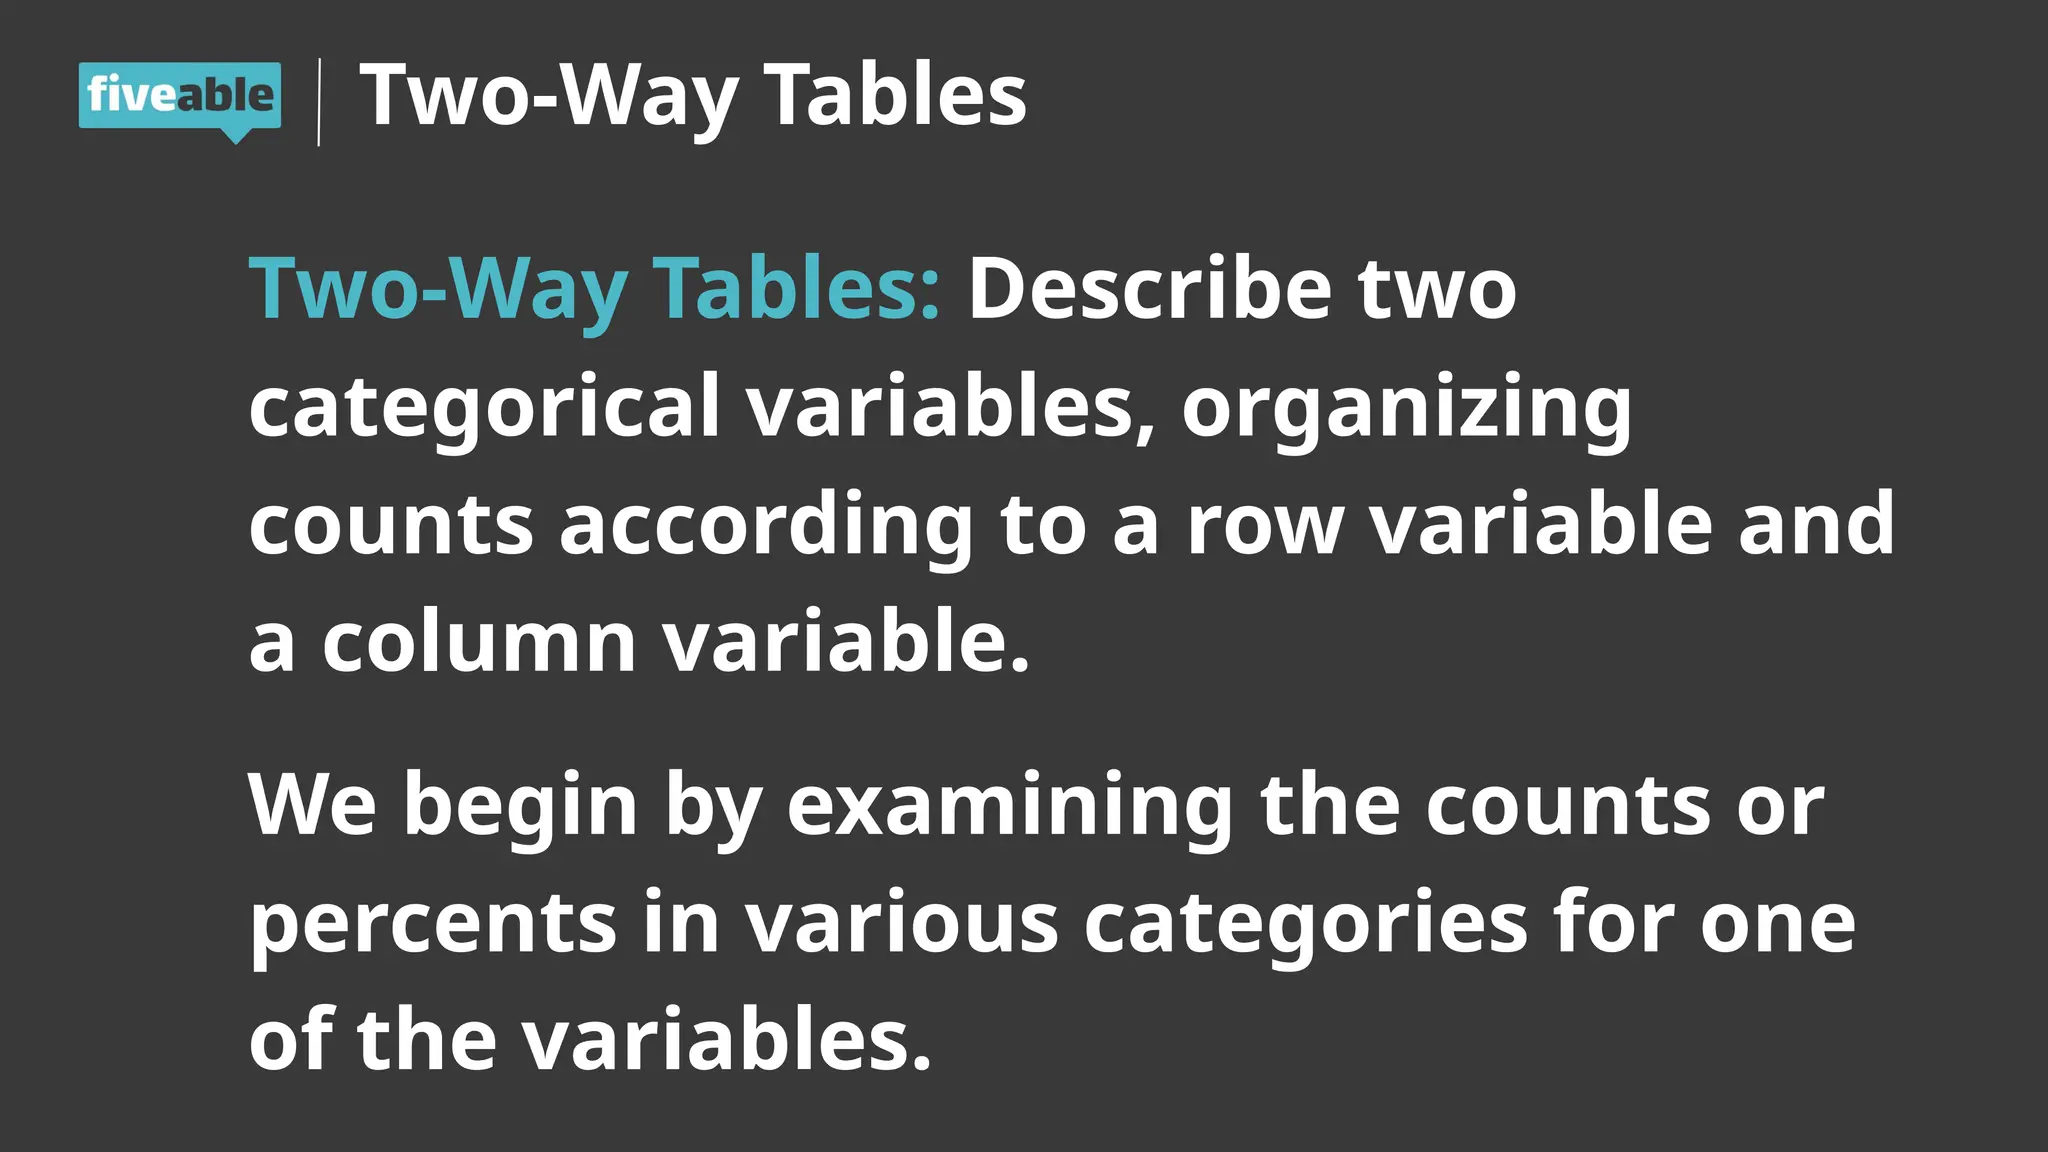
Two-Way Tables:Describe two
categorical variables, organizing
counts according to a row variable and
a column variable.
We begin by examining the counts or
percents in various categories for one
of the variables.
13.
in
this
stream
Two-Way
Tables
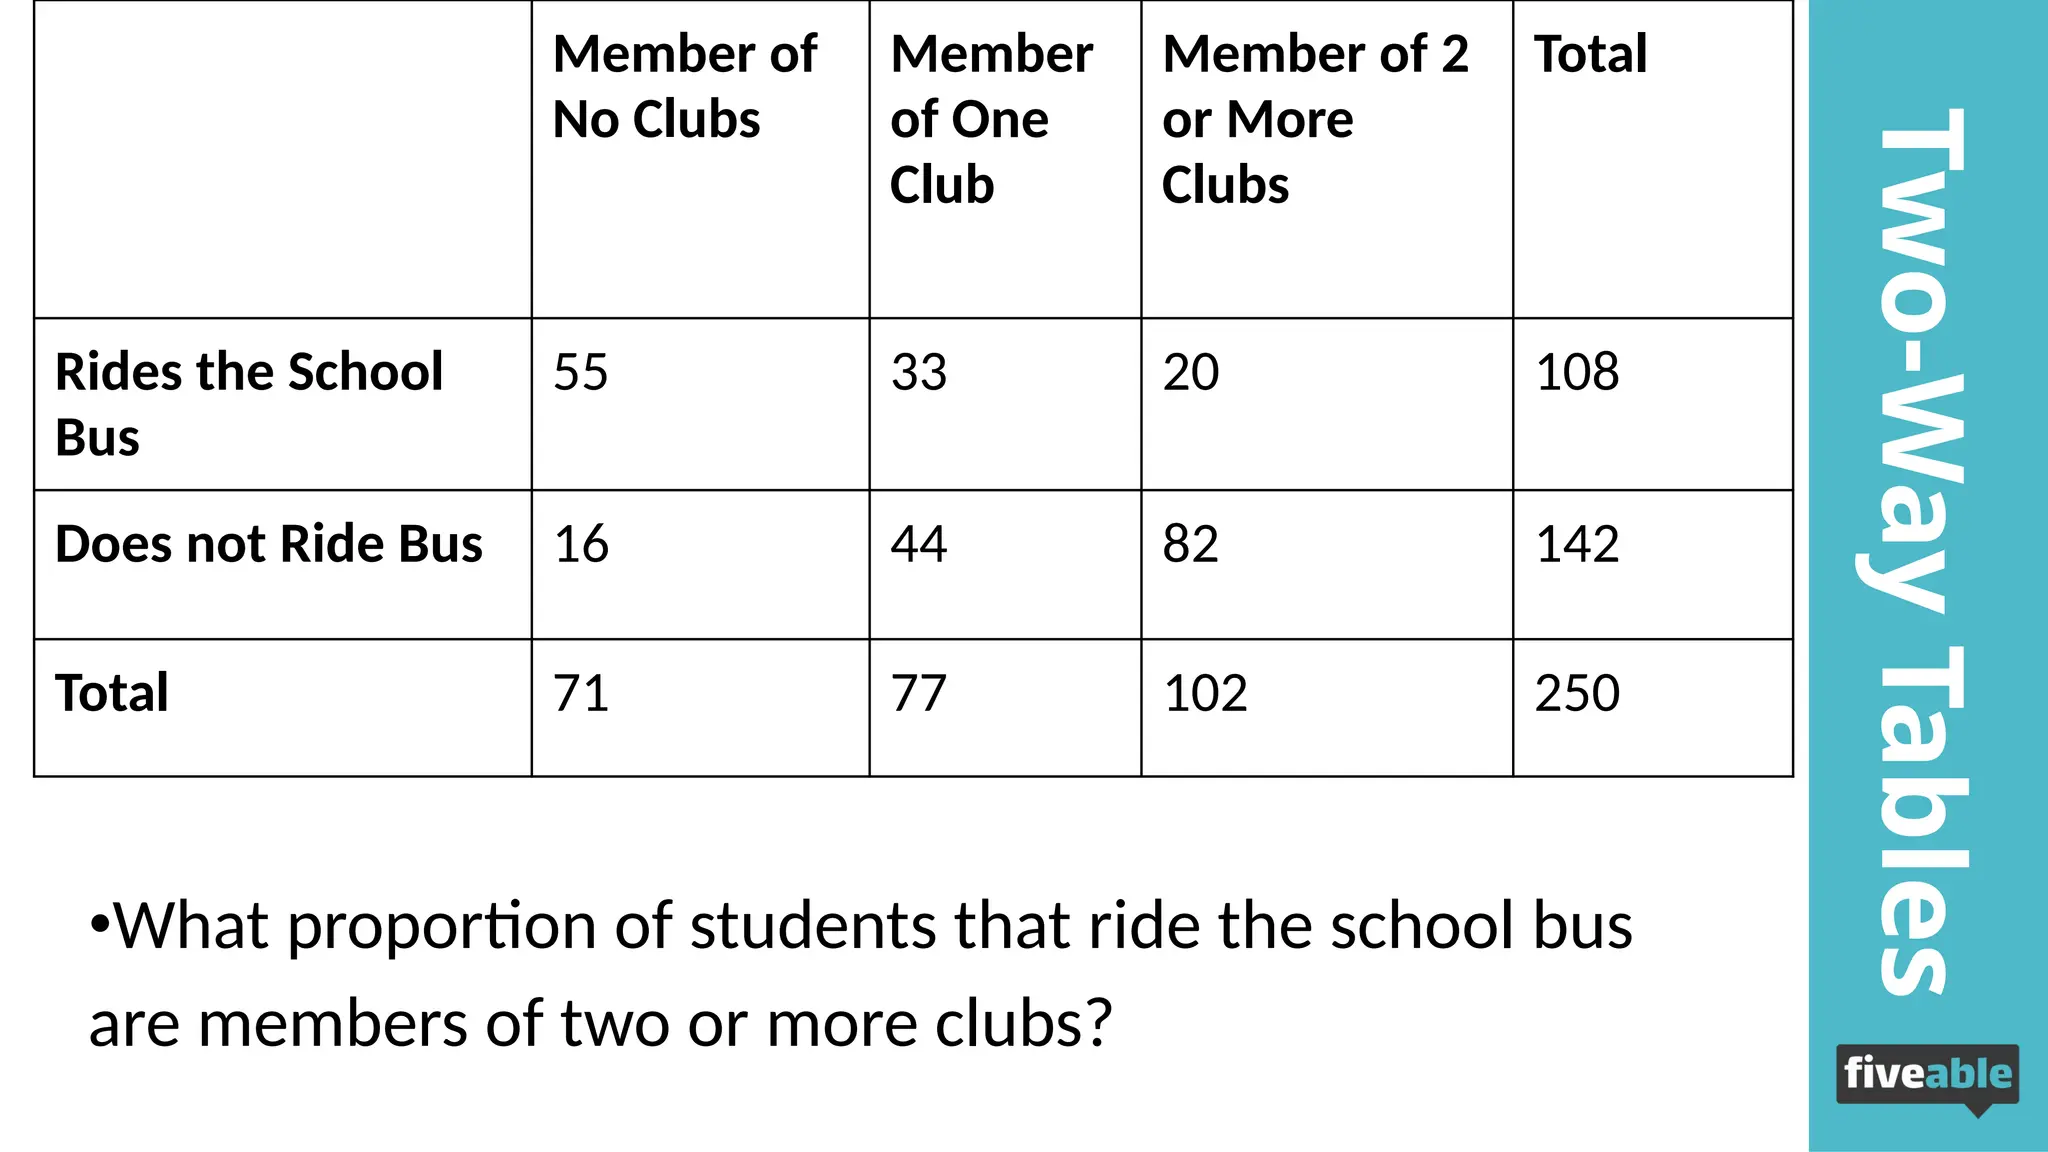
Member of
No Clubs
Member
ofOne
Club
Member of 2
or More
Clubs
Total
Rides the School
Bus
55 33 20 108
Does not Ride Bus 16 44 82 142
Total 71 77 102 250
•What proportion of students that ride the school bus
are members of two or more clubs?
14.
in
this
stream
Two-Way
Tables
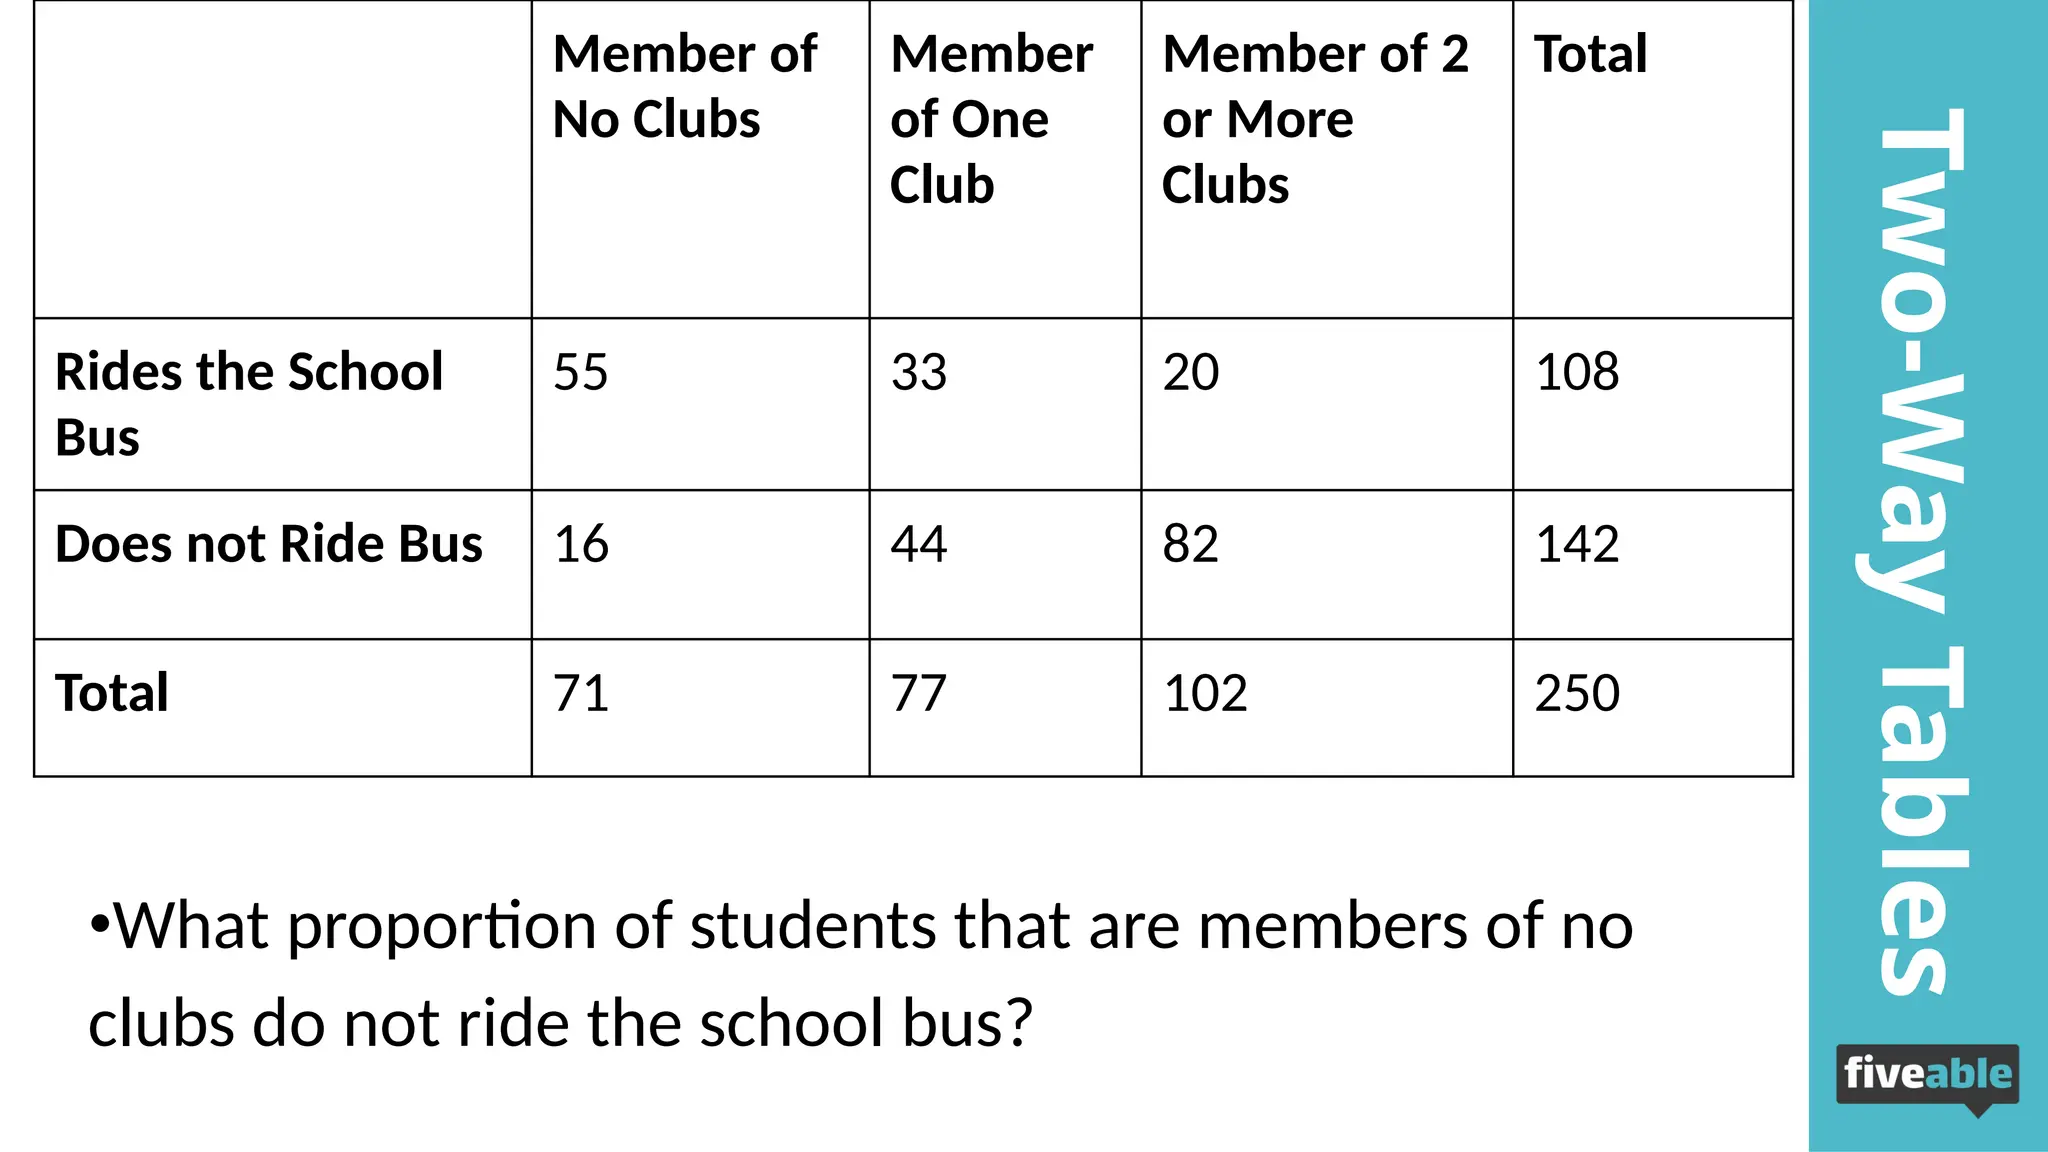
Member of
No Clubs
Member
ofOne
Club
Member of 2
or More
Clubs
Total
Rides the School
Bus
55 33 20 108
Does not Ride Bus 16 44 82 142
Total 71 77 102 250
•What proportion of students that are members of no
clubs do not ride the school bus?
15.
in
this
stream
Two-Way
Tables
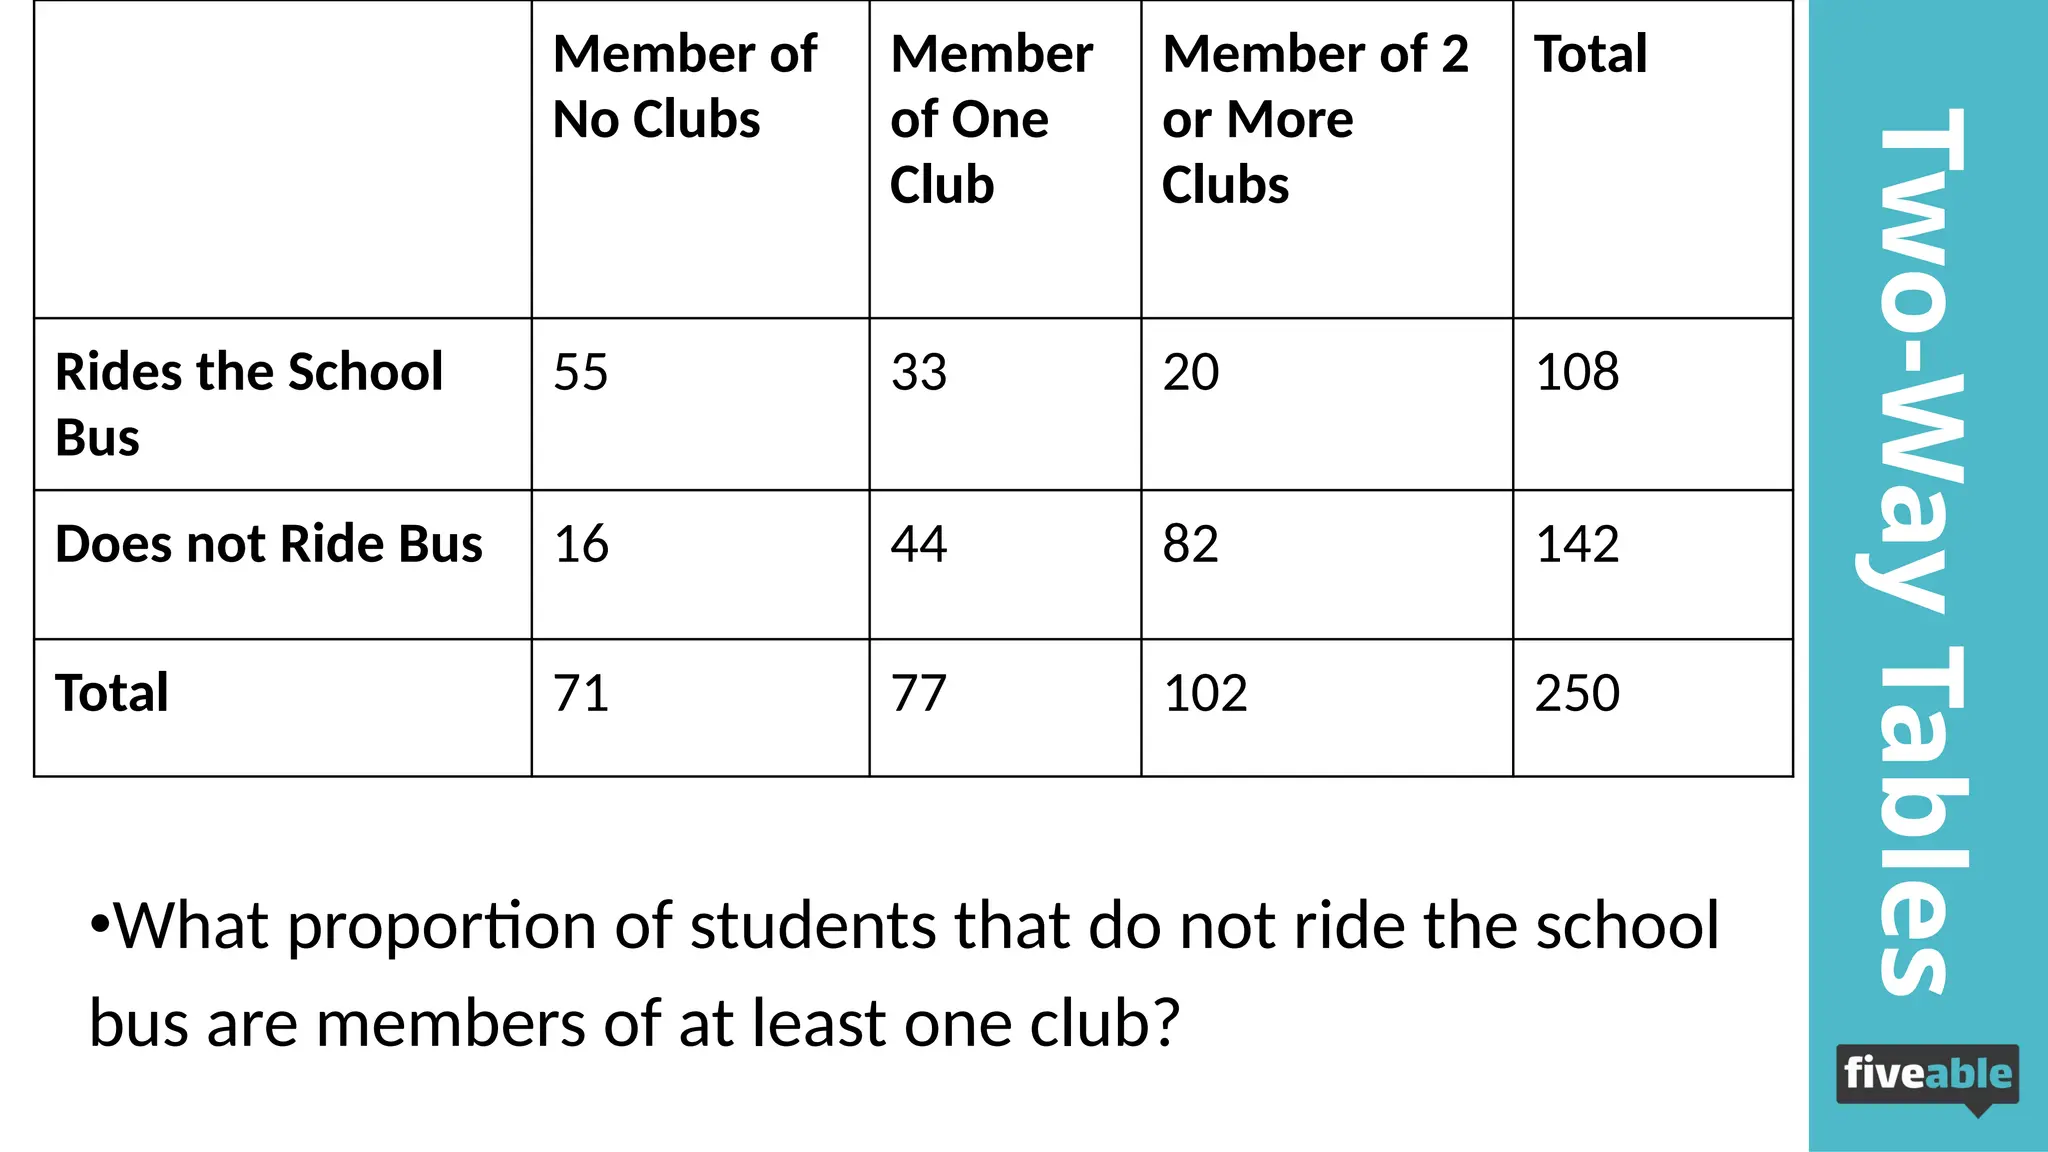
Member of
No Clubs
Member
ofOne
Club
Member of 2
or More
Clubs
Total
Rides the School
Bus
55 33 20 108
Does not Ride Bus 16 44 82 142
Total 71 77 102 250
•What proportion of students that do not ride the school
bus are members of at least one club?
#5 Our freemium subscription model means our content is accessible to all students. Basic live streams are free to attend while they are live. Access to premium live streams and our library of replays and resources cost $5/month for students and $25/mo for teachers.
#7 •The median of the distribution is 28.
•The distribution is skewed left.
#9 •The median of the distribution is 28.
•The distribution is skewed left.


![AP Stats Chapter 1 Exploring Data [Autosaved] (1).ppt](https://cdn.slidesharecdn.com/ss_thumbnails/apstatschapter1exploringdataautosaved1-240908213027-9f0b3ffa-thumbnail.jpg?width=640&height=640&fit=bounds)