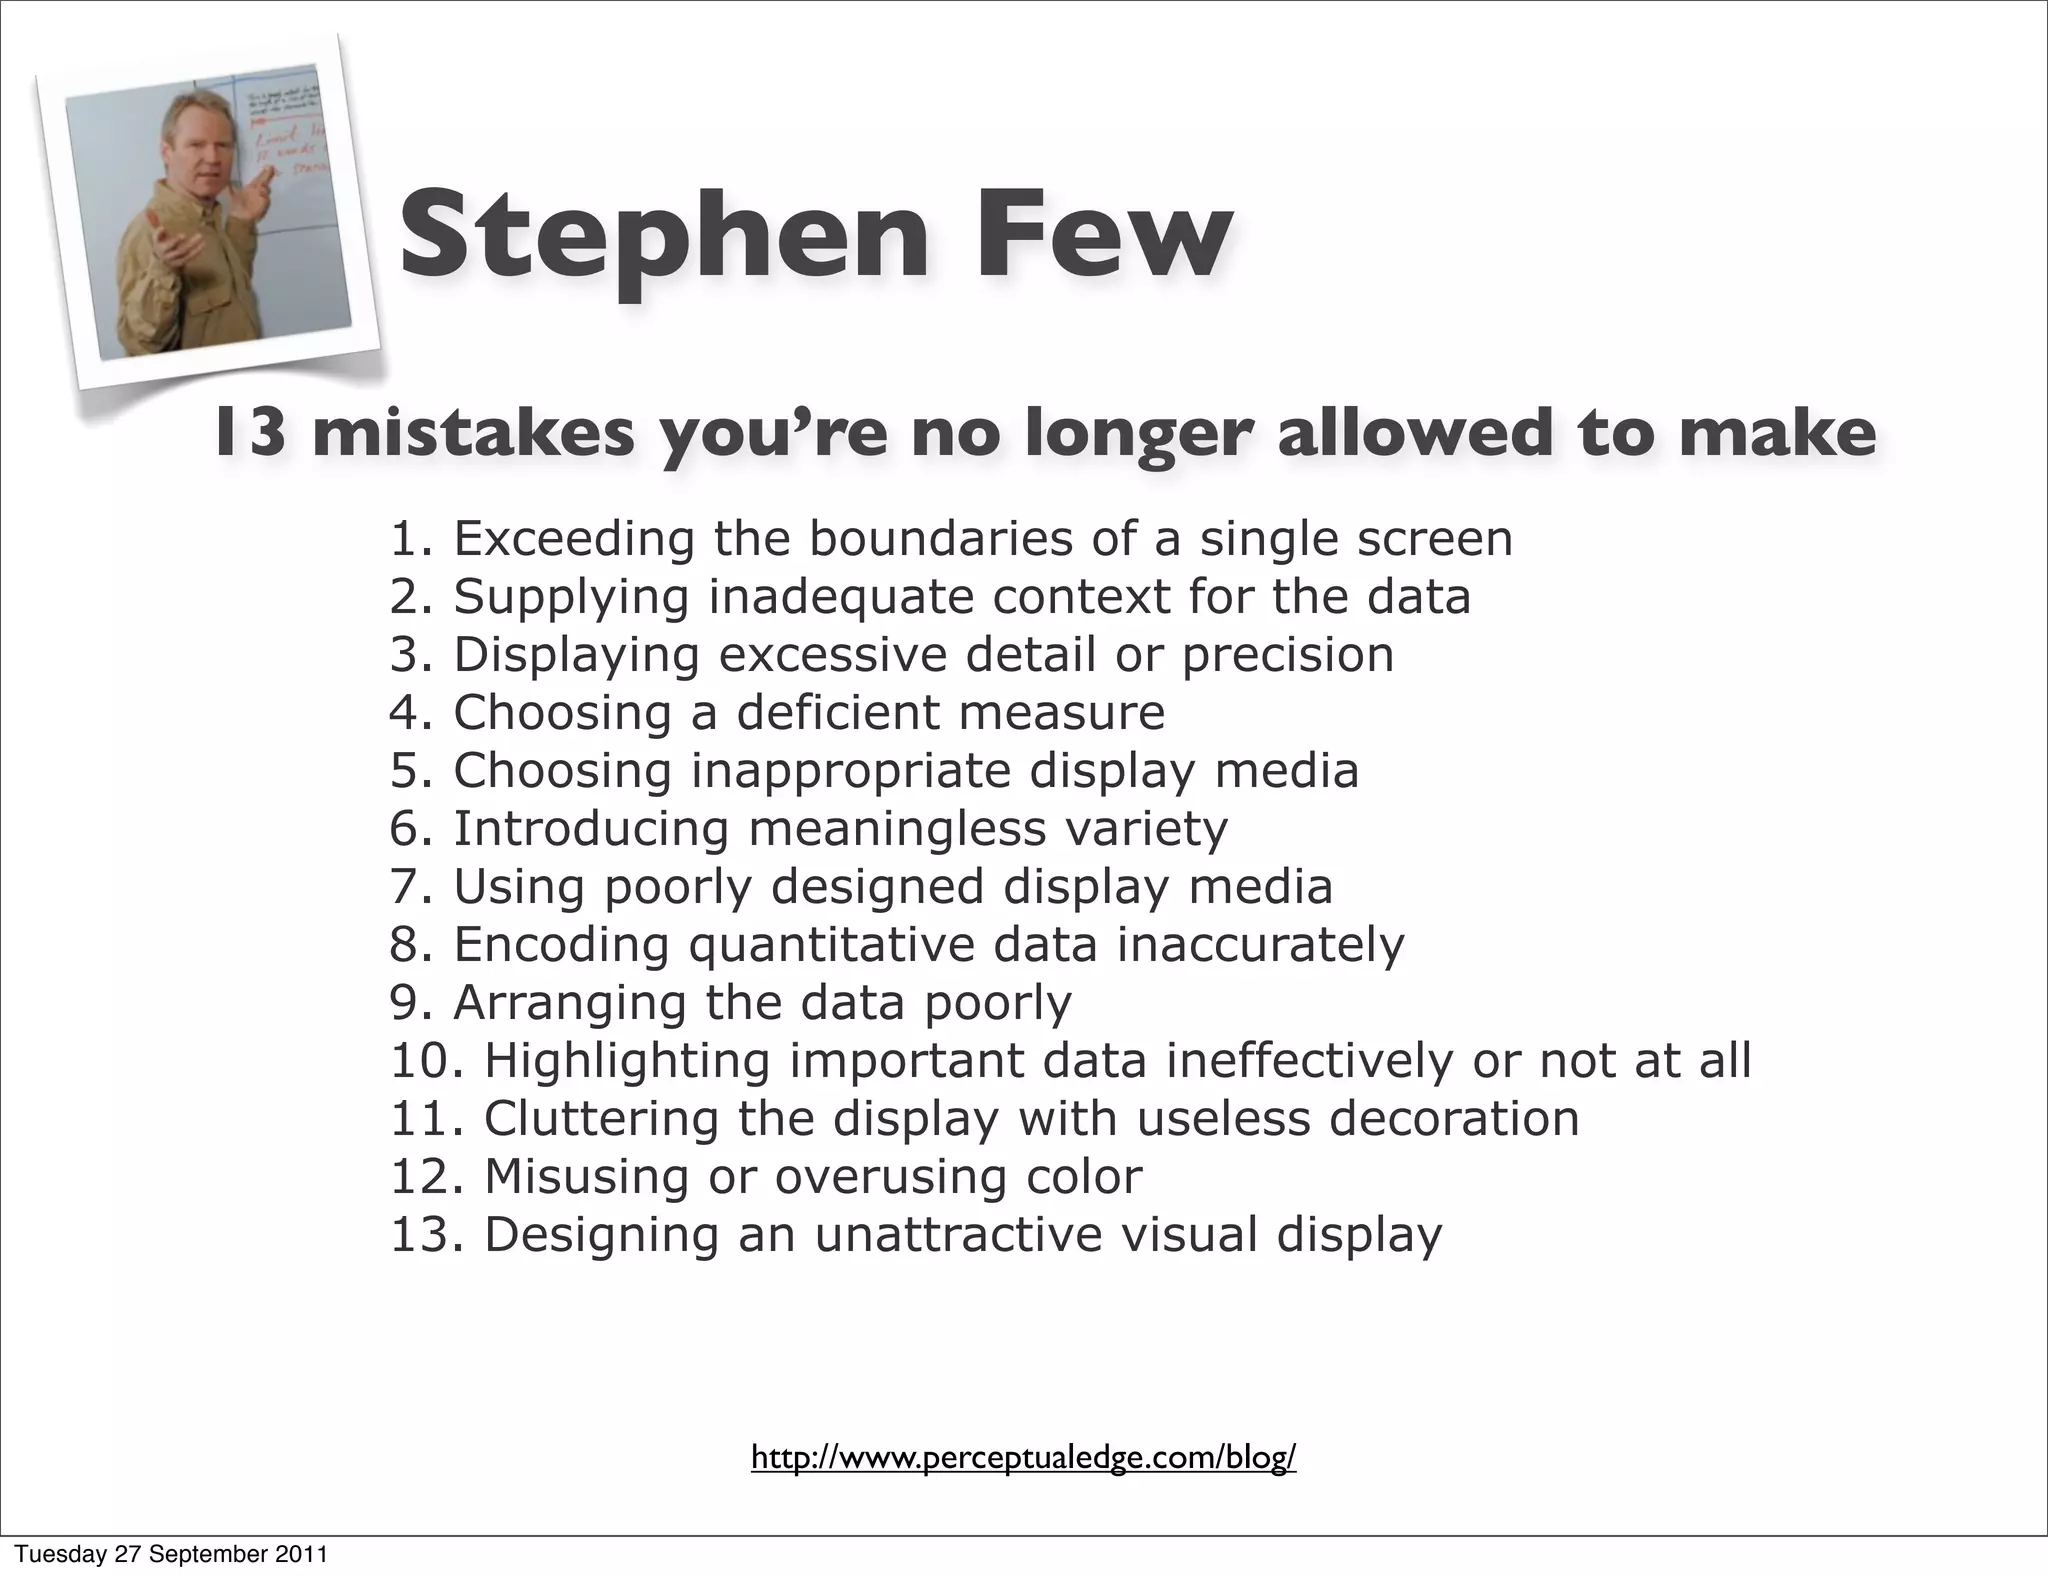
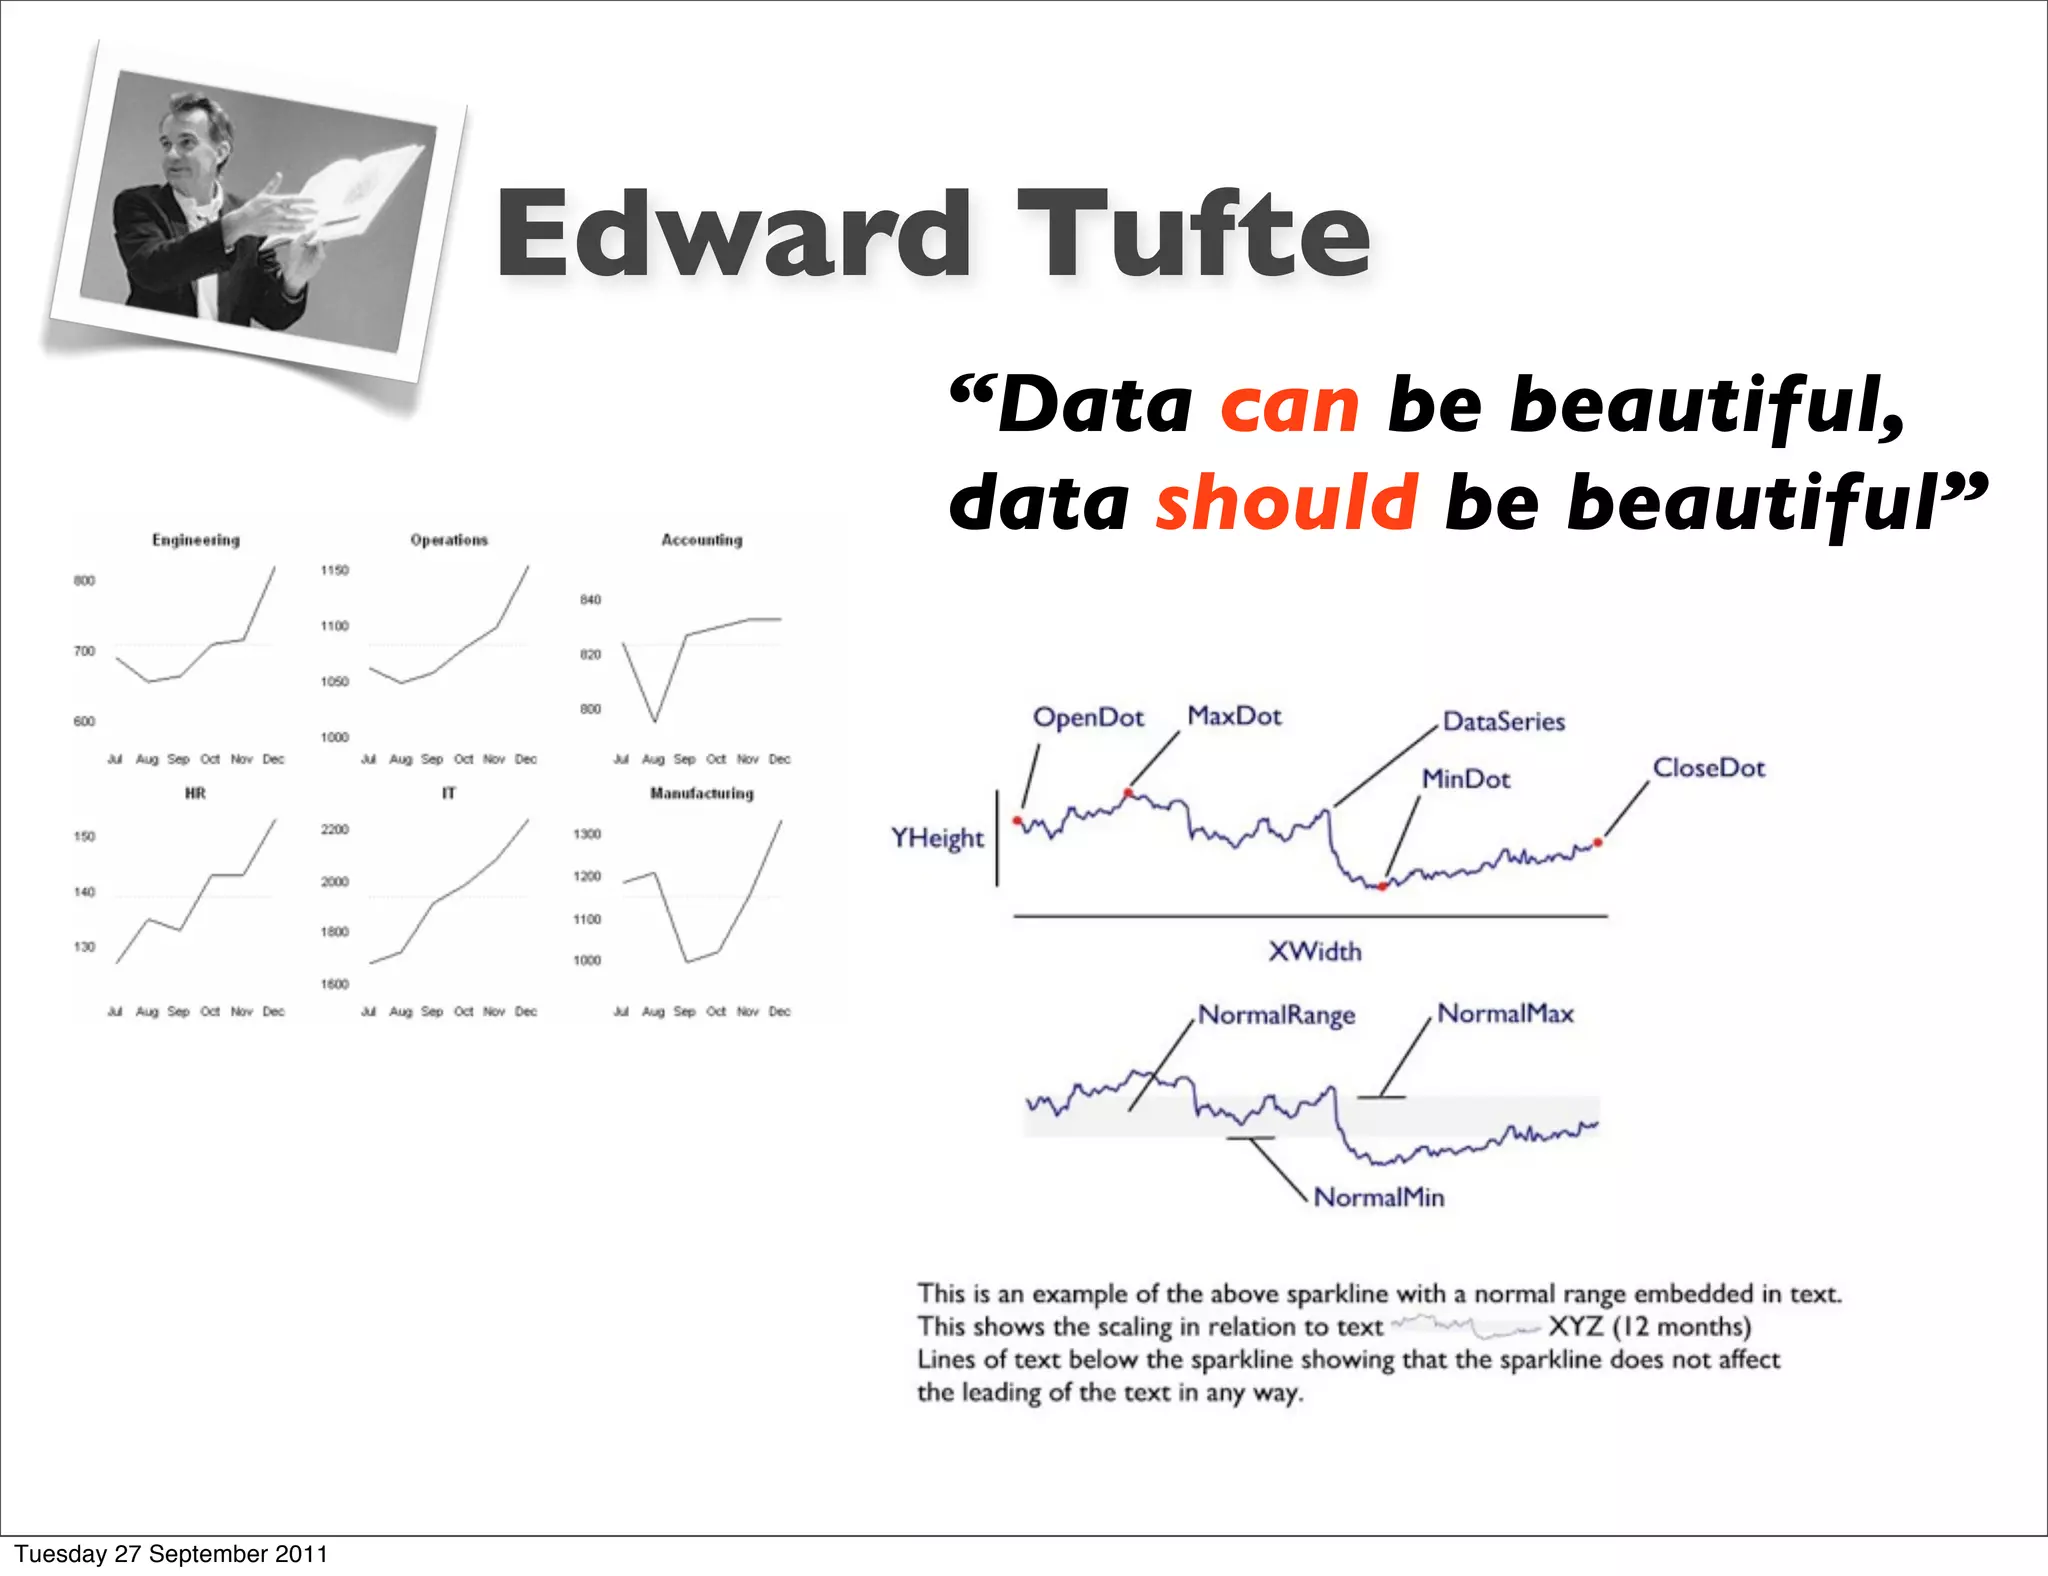
and suddenly I see ...
                            turning security data into information you can rely on.


                            wim remes
                            wremes@gmail.com
                            @wimremes


Tuesday 27 September 2011
about me ...


                                    information security manager
                                            big 4 company
                            incident response/security management/SIEM
                             [running in the 2011 (ISC)2 board elections]


Tuesday 27 September 2011
http://www.infosecmentors.com

                                           http://www.pentest-standard.org


                 http://www.eurotrashsecurity.eu


Tuesday 27 September 2011
BruCON

                 2009       2010     2011


Tuesday 27 September 2011
TOOLS


Tuesday 27 September 2011
Excel ...


                            http://peltiertech.com/WordPress/excel-chart-types/

Tuesday 27 September 2011
Taking the leap...


Tuesday 27 September 2011
MASTERS


Tuesday 27 September 2011
Edward Tufte


                       Stephen Few


Tuesday 27 September 2011
Stephen Few
               13 mistakes you’re no longer allowed to make
                            1. Exceeding the boundaries of a single screen
                            2. Supplying inadequate context for the data
                            3. Displaying excessive detail or precision
                            4. Choosing a deficient measure
                            5. Choosing inappropriate display media
                            6. Introducing meaningless variety
                            7. Using poorly designed display media
                            8. Encoding quantitative data inaccurately
                            9. Arranging the data poorly
                            10. Highlighting important data ineffectively or not at all
                            11. Cluttering the display with useless decoration
                            12. Misusing or overusing color
                            13. Designing an unattractive visual display


                                           http://www.perceptualedge.com/blog/

Tuesday 27 September 2011
Edward Tufte
                                  “Data can be beautiful,
                                  data should be beautiful”


Tuesday 27 September 2011
TIPS
                             and
                            TRICKS

Tuesday 27 September 2011
Infographs


                5   6       7   8 9 10   11   12 13


                 courtesy of ZoneAlarm (by Checkpoint)

Tuesday 27 September 2011
your favorite VM platform


                                                              Vulnerabilities by Severity Level

                                                          5

                                                          4

                                                          3

                                                          2

                                                          1

                                                              0      25      50      75     100


                                  compared to what ?
                                 last year? last month?


Tuesday 27 September 2011
GRC : Sponsored by Crayola   (tm)


Tuesday 27 September 2011
The dark side has ∏


Tuesday 27 September 2011
In other words ...

                                                                                                         DE


                            CN          US           NL            US           US           BE
                                                                              Great Lakes                KEYWEB
                            TimeNet   VolumeDrive   EuroAccess   RoadRunner               ISPSYSTEM-AS
                                                                                Comnet                     AS


Tuesday 27 September 2011
Or if you really want pie ...
                                          NL


                                 CN               BE


                                                   DE


                                         US


Tuesday 27 September 2011
Dashboarding 101


Tuesday 27 September 2011
Key take-aways


                1. Don’t rely on tools
                2. Think outside the box
                3. Simple = Better
                4. It’s not THAT hard


Tuesday 27 September 2011

And suddenly I see ... IDC IT Security Brussels 2011

  • 1.
    and suddenly Isee ... turning security data into information you can rely on. wim remes wremes@gmail.com @wimremes Tuesday 27 September 2011
  • 2.
    about me ... information security manager big 4 company incident response/security management/SIEM [running in the 2011 (ISC)2 board elections] Tuesday 27 September 2011
  • 3.
    http://www.infosecmentors.com http://www.pentest-standard.org http://www.eurotrashsecurity.eu Tuesday 27 September 2011
  • 4.
    BruCON 2009 2010 2011 Tuesday 27 September 2011
  • 5.
  • 6.
    Excel ... http://peltiertech.com/WordPress/excel-chart-types/ Tuesday 27 September 2011
  • 7.
    Taking the leap... Tuesday27 September 2011
  • 8.
  • 9.
    Edward Tufte Stephen Few Tuesday 27 September 2011
  • 10.
    Stephen Few 13 mistakes you’re no longer allowed to make 1. Exceeding the boundaries of a single screen 2. Supplying inadequate context for the data 3. Displaying excessive detail or precision 4. Choosing a deficient measure 5. Choosing inappropriate display media 6. Introducing meaningless variety 7. Using poorly designed display media 8. Encoding quantitative data inaccurately 9. Arranging the data poorly 10. Highlighting important data ineffectively or not at all 11. Cluttering the display with useless decoration 12. Misusing or overusing color 13. Designing an unattractive visual display http://www.perceptualedge.com/blog/ Tuesday 27 September 2011
  • 11.
    Edward Tufte “Data can be beautiful, data should be beautiful” Tuesday 27 September 2011
  • 12.
    TIPS and TRICKS Tuesday 27 September 2011
  • 13.
    Infographs 5 6 7 8 9 10 11 12 13 courtesy of ZoneAlarm (by Checkpoint) Tuesday 27 September 2011
  • 14.
    your favorite VMplatform Vulnerabilities by Severity Level 5 4 3 2 1 0 25 50 75 100 compared to what ? last year? last month? Tuesday 27 September 2011
  • 15.
    GRC : Sponsoredby Crayola (tm) Tuesday 27 September 2011
  • 16.
    The dark sidehas ∏ Tuesday 27 September 2011
  • 17.
    In other words... DE CN US NL US US BE Great Lakes KEYWEB TimeNet VolumeDrive EuroAccess RoadRunner ISPSYSTEM-AS Comnet AS Tuesday 27 September 2011
  • 18.
    Or if youreally want pie ... NL CN BE DE US Tuesday 27 September 2011
  • 19.
  • 20.
    Key take-aways 1. Don’t rely on tools 2. Think outside the box 3. Simple = Better 4. It’s not THAT hard Tuesday 27 September 2011