Anatomy & Physiology of Cardiac system with Cardiac Assessment- Diagnostic Investigation
•
28 likes•5,152 views

The cardiovascular system consists of the heart, which is an anatomical pump, with its intricate conduits (arteries, veins, and capillaries) that traverse the whole human body carrying blood. ... The pumping action of the heart usually maintains a balance between cardiac output and venous return.

Recommended
More Related Content
What's hot
What's hot (20)
Similar to Anatomy & Physiology of Cardiac system with Cardiac Assessment- Diagnostic Investigation
Similar to Anatomy & Physiology of Cardiac system with Cardiac Assessment- Diagnostic Investigation (20)
More from DR .PALLAVI PATHANIA
More from DR .PALLAVI PATHANIA (20)
Recently uploaded
Recently uploaded (20)
Anatomy & Physiology of Cardiac system with Cardiac Assessment- Diagnostic Investigation
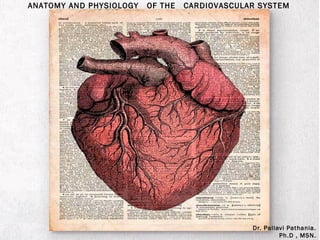
- 1. ANATOMY AND PHYSIOLOGY OF THE CARDIOVASCULAR SYSTEM Dr. Pallavi Pathania. Ph.D , MSN.
- 5. HEART LOCATED ON THE DIAPHRAGM NEAR THE MIDLINE OF THE THORACIC CAVITY
- 6. 6
- 7. 7 Overview The right side receives oxygen- poor blood from the body and tissues and then pumps it to the lungs to pick up oxygen and dispel carbon dioxide Its left side receives oxygenated blood returning from the lungs and pumps this blood throughout the body to supply oxygen and nutrients to the body tissues The heart=a muscular double pump with 2 functions
- 8. 8 Heart’s position in thorax In mediastinum – behind sternum and pointing left, lying on the diaphragm It weighs 250-350 gm (about 1 pound) Feel your heart beat at apex (this is of a person lying down)
- 9. 9 Location and Surface Projection The heart is hollow, cone-shaped, about the size of a closed fist . Lies in the mediastinum between the lungs and rests upon the diaphragm Two-thirds of its mass lies to the left of the midline Apex - lower, pointed end Base - broader, superior portion
- 10. 10 Heart’s position in thorax
- 11. 11 Layers of Heart Wall Pericardium - membrane (sac) that surrounds and protects the heart, it has two layers: (a) Fibrous pericardium - superficial layer, tough, inelastic, prevents overstretching, provides protection, and anchors the heart in place (b) Serous pericardium - deeper layer, thin; (i) parietal layer - fused to the fibrous pericardium, and (ii) visceral layer (or epicardium) adheres to the heart itself Pericardial cavity (between the two layers) is filled with pericardial fluid which reduces friction.
- 12. Layers of Heart Wall 12
- 13. PERICARDIUM 13
- 14. FIBROUS:THIN INELASTIC, DENSE IRREGULAR CONNECTIVE TISSUE ---HELPS IN PROTECTION, ANCHORS HEART TO MEDIASTINUM SEROUS: THINNER, MORE DELICATE DIVIDED INTO PARIETAL AND VISCERAL 14
- 15. EPICARDIUM: COMPOSED OF MESOTHELIUM AND DELICATE CONNECTIVE TISSUE (IMPARTS A SLIPPERY TEXTURE TO THE OUTER SURFACE OF THE HEART).
- 16. MYOCARDIUM:RESPONSIBLE FOR PUMPING ENDOCARDIUM: THIN LAYER OF ENDOTHELIUM WHICH IS CONTINOUS WITH THE LINING OF THE LARGE BLOOD VESSELS ATTACHED TO THE HEART. 16
- 17. CHAMBERS OF THE HEART
- 18. 18 Chambers of the heart Two atria Right atrium Left atrium Two ventricles Right ventricle Left ventricle --------------------------------------------------------------------------------
- 19. 19 Chambers of the heart divided by septae: Two atria-divided by interatrial septum Right atrium Left atrium Two ventricles-divided by interventricular septum Right ventricle Left ventricle
- 20. 20 Myocardial Thickness and Function The atria are thin-walled as they deliver blood under less pressure The ventricles have thick walls since they pump blood at a higher pressure and over greater distances The right and left ventricles eject equal amounts of blood The left ventricle is thicker because it pumps under higher pressure and over a greater distance than the right ventricle (Fig. 14.4c)
- 22. 22 Heart Valves - Atrioventricular The four valves prevent backflow of blood in the heart after blood passes through them Atrioventricular (AV) valves - tricuspid valve between the right atrium and the right ventricle - bicuspid (mitral) valve - between the left atrium and the left ventricle Chordae tendineae and associated papillary muscles permit flow but prevent backflow
- 23. 23 Heart Valves - Semilunar Two semilunar (SL) valves each having three semilunar cusps Allow ejection of blood from the ventricles into the pulmonary trunk and aorta Prevent backflow of blood into the heart Pulmonary valve - between the pulmonary trunk and the right ventricle Aortic valve - between the aorta and the left ventricle
- 24. 24
- 26. SYSTEMIC AND PULMONARY CIRCULATION LEFT SIDE IS A PUMP TO THE SYSTEMIC CIRCULATION. RIGHT SIDE IS A PUMP TO THE PULMONARY CIRCULATION.
- 27. 27 Circulation of Blood The heart pumps blood into two circuits arranged in series (connected end to end) Systemic circulation - left side of heart receives oxygenated blood from the lungs Pumps this blood into the aorta which branches into systemic arteries that carry blood to all organs except alveoli of the lungs Arteries branch into arterioles and eventually into systemic capillaries where nutrients, gases, wastes, etc. are exchanged with the surrounding cells; venules and subsequently systemic veins return the deoxygenated blood to the right atrium
- 28. 28 Circulation of Blood Pulmonary circulation - the right ventricle pumps blood into the pulmonary trunk which branches into the pulmonary arteries This blood goes to the pulmonary capillaries where the blood becomes oxygenated Pulmonary veins carry the oxygenated blood to the left atrium
- 29. 29
- 30. 30 Coronary (Cardiac) Circulation Two coronary arteries, the left and right coronary arteries branching from the ascending aorta supply the myocardium Left coronary artery divides into the anterior interventricular branch (or left anterior descending artery) and the circumflex branch Right coronary artery divides into the posterior interventricular branch and marginal branch
- 34. 34 Cardiac Conduction System Sinoatrial (SA) node - the heart’s natural pacemaker, initiates each heartbeat Other components of of the conduction system include: Atrioventricular (AV) node, Atrioventricular bundle or bundle of His, right and left bundle branches, Purkinje fibers The nervous system and certain hormones can alter the pace of contractions but the nervous system does not initiate contractions
- 35. 35 Electrical conduction system: specialized cardiac muscle cells that carry impulses throughout the heart musculature, signaling the chambers to contract in the proper sequence
- 38. 38 Conduction system SA node (sinoatrial) In wall of RA Sets basic rate: 70-80 Is the normal pacemaker Impulse from SA to atria Impulse also to AV node via internodal pathway AV node In interatrial septum
- 39. 39 Conduction continued SA node through AV bundle (bundle of His) Into interventricular septum Divides R and L bundle branches become subendocardial branches (“Purkinje fibers”) Contraction begins at apex
- 40. CARDIAC CYCLE
- 41. ATRIAL SYSTOLE LASTS FOR 0.1 SEC ATRIAL DEPOLARIZATION CAUSES ATRIAL SYSTOLE IT CONTRIBUTES A FINAL 25mL OF BLOOD TO EACH VENTRICLE END OF ATRIAL SYSTOLE IS ALSO END OF VENTRICULAR DIASTOLE END-DIASTOLIC VOLUME IS 130 mL
- 42. VENTRICULAR SYSTOLE LASTS FOR 0.3 SEC IT IS CAUSED BY VENTRICULAR DEPOLARIZATION ISOVOLUMETRIC CONTRACTION LASTS FOR 0.05 SECONDS WHEN BOTH THE SEMILUNAR AND ATRIOVENTRICULAR VLAVES ARE CLOSED.
- 43. THE SL VALVES OPEN WHEN -THE LEFT VENTRICULAR PRESSURES SURPASSES AORTIC PRESSURE(80 MM OF MERCURY) -THE RIGHT VENTRICULAR PRESSURE RISES ABOVE PULMONARY PRESSURE (20 mmHg) SL VALVES OPEN FOR 0.25 SEC
- 44. THE LEFT VENTRICLE EJECTS ABOUT 70 ML INTO THE AORTA THE RIGHT VENTRICLE EJECTS THE SAME VOLUME INTO THE PULMONARY TRUNK. END SYSTOLIC VOLUME IS 60mL IN EACH VENTRICLE .
- 45. Assessment of functions of heart and vascular system
- 66. HEART SOUNDS PRODUCED FROM BLOOD TURBULENCE CAUSED BY CLOSING OF HEART VALVES S1 – ATRIOVENTRICULAR VALVE CLOSURE S2 – SEMILUNAR VALVE CLOSURE S3- RAPID VENTRICULER FILLING S4- ATRIAL SYSTOLE
- 72. CARDIAC OUTPUT CO = SV X HR FOR A RESTING ADULT CO = 70mL/beat x75beats/min = 5250 mL/min = 5.25 L/min mL/min mL/beat (Beats/min)
- 73. HEMODYNAMIC MONITORING OF HEART
- 78. Hemodynamic monitoring refers to measurement of pressure, flow and oxygenation of blood within the cardiovascular system. Hemodynamic monitoring measures the blood pressure inside the veins, heart, and arteries. It also measures blood flow and how much oxygen is in the blood. It is a way to see how well the heart is working. Hemodynamic monitoring plays an important role in the management of today's acutely ill patient. ... Current hemodynamic monitoring therefore includes measurement of heart rate, arterial pressure, cardiac filling pressures or volumes, cardiac output, and mixed venous oxygen saturation (SvO2).
- 79. WHAT IS HEMODYNAMIC MONITORING? Hemodynamic monitoring measures the blood pressure inside the veins, heart, and arteries. It also measures blood flow and how much oxygen is in the blood. It is a way to see how well the heart is working. WHEN IS IT DONE? Many treatments depend on seeing small changes in the way the heart is working. These changes happen first deep inside the body. It may take time for these changes to show at the body surface, where they can be observed more easily. Hemodynamic monitoring can detect these changes early by testing samples of blood from deep inside the body. Hemodynamic monitoring helps your healthcare provider know if you will need blood or fluid transfusions. It shows whether the lungs are getting enough oxygen. It checks how well the heart is pumping by measuring the total blood flow per minute. This test may be done, for example, if you are in intensive care recovering from a heart attack or if you have fluid around your heart.
- 81. Pulmonary Artery Pressure (PAP) - Hemodynamic Monitoring - Getting Started. Hemodynamic Monitoring - The pulmonary artery pressure (PAP) is generally 25/10 mm Hg (since the pulmonary vasculature is normally low resistance system). The pulmonary artery pressure (PAP) is helpful in diagnosing many clinical conditions. The primary hemodynamic parameters include heart rate (HR) and blood pressure (BP), while the advanced hemodynamic parameters include stroke volume (SV), cardiac output (CO), and total peripheral resistance (TPR) [14].
- 82. CVP
- 83. Central venous pressure is a measure of pressure in the superior vena cava which can be used as an estimation of preload and right atrial pressure. Central venous pressure is often used as an assessment of hemodynamic in a patient, particularly in intensive care units. The central venous pressure can be measured using a central venous catheter placed in the superior vena cava near the right atrium. A normal central venous pressure reading is between 8 to 12 mmHg. This value can be changed depending on a patient’s volume status or venous compliance. Central venous pressure (CVP), an estimate of right atrial pressure, has been used to assess cardiac preload and volume status in critically ill patients, assist in the diagnosis of right-sided heart failure, and guide fluid resuscitation. It is determined by the interaction between cardiac function and venous return. CVP measurements are relatively easy to obtain; however, because of the complex relationship between CVP, cardiac output, and the vascular system, they may be difficult to interpret.
- 85. The central venous pressure (CVP) is the pressure measured in the central veins close to the heart. It indicates mean right atrial pressure and is frequently used as an estimate of right ventricular preload. The CVP does not measure blood volume directly, although it is often used to estimate this. Pulmonary blood pressure is normally a lot lower than systemic blood pressure. Normal pulmonary artery pressure is 8-20 mm Hg at rest. If the pressure in the pulmonary artery is greater than 25 mm Hg at rest or 30 mmHg during physical activity, it is abnormally high and is called pulmonary hypertension.
- 89. PAP
- 98. OTHER BLOOD TEST
- 105. CHEST X RAY
- 106. Chest x-ray uses a very small dose of ionizing radiation to produce pictures of the inside of the chest. It is used to evaluate the lungs, heart and chest wall and may be used to help diagnose shortness of breath, persistent cough, fever, chest pain or injury. It also may be used to help diagnose and monitor treatment for a variety of lung conditions such as pneumonia, emphysema and cancer. Because chest x-ray is fast and easy, it is particularly useful in emergency diagnosis and treatment.
- 107. X-rays are a form of radiation like light or radio waves. X-rays pass through most objects, including the body. Once it is carefully aimed at the part of the body being examined, an x-ray machine produces a small burst of radiation that passes through the body, recording an image on photographic film or a special detector. Different parts of the body absorb the x-rays in varying degrees. Dense bone absorbs much of the radiation while soft tissue, such as muscle, fat and organs, allow more of the x-rays to pass through them. As a result, bones appear white on the x-ray, soft tissue shows up in shades of gray and air appears black. On a chest x-ray, the ribs and spine will absorb much of the radiation and appear white or light gray on the image. Lung tissue absorbs little radiation and will appear dark on the image. Until recently, x-ray images were maintained on large film sheets (much like a large photographic negative). Today, most images are digital files that are stored electronically. These stored images are easily accessible for diagnosis and disease management.
- 110. MRI
- 111. Magnetic resonance imaging (MRI) is a type of scan that uses strong magnetic fields and radio waves to produce detailed images of the inside of the body. An MRI scanner is a large tube that contains powerful magnets. You lie inside the tube during the scan. An MRI scan can be used to examine almost any part of the body, including the: brain and spinal cord bones and joints breasts heart and blood vessels internal organs, such as the liver, womb or prostate gland The results of an MRI scan can be used to help diagnose conditions, plan treatments and assess how effective previous treatment has been.
- 112. Most of the human body is made up of water molecules, which consist of hydrogen and oxygen atoms. At the centre of each hydrogen atom is an even smaller particle called a proton. Protons are like tiny magnets and are very sensitive to magnetic fields. When you lie under the powerful scanner magnets, the protons in your body line up in the same direction, in the same way that a magnet can pull the needle of a compass. Short bursts of radio waves are then sent to certain areas of the body, knocking the protons out of alignment. When the radio waves are turned off, the protons realign. This sends out radio signals, which are picked up by receivers. These signals provide information about the exact location of the protons in the body. They also help to distinguish between the various types of tissue in the body, because the protons in different types of tissue realign at different speeds and produce distinct signals. In the same way that millions of pixels on a computer screen can create complex pictures, the signals from the millions of protons in the body are combined to create a detailed image of the inside of the body.
- 113. NMRI { Nuclear magnetic resonance imaging.}
- 115. Cardiac stress test/ TRADE MILL STRESS TESTING
- 116. A stress test, also called an exercise stress test, shows how your heart works during physical activity. Because exercise makes your heart pump harder and faster, an exercise stress test can reveal problems with blood flow within your heart. A stress test usually involves walking on a treadmill or riding a stationary bike your heart rhythm, blood pressure and breathing are monitored. Or you'll receive a drug that mimics the effects of exercise. Doctor may recommend a stress test if you have signs or symptoms of coronary artery disease or an irregular heart rhythm (arrhythmia). The test may also guide treatment decisions, measure the effectiveness of treatment or determine the severity if you've already been diagnosed with a heart condition.
- 117. BRONCHOSCOPY
- 118. Bronchoscopy is a procedure that lets doctors look at your lungs and air passages. It's usually performed by a doctor who specializes in lung disorders (a pulmonologist). During bronchoscopy, a thin tube (bronchoscope) is passed through your nose or mouth, down your throat and into your lungs. Bronchoscopy is most commonly performed using a flexible bronchoscope. However, in certain situations, such as if there's a lot of bleeding in your lungs or a large object is stuck in your airway, a rigid bronchoscope may be needed. Common reasons for needing bronchoscopy are a persistent cough, infection or something unusual seen on a chest X-ray or other test. Bronchoscopy can also be used to obtain samples of mucus or tissue, to remove foreign bodies or other blockages from the airways or lungs, or to provide treatment for lung problems.
- 119. Bronchoscopy is usually done to find the cause of a lung problem. For example, your doctor might refer you for bronchoscopy because you have a persistent cough or an abnormal chest X-ray. Reasons for doing bronchoscopy include: Diagnosis of a lung problem Identification of a lung infection Biopsy of tissue from the lung Removal of mucus, a foreign body, or other obstruction in the airways or lungs, such as a tumor Placement of a small tube to hold open an airway (stent) Treatment of a lung problem (interventional bronchoscopy), such as bleeding, an abnormal narrowing of the airway (stricture) or a collapsed lung (pneumothorax) During some procedures, special devices may be passed through the bronchoscope, such as a tool to obtain a biopsy, an electrocautery probe to control bleeding or a laser to reduce the size of an airway tumor. Special techniques are used to guide the collection of biopsies to ensure the desired area of the lung is sampled. In people with lung cancer, a bronchoscope with a built-in ultrasound probe may be used to check the lymph nodes in the chest. This is called endobronchial ultrasound (EBUS) and helps doctors determine the appropriate treatment. EBUS may be used for other types of cancer to determine if the cancer has spread.
- 122. PFT SPIROMETERY
- 123. Pulmonary function tests (PFTs) are non invasive tests that show how well the lungs are working. The tests measure lung volume, capacity, rates of flow, and gas exchange. This information can help your healthcare provider diagnose and decide the treatment of certain lung disorders. There are 2 types of disorders that cause problems with air moving in and out of the lungs: Obstructive. This is when air has trouble flowing out of the lungs due to airway resistance. This causes a decreased flow of air. Restrictive. This is when the lung tissue and/or chest muscles can’t expand enough. This creates problems with air flow, mostly due to lower lung volumes. PFT can be done with 2 methods. These 2 methods may be used together and perform different tests, depending on the information that your healthcare provider is looking for: Spirometry. A spirometer is a device with a mouthpiece hooked up to a small electronic machine. Plethysmography. You sit or stand inside an air-tight box that looks like a short, square telephone booth to do the tests. PFT measures: Tidal volume (VT). This is the amount of air inhaled or exhaled during normal breathing. Minute volume (MV). This is the total amount of air exhaled per minute. Vital capacity (VC). This is the total volume of air that can be exhaled after inhaling as much as you can.
- 125. Functional residual capacity (FRC). This is the amount of air left in lungs after exhaling normally. Residual volume. This is the amount of air left in the lungs after exhaling as much as you can. Total lung capacity. This is the total volume of the lungs when filled with as much air as possible. Forced vital capacity (FVC). This is the amount of air exhaled forcefully and quickly after inhaling as much as you can. Forced expiratory volume (FEV). This is the amount of air expired during the first, second, and third seconds of the FVC test. Forced expiratory flow (FEF). This is the average rate of flow during the middle half of the FVC test. Peak expiratory flow rate (PEFR). This is the fastest rate that you can force air out of your lungs. Normal values for PFTs vary from person to person. The amount of air inhaled and exhaled in your test results are compared to the average for someone of the same age, height, sex, and race. Results are also compared to any of your previous test results. If you have abnormal PFT measurements or if your results have changed, you may need other tests.
- 128. ECG
- 130. Electrocardiography is the process of producing an electrocardiogram (ECG or EKG), a recording - a graph of voltage versus time - of the electrical activity of the heartusing electrodes placed on the skin. These electrodes detect the small electrical changes that are a consequence of cardiac muscle depolarization followed by repolarization during each cardiac cycle (heartbeat). Changes in the normal ECG pattern occur in numerous cardiac abnormalities, including cardiac rhythm disturbances (such as atrial fibrillation and ventricular tachycardia), inadequate coronary artery blood flow (such as myocardial ischemia and myocardial infarction), and electrolyte disturbances (such as hypokalemia and hyperkalemia). In a conventional 12-lead ECG, ten electrodes are placed on the patient's limbs and on the surface of the chest. The overall magnitude of the heart's electrical potential is then measured from twelve different angles ("leads") and is recorded over a period of time (usually ten seconds). In this way, the overall magnitude and direction of the heart's electrical depolarization is captured at each moment throughout the cardiac cycle. There are three main components to an ECG: the P wave, which represents the depolarization of the atria; the QRS complex, which represents the depolarization of the ventricles; and the T wave, which represents the repolarization of the ventricles.
- 131. During each heartbeat, a healthy heart has an orderly progression of depolarization that starts with pacemaker cells in the sinoatrial node, spreads throughout the atrium, passes through the atrioventricular node down into the bundle of His and into the Purkinje fibers, spreading down and to the left throughout the ventricles. This orderly pattern of depolarization gives rise to the characteristic ECG tracing. To the trained clinician, an ECG conveys a large amount of information about the structure of the heart and the function of its electrical conduction system. Among other things, an ECG can be used to measure the rate and rhythm of heartbeats, the size and position of the heart chambers, the presence of any damage to the heart's muscle cells or conduction system, the effects of heart drugs, and the function of implanted pacemakers
- 132. Electrodes are the actual conductive pads attached to the body surface.Any pair of electrodes can measure the electrical potential difference between the two corresponding locations of attachment. Such a pair forms a lead. However, "leads" can also be formed between a physical electrode and a virtual electrode, known as the Wilson's central terminal, whose potential is defined as the average potential measured by three limb electrodes that are attached to the right arm, the left arm, and the left foot, respectively. Commonly, 10 electrodes attached to the body are used to form 12 ECG leads, with each lead measuring a specific electrical potential difference (as listed in the table below).[22] Leads are broken down into three types: limb; augmented limb; and precordial or chest. The 12- lead ECG has a total of three limb leads and three augmented limb leads arranged like spokes of a wheel in the coronal plane (vertical), and six precordial leads or chest leads that lie on the perpendicular transverse plane (horizontal). In medical settings, the term leads is also sometimes used to refer to the electrodes themselves, although this is technically incorrect. This misuse of terminology can be the source of confusion. The 10 electrodes in a 12-lead ECG are listed below. Two types of electrodes in common use are a flat paper-thin sticker and a self-adhesive circular pad. The former are typically used in a single ECG recording while the latter are for continuous recordings as they stick longer. Each electrode consists of an electrically conductive electrolyte gel and a silver/silver chlorideconductor The gel typically contains potassium chloride – sometimes silver chloride as well – to permit electron conduction from the skin to the wire and to the electrocardiogram. The common virtual electrode, known as the Wilson's central terminal (VW ), is produced by averaging the measurements from the electrodes RA, LA, and LL to give an average potential of the body: In a 12-lead ECG, all leads except the limb leads are unipolar (aVR, aVL, aVF, V1 , V2 , V3 , V4 , V5 , and V6 ). The measurement of a voltage requires two contacts and so, electrically, the unipolar leads are measured from the common lead (negative) and the unipolar lead (positive). This averaging for the common lead and the abstract unipolar lead concept makes for a more challenging understanding and is complicated by sloppy usage of "lead" and "electrode".
- 133. Electrode name Electrode placement RA On the right arm, avoiding thick muscle. LA In the same location where RA was placed, but on the left arm. RL On the right leg, lower end of inner aspect of calf muscle. (Avoid bony prominences) LL In the same location where RL was placed, but on the left leg. V1 In the fourth intercostal space (between ribs 4 and 5) just to the right of the sternum (breastbone). V2 In the fourth intercostal space (between ribs 4 and 5) just to the left of the sternum. V3 Between leads V2 and V4. V4 In the fifth intercostal space (between ribs 5 and 6) in the mid-clavicular line. V5 Horizontally even with V4, in the left anterior axillary line. V6 Horizontally even with V4 and V5 in the mid-axillary line.
- 135. Background grid ECGs are normally printed on a grid. The horizontal axis represents time and the vertical axis represents voltage. The standard values on this grid are shown in the adjacent image: •A small box is 1 mm × 1 mm and represents 0.1 mV × 0.04 seconds. •A large box is 5 mm × 5 mm and represents 0.5 mV × 0.20 seconds. The "large" box is represented by a heavier line weight than the small boxes. Not all aspects of an ECG rely on precise recordings or having a known scaling of amplitude or time. For example, determining if the tracing is a sinus rhythm only requires feature recognition and matching, and not measurement of amplitudes or times (i.e., the scale of the grids are irrelevant). An example to the contrary, the voltage requirements of left ventricular hypertrophy require knowing the grid scale.
- 137. Rate and rhythm[edit] In a normal heart, the heart rate is the rate in which the sinoatrial node depolarizes as it is the source of depolarization of the heart. Heart rate, like other vital signs like blood pressure and respiratory rate, change with age. In adults, a normal heart rate is between 60 and 100 bpm (normocardic) where in children it is higher. A heart rate less than normal is called bradycardia (<60 in adults) and higher than normal is tachycardia (>100 in adults). A complication of this is when the atria and ventricles are not in synchrony and the "heart rate" must be specified as atrial or ventricular (e.g., the ventricular rate in ventricular fibrillation is 300–600 bpm, whereas the atrial rate can be normal [60–100] or faster [100– 150]). In normal resting hearts, the physiologic rhythm of the heart is normal sinus rhythm (NSR). Normal sinus rhythm produces the prototypical pattern of P wave, QRS complex, and T wave. Generally, deviation from normal sinus rhythm is considered a cardiac arrhythmia. Thus, the first question in interpreting an ECG is whether or not there is a sinus rhythm. A criterion for sinus rhythm is that P waves and QRS complexes appear 1-to-1, thus implying that the P wave causes the QRS complex. Once sinus rhythm is established, or not, the second question is the rate. For a sinus rhythm this is either the rate of P waves or QRS complexes since they are 1-to-1. If the rate is too fast then it is sinus tachycardia and if it is too slow then it is sinus bradycardia. If it is not a sinus rhythm, then determining the rhythm is necessary before proceeding with further interpretation. Some arrhythmias with characteristic findings: Absent P waves with "irregularly irregular" QRS complexes is the hallmark of atrial fibrillation A "saw tooth" pattern with QRS complexes is the hallmark of atrial flutter Sine wave pattern is the hallmark of ventricular flutter Absent P waves with wide QRS complexes and a fast heart rate is ventricular tachycardia Determination of rate and rhythm is necessary in order to make sense of further interpretation.
- 142. Interpretation of the ECG is fundamentally about understanding the electrical conduction system of the heart. Normal conduction starts and propagates in a predictable pattern, and deviation from this pattern can be a normal variation or be pathological. An ECG does not equate with mechanical pumping activity of the heart, for example, pulseless electrical activity produces an ECG that should pump blood but no pulses are felt (and constitutes a medical emergency and CPR should be performed). Ventricular fibrillation produces an ECG but is too dysfunctional to produce a life-sustaining cardiac output. Certain rhythms are known to have good cardiac output and some are known to have bad cardiac output. Ultimately, an echocardiogram or other anatomical imaging modality is useful in assessing the mechanical function of the heart. Like all medical tests, what constitutes "normal" is based on population studies. The heart rate range of between 60 and 100 beats per minute (bpm) is considered normal since data shows this to be the usual resting heart rate.
- 143. Classification Angle Notes Normal −30° to 105° Normal Left axis deviation −30° to −90° May indicate left ventricular hypertrophy, left anterior fascicular block, or an old inferior STEMI Right axis deviation +105° to +180° May indicate right ventricular hypertrophy, left posterior fascicular block, or an old lateral STEMI Indeterminate axis +180° to −90° Rarely seen; considered an 'electrical no-man's land' Axis: The heart has several axes, but the most common by far is the axis of the QRS complex (references to "the axis" imply the QRS axis). Each axis can be computationally determined to result in a number representing degrees of deviation from zero, or it can be categorized into a few types. The QRS axis is the general direction of the ventricular depolarization wave front (or mean electrical vector) in the frontal plane. It is often sufficient to classify the axis as one of three types: normal, left deviated, or right deviated. Population data shows that a normal QRS axis is from −30° to 105°, with 0° being along lead I and positive being inferior and negative being superior (best understood graphically as the hexaxial reference system). Beyond +105° is right axis deviation and beyond −30° is left axis deviation (the third quadrant of −90° to −180° is very rare and is an indeterminate axis). A shortcut for determining if the QRS axis is normal is if the QRS complex is mostly positive in lead I and lead II (or lead I and aVF if +90° is the upper limit of normal). The normal QRS axis is generally down and to the left, following the anatomical orientation of the heart within the chest. An abnormal axis suggests a change in the physical shape and orientation of the heart or a defect in its conduction system that causes the ventricles to depolarize in an abnormal way. The extent of a normal axis can be +90° or 105° depending on the source.
- 147. Amplitudes and intervals All of the waves on an ECG tracing and the intervals between them have a predictable time duration, a range of acceptable amplitudes (voltages), and a typical morphology. Any deviation from the normal tracing is potentially pathological and therefore of clinical significance. For ease of measuring the amplitudes and intervals, an ECG is printed on graph paper at a standard scale: each 1 mm (one small box on the standard ECG paper) represents 40 milliseconds of time on the x-axis, and 0.1 millivolts on the y-axis.
- 148. Feature Description Pathology Duration P wave The P wave represents depolarization of the atria. Atrial depolarization spreads from the SA node towards the AV node, and from the right atrium to the left atrium. The P wave is typically upright in most leads except for aVR; an unusual P wave axis (inverted in other leads) can indicate an ectopic atrial pacemaker . If the P wave is of unusually long duration, it may represent atrial enlargement. Typically a large right atrium gives a tall, peaked P wave while a large left atrium gives a two- humped bifid P wave. <80 ms
- 149. PR interval The PR interval is measured from the beginning of the P wave to the beginning of the QRS complex. This interval reflects the time the electrical impulse takes to travel from the sinus node through the AV node. A PR interval shorter than 120 ms suggests that the electrical impulse is bypassing the AV node, as in Wolf-Parkinson-White syndrome . A PR interval consistently longer than 200 ms diagnoses first degree atrioventricular block . The PR segment (the portion of the tracing after the P wave and before the QRS complex) is typically completely flat, but may be depressed in pericarditis . 120 to 200 ms Feature Description Pathology Duration
- 150. QRS complex The QRS complex represents the rapid depolarization of the right and left ventricles. The ventricles have a large muscle mass compared to the atria, so the QRS complex usually has a much larger amplitude than the P wave. If the QRS complex is wide (longer than 120 ms) it suggests disruption of the heart's conduction system, such as in LBBB, RBBB, or ventricular rhythms such as ventricular tachycardia. Metabolic issues such as severe hyperkalemia, or tricyclic antidepressant overdose can also widen the QRS complex. An unusually tall QRS complex may represent left ventricular hypertrophy while a very low-amplitude QRS complex may represent a pericardial effusion or infiltrative myocardial disease. 80 to 100 ms
- 151. J-point The J-point is the point at which the QRS complex finishes and the ST segment begins. The J-point may be elevated as a normal variant. The appearance of a separate J wave or Osborn wave at the J-point is pathognomonic of hypothermia or hypercalcemia.[33] ST segment The ST segment connects the QRS complex and the T wave; it represents the period when the ventricles are depolarized. It is usually isoelectric, but may be depressed or elevated with myocardial infarction or ischemia. ST depression can also be caused by LVH or digoxin. ST elevation can also be caused by pericarditis, Brugada syndrome, or can be a normal variant (J-point elevation). T wave The T wave represents the repolarization of the ventricles. It is generally upright in all leads except aVR and lead V1. Inverted T waves can be a sign of myocardial ischemia, left ventricular hypertrophy, high intracranial pressure, or metabolic abnormalities. Peaked T waves can be a sign of hyperkalemia or very early myocardial infarction. 16
- 152. Corrected QT interval(QTc) The QT interval is measured from the beginning of the QRS complex to the end of the T wave. Acceptable ranges vary with heart rate, so it must be corrected to the QTc by dividing by the square root of the RR interval. A prolonged QTc interval is a risk factor for ventricular tachyarrhythmias and sudden death. Long QT can arise as a genetic syndrome, or as a side effect of certain medications. An unusually short QTc can be seen in severe hypercalcemia. <440 ms U wave The U wave is hypothesized to be caused by the repolarization of the interventricular septum. It normally has a low amplitude, and even more often is completely absent. If the U wave is very prominent, suspect hypokalemia, hypercalcemia or hyperthyroidism.[34]
- 154. PACEMAKER
- 155. A pacemaker is a small, battery-operated device. This device senses when your heart is beating irregularly or too slowly. It sends a signal to your heart that makes your heart beat at the correct pace.
- 156. PACEMAKER LOCATION
- 157. Newer pacemakers weigh as little as 1 ounce (28 grams). Most pacemakers have 2 parts: The generator contains the battery and the information to control the heartbeat. The leads are wires that connect the heart to the generator and carry the electrical messages to the heart. A pacemaker is implanted under the skin. This procedure takes about 1 hour in most cases. You will be given a sedative to help you relax. You will be awake during the procedure. A small incision (cut) is made. Most often, the cut is on the left side (if you are right handed) of the chest below your collarbone. The pacemaker generator is then placed under the skin at this location. The generator may also be placed in the abdomen, but this is less common. A new "leadless" pacemaker is a self-contained unit that is implanted in the right ventricle of the heart. Using live x-rays to see the area, the doctor puts the leads through the cut, into a vein, and then into the heart. The leads are connected to the generator. The skin is closed with stitches. Most people go home within 1 day of the procedure. There are 2 kinds of pacemakers used only in medical emergencies. They are: Transcutaneous pacemakers Transvenous pacemakers They are not permanent pacemakers.
- 158. Pacemakers may be used for people who have heart problems that cause their heart to beat too slowly. A slow heartbeat is called bradycardia. Two common problems that cause a slow heartbeat are sinus node disease and heart block. When your heart beats too slowly, your body and brain may not get enough oxygen. Symptoms may be Lightheadedness Tiredness Fainting spells Shortness of breath Some pacemakers can be used to stop a heart rate that is too fast (tachycardia) or that is irregular. Other types of pacemakers can be used in severe heart failure. These are called biventricular pacemakers. They help coordinate the beating of the heart chambers. Most biventricular pacemakers implanted today can also work as implantable cardioverter defibrillators (ICD). ICD restore a normal heartbeat by delivering a larger shock when a potentially deadly fast heart rhythm occurs.
- 167. DEFIBRILLATORS Defibrillation is a treatment for life-threatening cardiac dysrhythmias, specifically ventricular fibrillation (VF) and non-perfusing ventricular tachycardia (VT). A defibrillator delivers a dose of electric current (often called a counter shock) to the heart. Although not fully understood, this would depolarize a large amount of the heart muscle, ending the dysrhythmia. Subsequently, the body's natural pacemaker in the sinoatrial node of the heart is able to re-establish normal sinus rhythm. In contrast to defibrillation, synchronized electrical cardioversion is an electrical shock delivered in synchrony to the cardiac cycle. Although the person may still be critically ill, cardioversion normally aims to end poorly perfusing cardiac dysrhythmias, such as supraventricular tachycardia. Defibrillators can be external, transvenous, or implanted (implantable cardioverter- defibrillator), depending on the type of device used or needed.[4] Some external units, known as automated external defibrillators (AEDs), automate the diagnosis of treatable rhythms, meaning that lay responders or bystanders are able to use them successfully with little or no training.
- 168. Types of Defibrillators There are different kinds of defibrillators in use today. They include the manual external defibrillator, manual internal defibrillator, automated external defibrillator (AED), implantable cardioverter-defibrillator (ICD), and wearable cardiac defibrillator. Manual external defibrillator: These defibrillators require more experience and training to effectively handle them. Hence, they are only common in hospitals and a few ambulances where capable hands are present. In conjuntion with an ECG, the trained provider determines the cardiac rhythm and then manually determines the voltage and timing of the shock—through external paddles—to the patient’s chest. Manual internal defibrillator: The manual internal defibrillators use internal paddles to send the electric shock directly to the heart. They are used on open chests, so they are only common in the operating room. It was invented after 1959. Automated external defibrillator (AED): These are defibrillators that use computer technology, thereby making it easy to analyze the heart’s rhythm and effectively determine if the rhythm is shockable. They can be found in medical facilities, government offices, airports, hotels, sports stadiums, and schools.
- 169. Implantable cardioverter-defibrillator: Another name for this is automatic internal cardiac defibrillator (AICD). They constantly monitor the patient’s heart, similar to a pacemaker, and can detect ventricular fibrillation, ventricular tachycardia, supraventricular tachycardia, and atrial fibrillation. When an abnormal rhythm is detected, the device automatically determines the voltage of the shock to restore cardiac function. Wearable cardiac defibrillator: Further research was done on the AICD to bring forth the wearable cardiac defibrillator, which is a portable external defibrillator generally indicated for patients who are not in an immediate need for an AICD. This device is capable of monitoring the patient 24-hours-a-day. It is only functional when it is worn and sends a shock to the heart whenever it is needed. However, it is scarce in the market today.
- 170. THANK YOU