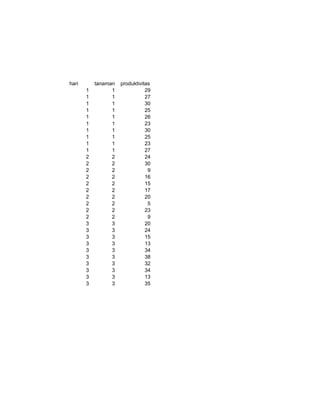
hari       tanaman   produktivitas
       1         1              29
       1         1              27
       1         1              30
       1         1              25
       1         1              26
       1         1              23
       1         1              30
       1         1              25
       1         1              23
       1         1              27
       2         2              24
       2         2              30
       2         2               9
       2         2              16
       2         2              15
       2         2              17
       2         2              20
       2         2               5
       2         2              23
       2         2               9
       3         3              20
       3         3              24
       3         3              15
       3         3              13
       3         3              34
       3         3              38
       3         3              32
       3         3              34
       3         3              13
       3         3              35
Oneway
                                                             Descriptives

                                                                                    95% Confidence Interval for
                                                                                              Mean
                            N            Mean      Std. Deviation    Std. Error    Lower Bound   Upper Bound              Minimum          Maximum
tanaman         senin           10         1.00             .000          .000             1.00            1.00                  1                1
                selasa          10         2.00             .000          .000             2.00            2.00                  2                2
                rabu            10         3.00             .000          .000             3.00            3.00                  3                3
                Total           30         2.00             .830          .152             1.69            2.31                  1                3
produktivitas   senin           10        26.50            2.593          .820            24.65          28.35                  23               30
                selasa          10        16.80            7.743         2.449            11.26          22.34                   5               30
                rabu            10        25.80            9.931         3.140            18.70          32.90                  13               38
                Total           30        23.03            8.455         1.544            19.88          26.19                   5               38


                                          Test of Homogeneity of Variances

                                            Levene
                                            Statistic          df1                df2              Sig.
                         tanaman                      .                2                 .              .
                         produktivitas            9.888                2                27           .001


                                                           ANOVA
    Oneway
                                    Sum of
                                    Squares         df                        Mean Square                     F             Sig.
   tanaman        Between Groups       20.000                            2         10.000                             .                .
                  Within Groups          .000
                    Test of Homogeneity of Variances                    27           .000
                  Total                20.000                           29
                       Levene
   produktivitas Between Groups      585.267                             2              292.633               5.311              .011
                      Statistic    df1          df2                           Sig.
      tanaman     Within Groups .   1487.700
                                         2             .                27              . 55.100
                  Total 9.888
      produktivitas                 2072.967
                                         2          27                  29        .001


                                                          ANOVA

                                            Sum of
                                            Squares            df            Mean Square                  F               Sig.
tanaman            Between Groups             20.000                  2           10.000                          .                .
                   Within Groups                .000                 27             .000
                   Total                      20.000                 29
produktivitas      Between Groups            585.267                  2            292.633                5.311             .011
                   Within Groups            1487.700                 27             55.100
                   Total                    2072.967                 29
Descriptives

                                                                          95% Confidence Interval for
                                                                                    Mean
                         N        Mean     Std. Deviation   Std. Error   Lower Bound   Upper Bound      Minimum    Maximum
tanaman         senin        10     1.00            .000         .000            1.00            1.00          1          1
                selasa       10     2.00            .000         .000            2.00            2.00          2          2
                rabu         10     3.00            .000         .000            3.00            3.00          3          3
                Total        30     2.00            .830         .152            1.69            2.31          1          3
produktivitas   senin        10    26.50           2.593         .820           24.65          28.35          23         30
                selasa       10    16.80           7.743        2.449           11.26          22.34           5         30
                rabu         10    25.80           9.931        3.140           18.70          32.90          13         38
                Total        30    23.03           8.455        1.544           19.88          26.19           5         38
Multiple Comparisons


                                                                  Mean
                                                                Difference                                  95% Confidence Interval
Dependent Variable                    (I) hari    (J) hari          (I-J)     Std. Error        Sig.      Lower Bound   Upper Bound
produktivitas          Tukey HSD      senin       selasa               9.700*     3.320            .018           1.47          17.93
                                                  rabu                   .700     3.320            .976          -7.53           8.93
                                      selasa      senin               -9.700*     3.320            .018         -17.93          -1.47
                                                  rabu                -9.000*     3.320            .030         -17.23           -.77
                                      rabu        senin                 -.700     3.320            .976          -8.93           7.53
                                                  selasa               9.000*     3.320            .030            .77          17.23
                       Bonferroni     senin       selasa               9.700*     3.320            .021           1.23          18.17
                                                  rabu                   .700     3.320          1.000           -7.77           9.17
                                      selasa      senin               -9.700*     3.320            .021         -18.17          -1.23
                                                  rabu                -9.000*     3.320            .035         -17.47           -.53
                                      rabu        senin                 -.700     3.320          1.000           -9.17           7.77
                                                  selasa               9.000*     3.320            .035            .53          17.47
  *. The mean difference is significant at the .05 level.


                                                    Post Hoc Tests
                                                 Homogeneous Subsets
                                                             produktivitas

                                                                             Subset for alpha = .05
                                                 hari             N             1             2
                                Tukey HSDa       selasa               10        16.80
                                                 rabu                 10                      25.80
                                                 senin                10                      26.50
                                                 Sig.                           1.000           .976
                                Means for groups in homogeneous subsets are displayed.
                                  a. Uses Harmonic Mean Sample Size = 10.000.

An Ova Rini

  • 1.
    hari tanaman produktivitas 1 1 29 1 1 27 1 1 30 1 1 25 1 1 26 1 1 23 1 1 30 1 1 25 1 1 23 1 1 27 2 2 24 2 2 30 2 2 9 2 2 16 2 2 15 2 2 17 2 2 20 2 2 5 2 2 23 2 2 9 3 3 20 3 3 24 3 3 15 3 3 13 3 3 34 3 3 38 3 3 32 3 3 34 3 3 13 3 3 35
  • 2.
    Oneway Descriptives 95% Confidence Interval for Mean N Mean Std. Deviation Std. Error Lower Bound Upper Bound Minimum Maximum tanaman senin 10 1.00 .000 .000 1.00 1.00 1 1 selasa 10 2.00 .000 .000 2.00 2.00 2 2 rabu 10 3.00 .000 .000 3.00 3.00 3 3 Total 30 2.00 .830 .152 1.69 2.31 1 3 produktivitas senin 10 26.50 2.593 .820 24.65 28.35 23 30 selasa 10 16.80 7.743 2.449 11.26 22.34 5 30 rabu 10 25.80 9.931 3.140 18.70 32.90 13 38 Total 30 23.03 8.455 1.544 19.88 26.19 5 38 Test of Homogeneity of Variances Levene Statistic df1 df2 Sig. tanaman . 2 . . produktivitas 9.888 2 27 .001 ANOVA Oneway Sum of Squares df Mean Square F Sig. tanaman Between Groups 20.000 2 10.000 . . Within Groups .000 Test of Homogeneity of Variances 27 .000 Total 20.000 29 Levene produktivitas Between Groups 585.267 2 292.633 5.311 .011 Statistic df1 df2 Sig. tanaman Within Groups . 1487.700 2 . 27 . 55.100 Total 9.888 produktivitas 2072.967 2 27 29 .001 ANOVA Sum of Squares df Mean Square F Sig. tanaman Between Groups 20.000 2 10.000 . . Within Groups .000 27 .000 Total 20.000 29 produktivitas Between Groups 585.267 2 292.633 5.311 .011 Within Groups 1487.700 27 55.100 Total 2072.967 29
  • 3.
    Descriptives 95% Confidence Interval for Mean N Mean Std. Deviation Std. Error Lower Bound Upper Bound Minimum Maximum tanaman senin 10 1.00 .000 .000 1.00 1.00 1 1 selasa 10 2.00 .000 .000 2.00 2.00 2 2 rabu 10 3.00 .000 .000 3.00 3.00 3 3 Total 30 2.00 .830 .152 1.69 2.31 1 3 produktivitas senin 10 26.50 2.593 .820 24.65 28.35 23 30 selasa 10 16.80 7.743 2.449 11.26 22.34 5 30 rabu 10 25.80 9.931 3.140 18.70 32.90 13 38 Total 30 23.03 8.455 1.544 19.88 26.19 5 38
  • 4.
    Multiple Comparisons Mean Difference 95% Confidence Interval Dependent Variable (I) hari (J) hari (I-J) Std. Error Sig. Lower Bound Upper Bound produktivitas Tukey HSD senin selasa 9.700* 3.320 .018 1.47 17.93 rabu .700 3.320 .976 -7.53 8.93 selasa senin -9.700* 3.320 .018 -17.93 -1.47 rabu -9.000* 3.320 .030 -17.23 -.77 rabu senin -.700 3.320 .976 -8.93 7.53 selasa 9.000* 3.320 .030 .77 17.23 Bonferroni senin selasa 9.700* 3.320 .021 1.23 18.17 rabu .700 3.320 1.000 -7.77 9.17 selasa senin -9.700* 3.320 .021 -18.17 -1.23 rabu -9.000* 3.320 .035 -17.47 -.53 rabu senin -.700 3.320 1.000 -9.17 7.77 selasa 9.000* 3.320 .035 .53 17.47 *. The mean difference is significant at the .05 level. Post Hoc Tests Homogeneous Subsets produktivitas Subset for alpha = .05 hari N 1 2 Tukey HSDa selasa 10 16.80 rabu 10 25.80 senin 10 26.50 Sig. 1.000 .976 Means for groups in homogeneous subsets are displayed. a. Uses Harmonic Mean Sample Size = 10.000.