The document provides an overview of key economic indicators including:
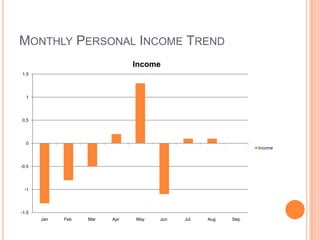
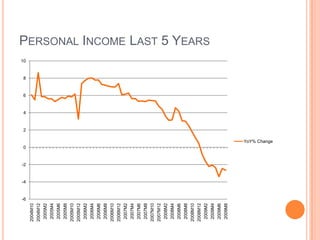
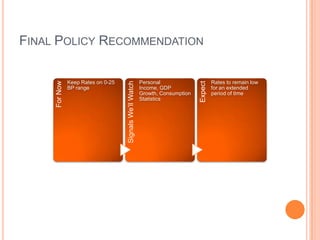
- Personal income was unchanged in September while spending declined 0.5% and savings increased.
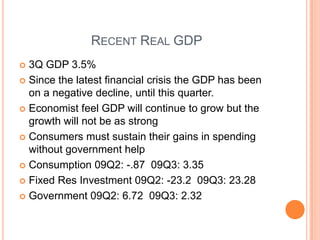
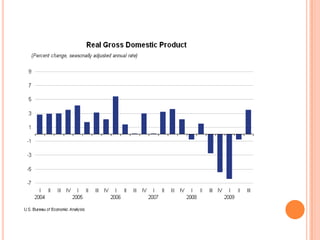
- Real GDP expanded 3.5% in Q3 2009 primarily from consumer spending, exports, inventory investment and federal spending.
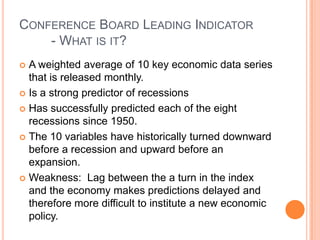
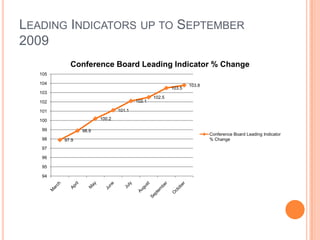
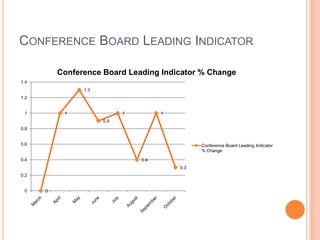
- The Conference Board's Leading Economic Index increased 0.3% in October and has risen for 7 consecutive months, indicating a continued economic recovery.
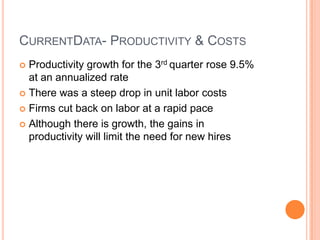
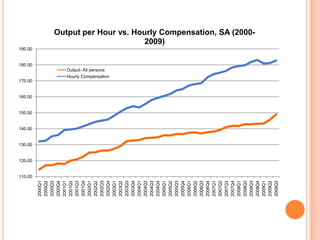
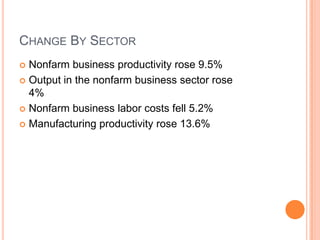
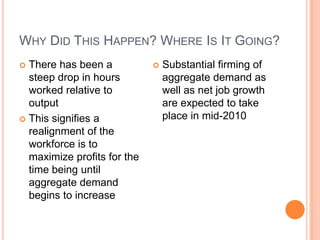
- Productivity growth rose 9.5% in Q3 while unit labor costs fell, as firms cut back on labor to maximize profits with increasing output.
It’s been a challenging week for the pound; on Monday Bank of England chief economist Andy Haldane spoke yesterday about "Big Data" and its use now and in the future to help shape the Bank's policy decisions.
The Labor Department reported initial jobless claims increased by 7,000 to 320,000 in the week ending February 28, 2015. The four-week moving average was 304,750. The February employment report stated nonfarm payrolls rose by 295,000 and the U.S. unemployment rate dropped by 0.2% to 5.5%.
Today’s Economic Landscape and What’s on the Other SideSavannah Whaley
SPG Trend Advisors is a boutique consultancy that provides global economic research for business and other decision makers. With fifty years combined experience between the principals, and through its website, SPG Trend Advisors provides insightful analysis and forecasting to prepare senior executives for tomorrows trends.
Since 2007, federal debt held by the public has more than doubled in relation to the size of the economy, and it will keep growing significantly if the large annual budget deficits projected under current law come to pass. The Congress faces an array of policy choices as it confronts the challenges posed by such large and growing debt.
These are our views (macro, technical as well as quantitative) on the financial markets for the month to come...
FinLight Research is a quantitative cross-asset research firm with an expertise in real assets analysis and a focus on some specific issues: risk budgeting, asset allocation, trading systems and business intelligence.
From here, we are rethinking, day after day, the investment paradigm, preparing optimally for what lies ahead… This is our pretension!
Mercer Capital's Value Focus: Auto Dealer Industry | Year-End 2015Mercer Capital
Mercer Capital's Auto Dealer Industry newsletter provides perspective on valuation issues. Each newsletter also includes a macroeconomic trends, industry trends, and guideline public company metrics.
It is about economic analysis for US from 2014-2016Review my paper.docxBHANU281672
It is about economic analysis for US from 2014-2016
Review my paper and correct some grammers.
Besides, correct the wrong thing and add what the "blue word" suggested.
At the end of the analysis of 2016.
Add some changes and trend after the trump selection.
Part A
Introduction
My name is Yinan Hong. I am your portfolio manager from Trailblazer Investment Advisors. I am a CFA holder, equipped with sufficient financial knowledge. I will help my customers manage their wealth and try my best to gain as much as possible. There are three objectives for my clients, Sam and Amy Kratchman with $1,100,000(on an after-tax basis) inheritance. The first one is having enough money for their life after retirement at age 65. The second objective is raising college tuition for their two children. The last one is to buy a beach house with newfound inheritance.
Economic Analysis
2014
GDP Growth
The economic recovery of United States in 2014 became a light spot in global economy after the 2009 recession. The low price level, decreasing unemployment rate, better development of the estate and manufacturing industry made the economy continuously recover. However, some important indexes like the investment of the real estate, income of residents, manufacturing have not reached to the same level as it performed before the recession. The percentage change in Real Gross Domestic Product in 2014 increased in the former three quarters and then decrease in the Q4.
In the first quarter, the change of GDP was 2.1% negative growth
1
. The most important factor was the abominable weather. The personal consumption expenditures for nondurable goods decreased because
[1]
the inconvenient of buying. The Gross private domestic investment decreased 6.6% because of the huge lower equipment investment
1
. The exports decreased extremely and the imports increased. They all led to the negative growth.
Figure1
[2]
: CCI Index in 2014
The GDP growth reached to 4.0% in the second quarter. By analyzing the components that affected overall GDP growth, personal consumption expenditures and gross private domestic investment played an important role in this significant growth. Consumption contributed 2.56% change in GDP. After the severe weather, the private inventory investment, exports, fixed investment, and non-federal government spending increased. However, 5% more imports negatively impact GDP and offset those positive contributors. Purchasing Managers’ Index (PMI) also indicated that the economic situation would turns better. The overall PMI index was over 50 and kept the upward trend, which represents expansion of the manufacturing sector. Besides, as shown in figure 1, the consumer confidence index had an upward tendency, may because corporates operated better, unemployment rate decreased, and the income of residents increased.
Figure 2
[3]
Unemployment rate continuously went down in 2014, and the job market significantly became better. Businesses have added 10.9 million jobs ...
The recent correction in global financial markets has left developed market equities about 10% cheaper and emerging market equities 25% cheaper, removing a lot of the valuation froth that was evident.
Commenting in Novare Investments’ economic report for the third quarter of 2015, Francois van der Merwe, Head of Macro Research, said: “We expect global equities to be supported by continued accommodative monetary policies, soft inflation and a moderate global economic recovery.
Will the Momentum coming out of 2013 Carry Our Growth Through 2014?Lawrence R. Levin
The Newsletter discusses why the current political bickering may keep us out of recession for the next 3 quarters. The Wise Old Owl talks about how to use the current calm to be ready for the coming changes.
SPG Trend Advisors and its affiliate, Sage Policy Group, have made presentations on local and regional economies, the national economy, international and geopolitical issues and capital market events. We offer these presentations for our readers to gain additional information from our commentaries and further explanation of our analyses and forecasts.
CII’s flagship monthly publication Economy Watch has been now revamped and rechristened as ‘Economy Matters’. Apart from encompassing all the key features of the old version, the new issue also carries a new section on Corporate Profitability to keep readers abreast about the latest trends in corporate performance. The ‘Economy Matters’ brought out by CII Research seeks to provide an in-depth update on current trends in the domestic and international economy and helps in tracking policy developments and understanding industry dynamics.
1. GDP Sector Status Report Ben Araya- Personal Income Brett Hart- GDP Rob Kunces- Index of Leading Indicators Brad Neumyer- P & C November30, 2009
2. Personal Income Income received by households from employment, investments, and transfer payments. Wages and Salary Released monthly
3. Personal Income: what to look for Trends in personal income growth Trends in savings rates Changes in consumer expenditures Changes in growth in the core PCE deflator
4. Current Situation Personal income was unchanged in September Spending declined 0.5% Savings rate increase to 3.3%
7. REAL GDP Real GDP is an inflation-adjusted measurement of the value of all the goods and services produced in a fiscal year, expressed in base-year prices. This is referred to as “constant-price”
8. REAL GDP The US economy expanded 3.5% in the third quarter. The first growth since the second quarter of 08. Growth came primarily from consumer spending, exports, inventory investment, homebuilding and federal government spending.
9. Recent Real GDP 3Q GDP 3.5% Since the latest financial crisis the GDP has been on a negative decline, until this quarter. Economist feel GDP will continue to grow but the growth will not be as strong Consumers must sustain their gains in spending without government help Consumption 09Q2: -.87 09Q3: 3.35 Fixed Res Investment 09Q2: -23.2 09Q3: 23.28 Government 09Q2: 6.72 09Q3: 2.32
10.
11. Conference Board Leading Indicator - What is it? A weighted average of 10 key economic data series that is released monthly. Is a strong predictor of recessions Has successfully predicted each of the eight recessions since 1950. The 10 variables have historically turned downward before a recession and upward before an expansion. Weakness: Lag between the a turn in the index and the economy makes predictions delayed and therefore more difficult to institute a new economic policy.
14. Conference Board Leading Economic Index (LEI) for the U.S. increased 0.3 percent in October, following a 1.0 percent gain in September, and a 0.4 percent rise in August. 5.7 percent increase in the LEI since March-2009 continuing a 6 month upward trend. Index of consumer expectations, building permits, index of supplier deliveries (vendor performance), and manufacturers’ new orders for nondefense capital goods were negative contributors in October. The LEI has increased 7 consecutive months. LEI is up %4.2 from last year at this time and is the fastest growth rate since 2005.
15. Analysis & Prediction GDP growth in the 3rd quarter is expected to reach an annualized rate of 3%. 4th quarter predictions see GDP rate slowing down due to consumer balance sheets still not at their previous levels. Slow job creation and the end of the clash for clunkers program will see the high numbers of September come back down. Depending on how fast firms replenish their workforce will determine the length and velocity of the recovery of the economy. The labor market and slow housing market recovery support the view of a slow paced recovery.
16. Analysis & Prediction Continued… November and December are expected to be up again to end 2009 but their percent change increase is to be small. Consumer confidence and stability in the financial market will keep GDP positive but consumer spending is slowed by employment recovery. High national unemployment in manufacturing will limit growth for the remainder of the year. The housing market recovery has slowed and is expected to slow recovery in 2010.
17. CurrentData- Productivity & Costs Productivity growth for the 3rd quarter rose 9.5% at an annualized rate There was a steep drop in unit labor costs Firms cut back on labor at a rapid pace Although there is growth, the gains in productivity will limit the need for new hires
18.
19. Change By Sector Nonfarm business productivity rose 9.5% Output in the nonfarm business sector rose 4% Nonfarm business labor costs fell 5.2% Manufacturing productivity rose 13.6%
20. Why Did This Happen? Where Is It Going? There has been a steep drop in hours worked relative to output This signifies a realignment of the workforce is to maximize profits for the time being until aggregate demand begins to increase Substantial firming of aggregate demand as well as net job growth are expected to take place in mid-2010
Personal Income:is a measure of income received by households from employment, investments, and transfer payments. The largest component of personal income is wages and salary from employment. Data is also released monthly When judging personal income one can look at several trends to indicate income. (Next Slide)
Trends in Personal Income Growth: can indicate future consumer spending patternsTrends in Savings rates: reflect balance between income and spending growth, indicator of consumer credit qualityChanges in Consumer Expenditures: weakness in expenditure growth is a weakness in consumer demand, which leads to a weaker economy. Sometimes even a recession, because consumer spending makes up 2/3 of GDP.Changes in growth in the Core PCE deflator: a measure of consumer price inflation
Personal income was essentially unchanged in September, it had risen 0.1% in each of the prior two months. Wage income fell 0.2%.Income growth is being supported by government Spending declined 0.5%. Decline in spending was expected, as initial gains were generated by auto sales created by the cash for clunkers program. The savings rate rose from 2.8% to 3.3%. Consumers showed they were more eager to save. They have increased their savings in an attempt to get their debts under control. Consumer savings should continue to rise as they work to rebuild their finances.
Personal income increased 0.2% in August, This was the second consecutive month such growth was noticed. It also confirms that modes income gains appear to have returned. Personal Income was unchanged in September.
Over the past five years there seems to be an overall downward trend in personal income.
10 economic data series:Spread between the 10-year treasury and the funds rateM2 money supplyAverage workweek in manufacturingManufacturers’ new orders for consumer goodsS&P 500Average weekly initial unemployment claimsVendor performance component of the NAPM indexHousing permitsConsumer expectationsManufacturers’ new order for nondefense capital goods