This paper assesses the viability of ammonia as a long-term energy storage solution in future decarbonized energy systems, comparing it to other storage technologies and emphasizing its economic and environmental advantages over pure hydrogen. It discusses the current production techniques for ammonia, the necessary policy supports for its large-scale adoption, and identifies conditions under which zero-carbon ammonia production is economically feasible. Ultimately, the paper argues that without sufficient policy incentives, the growth of green ammonia will be limited to small-scale applications in areas with abundant renewable energy.


![15
Here, low capital costs are due to the assumed implementation of membrane-less electrolysers characterized by high
‘potential for simple construction and high current densities […] driving down capital costs to the levels required for water
technologies in the future, electricity-based NH3 production is likely to be organized and expanded in the form of a
small- or medium-scale operations.
Indeed, in contrast to the previous trend – which was moving towards larger and ever larger production
facilities – a new trend is expected to emerge that moves towards smaller plants. These will, however,
be sufficiently large to serve a regional market while representing a viable business model (Ammonia
Industry, 2018a). Although in the US model, demonstrated in Table 4, the cost of green ammonia is
significantly higher than the cost of NH3 obtained through conventional processes, this may not
necessarily be the case everywhere, as the actual costs are highly place-specific. In other words, under
certain conditions, electricity-based ammonia production may be cost-competitive with conventional
gas-based generation.
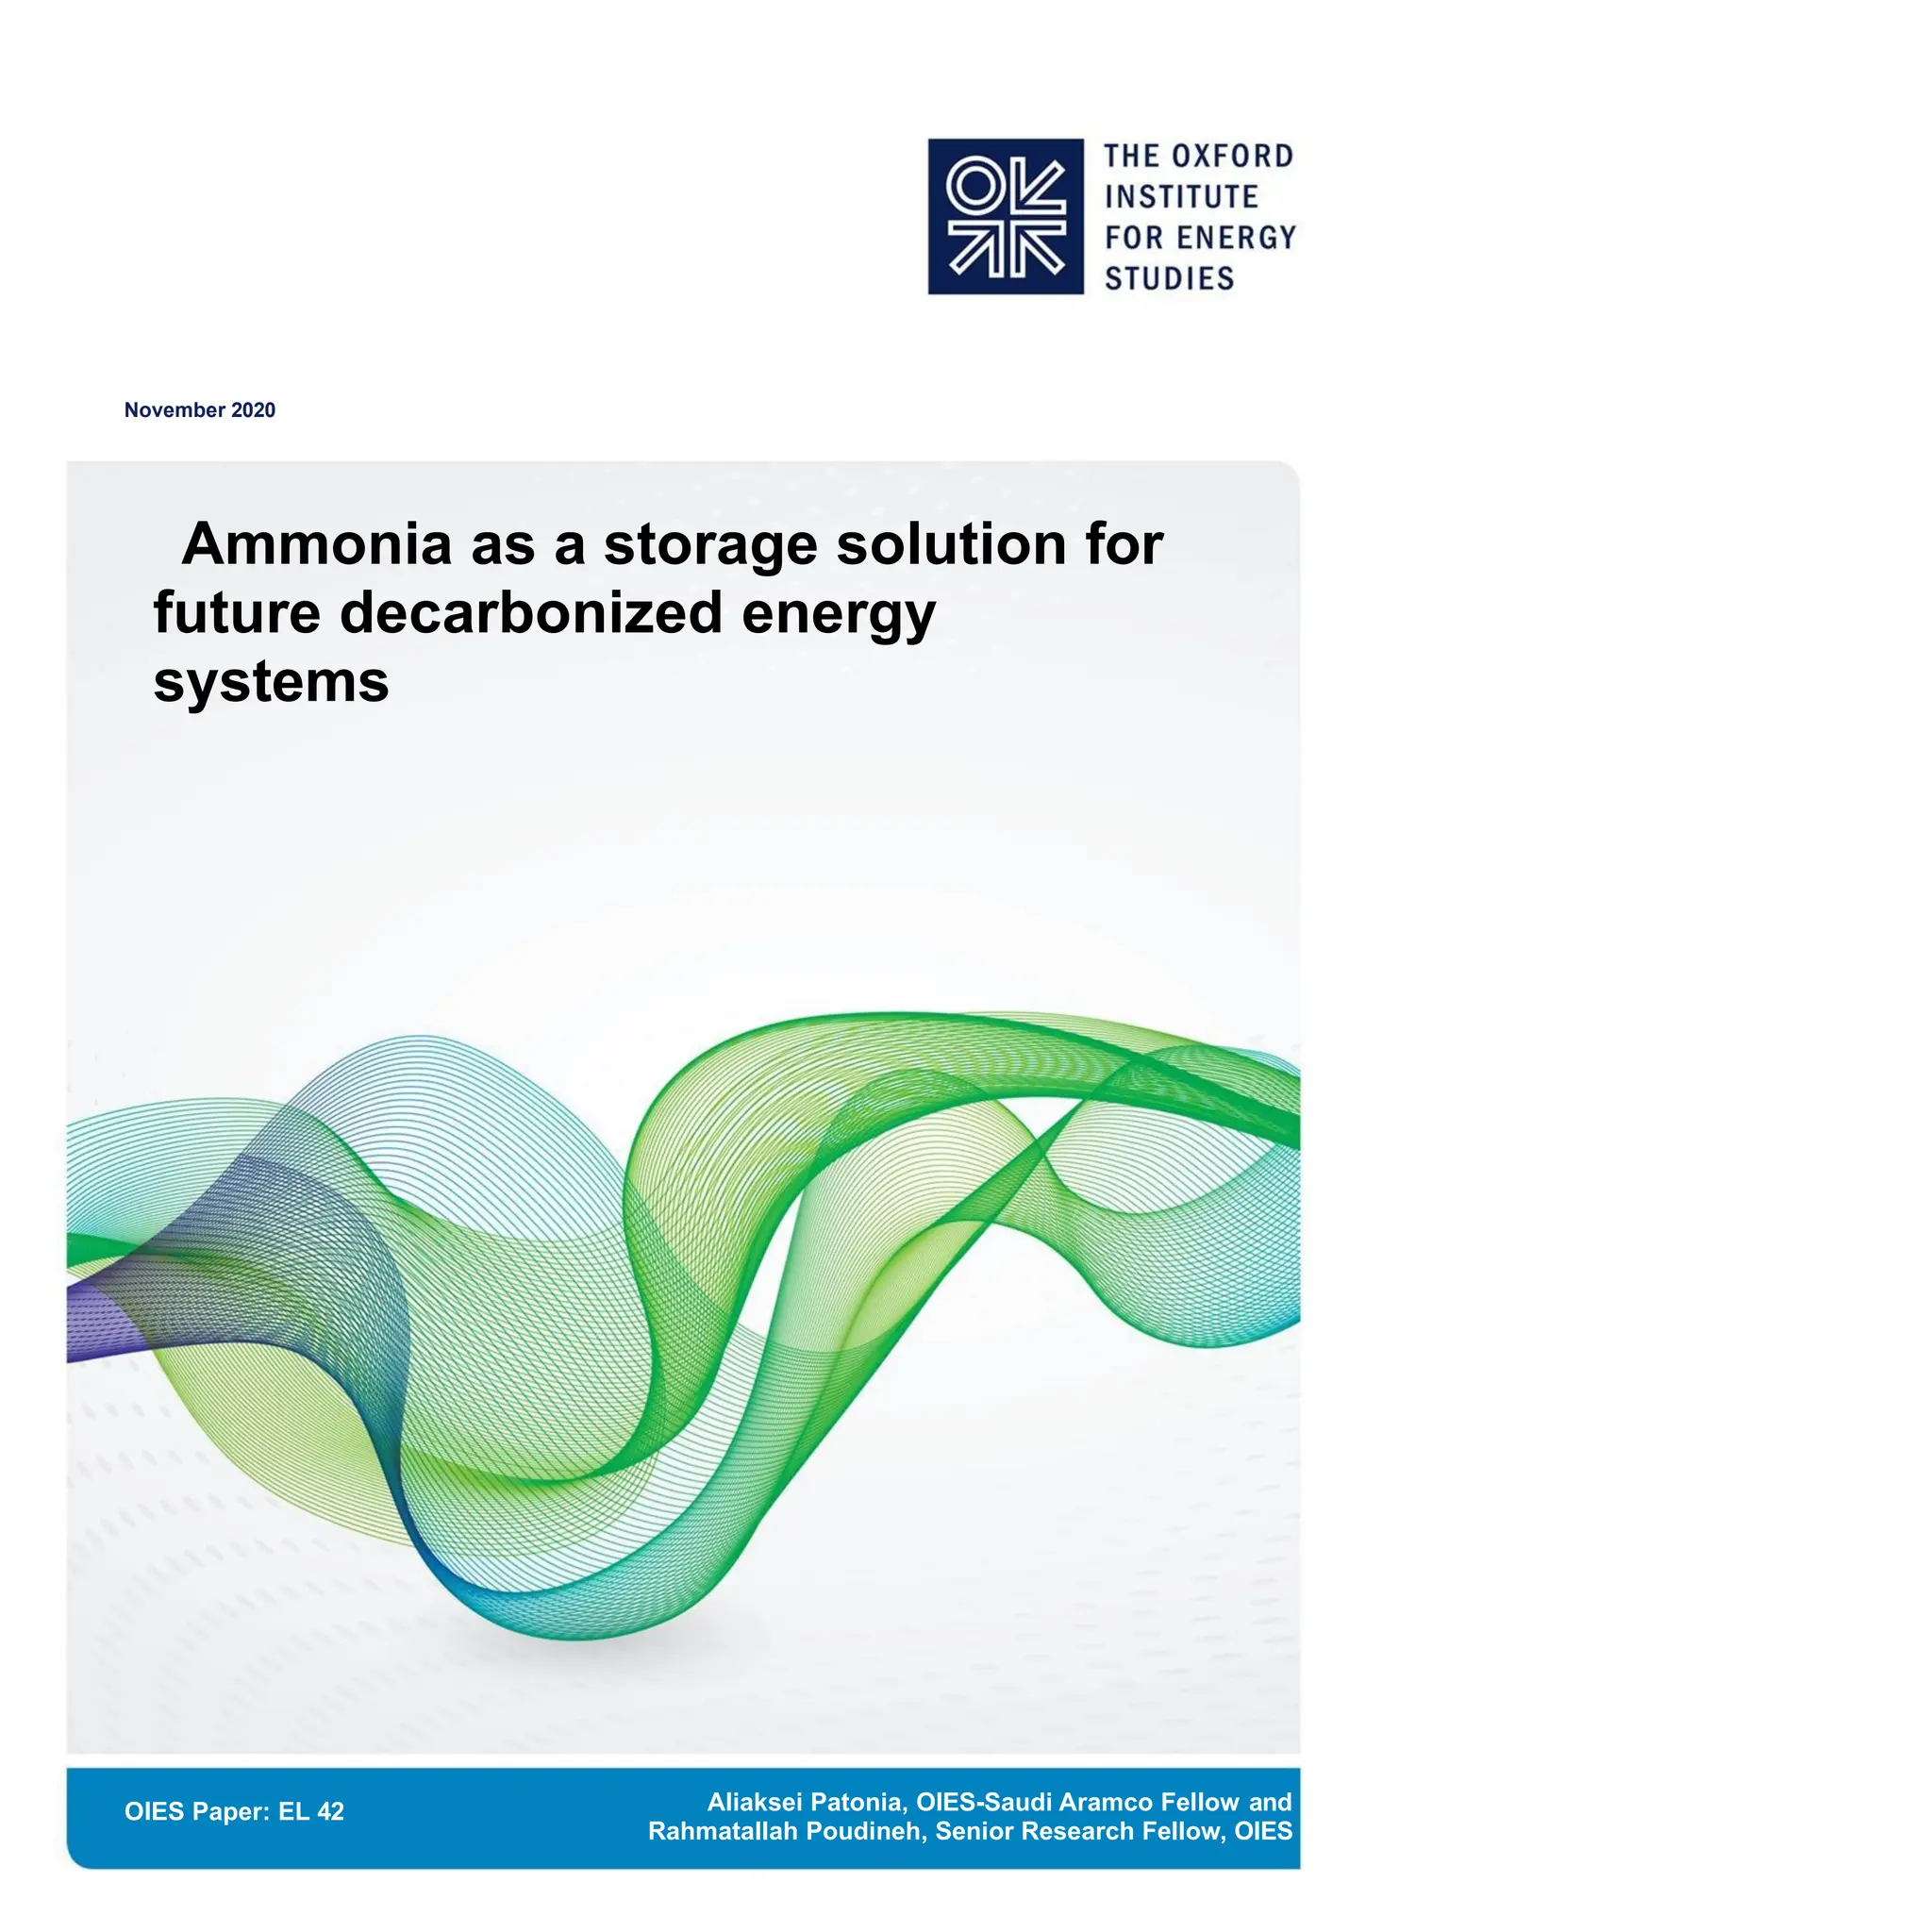
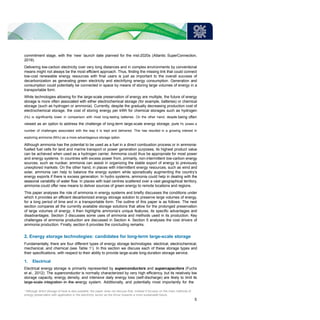
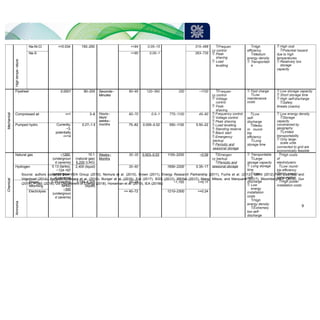
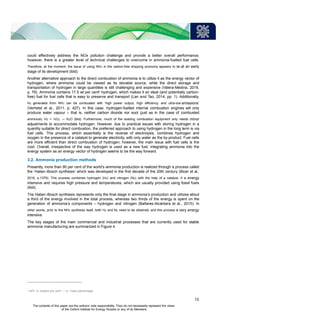
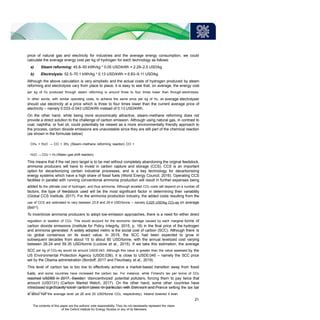
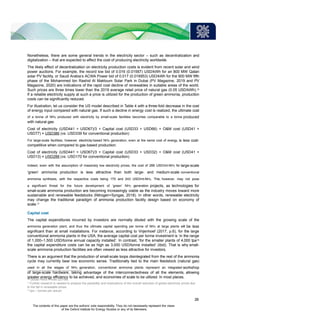
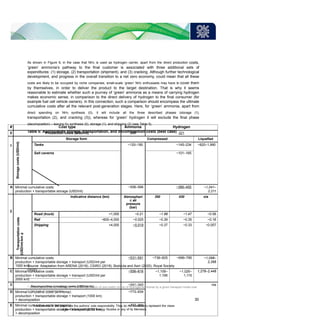
To identify these conditions, it is useful to review the previously described US model from a different
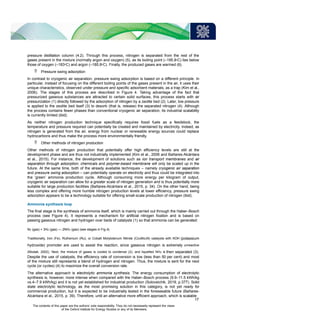
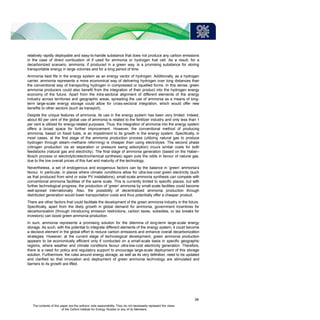
perspective – namely, highlighting all the components of the final NH3 cost (see Figure 7).
Figure 7: ‘Green’ ammonia production costs by components
100.0%
80.0%
60.0%
40.0%
20.0%
0.0%
Large-scale Medium-scale Small-scale
Electricity (H2 generation) Electricity (Haber–Bosch)
Capital (H2 generation)
Capital (Haber–Bosch) O&M (H2 generation)
O&M (Haber–Bosch)
Sources: Authors’ adaptation from Hochman, et al. (2019)
The key cost components of green ammonia production are electricity, capital investment, and
operations and maintenance (O&M). As seen from Figure 7, with a share of around 80 per cent in
large- and 70 per cent in small-scale installations, the electricity costs significantly outweigh the rest
of the components. At the same time, capital15 and O&M costs – jointly varying between 30 and 20 per
cent for small- and large-scale facilities – still represent a substantial share. These three
categories of expenses will have a direct impact on the ultimate cost of ammonia; we therefore
examine them further below.
Electricity cost
Unlike other energy sources such as oil and gas which have a global market, electricity is mainly local.
This means that there is a huge difference between the cost of electricity across the world, as it
depends on generation mix and government policy, as well as the structure of the electricity market.
In some places, electricity is subject to significant taxation (such in Europe) whereas in other places it
is heavily subsidized (such as in MENA). Thus, little can be said about the price of electricity at the
global level.
electrolysis to compete with steam–methane reforming’ (Esposito, 2017, p.651).
25
The contents of this paper are the authors’ sole responsibility. They do not necessarily represent the views
of the Oxford Institute for Energy Studies or any of its Members.](https://image.slidesharecdn.com/ammonia-as-a-storage-solution-for-future-decarbonized-systems-el-42-241220080732-af182e95/85/Ammonia-as-a-storage-solution-for-future-decarbonized-systems-EL-42-pptx-26-320.jpg)
![References:
AEA Group (2010) Energy Storage and Management Study [Online]. Available from:
https://www.webarchive.org.uk/wayback/archive/20170113164907/http://www.gov.scot/Publications/2
010/10/28091356/14 (Accessed: 13 November 2019).
Alshawaf, M., Poudineh, R., and Alhajeri, N.S. (2020) ‘Solar PV in Kuwait: The effect of ambient
temperature and sandstorms on output variability and uncertainty’, Renewable and Sustainable
Energy Reviews, 134 (1), pp. 1-11.
Ammonia Energy Association (2018) Green ammonia plants, commercially available today [Online].
Available from: https://www.ammoniaenergy.org/articles/green-ammonia-plants-commercially-
available-today/ (Accessed: 4 December 2019).
Ammonia Industry (2018) Small-scale ammonia production is the next big thing [Online]. Available
from: https://ammoniaindustry.com/small-scale-ammonia-production-is-the-next-big-thing/ (Accessed:
8 February 2020).
Aneke, M. and Wang, M. (2015) ‘Potential for improving the energy efficiency of cryogenic air
separation unit (ASU) using binary heat recovery cycles’, Applied Thermal Engineering, 81 (1), pp.
223–31.
Angeles et al. (2017) ‘Carbon and nitrogen footprint optimization of ammonia as an automotive
fuel’,
Chemical Engineering Transactions, 61 (1), pp. 271–6.
Appl, M. (1999) Ammonia: Principles and industrial practice, New York, NY: Weinheim.
Argonne National Laboratory (2007) Overview of interstate hydrogen pipeline systems [Online].
Available from: https://publications.anl.gov/anlpubs/2008/02/61012.pdf (Accessed: 11 October
2020).
ARENA (2018) Opportunities for Australia from hydrogen exports, Melbourne, VIC: ACIL Allen
Consulting.
Ash, N. and Scarbrough, T. (2019) Sailing on solar: Could green ammonia decarbonize international
shipping? London, UK: Environmental Defense Fund.
ASHRAE (2017) Ammonia as a refrigerant, Atlanta, GE: ASHRAE.
Atlantic SuperConnection (2019) Renewable energy partnership with Iceland [Online]. Available from:
http://www.atlanticsuperconnection.com/#timeline (Accessed: 29 October 2019).
Bañares-Alcántara, R. et al. (2015) Analysis of islanded ammonia-based energy storage systems,
Oxford, UK: University of Oxford.
Bartels, J.R. (2008) A feasibility study of implementing an Ammonia Economy, Ames, IA: Iowa State
University.
Bicer et al. (2016) ‘Comparative life cycle assessment of various ammonia production methods’,
Journal of Cleaner Production, 135 (1), pp. 1379–95.
Bloomberg (2013) Iceland seeks second power cable study to tap European markets [Online].
Available from: https://www.bloomberg.com/news/articles/2013-07-15/iceland-seeks-second-power-
cable-study-to-tap-european-markets (Accessed: 29 October 2019).
Bloomberg (2019a) Currencies [Online]. Available from:
https://www.bloomberg.com/markets/currencies (Accessed: 13 November 2019).
BloombergNEF (2018) Tumbling costs for wind, solar, batteries are squeezing fossil fuels [Online].
Available from: https://about.bnef.com/blog/tumbling-costs-wind-solar-batteries-squeezing-fossil-fuels/
(Accessed: 16 November 2019).
35
The contents of this paper are the authors’ sole responsibility. They do not necessarily represent the views
of the Oxford Institute for Energy Studies or any of its Members.](https://image.slidesharecdn.com/ammonia-as-a-storage-solution-for-future-decarbonized-systems-el-42-241220080732-af182e95/85/Ammonia-as-a-storage-solution-for-future-decarbonized-systems-EL-42-pptx-36-320.jpg)
![Boddula, I.R. and Asiri, A.M. (2020) Sustainable ammonia production, Cham, Switzerland: Springer
Nature Switzerland AG.
Boerner, L. K. (2019) ‘Industrial ammonia production emits more CO2 than any other chemical-making reaction.
Chemist want to change that’, Chemical & Engineering News, 97 (24), pp. 1–9.
Bordoff, J. (2017) ‘Trump vs. Obama on the social cost of carbon – and why it matters’, The Wall
Street Journal, 15 (11), 1–3.
British Geological Survey (2019) Underground natural gas storage in the UK [Online]. Available from:
https://www.bgs.ac.uk/research/energy/undergroundGasStorage.html (Accessed: 08 November
2019).
Brown, N. (2011) Cheaper ultracapacitors for electric vehicles [Online]. Available from:
https://cleantechnica.com/2011/05/11/cheaper-ultracapacitors-for-electric-vehicles/ (Accessed: 24
September 2019).
Bunger, U., Michalski, J., Crotogino, F., and Kruck, O. (2016) ‘Large-scale underground storage of
hydrogen for the grid integration of renewable energy and other applications’, Hydrogen Use, Safety
and the Hydrogen Economy, 4 (1), pp. 133–63.
Caglayan, D.G., et al. (2020) ‘Technical potential of salt caverns for hydrogen storage in Europe’,
International Journal of Hydrogen Energy, 1 (1), pp. 1–13.
Carbon Market Watch (2017) Pricing carbon to achieve the Paris goals [Online]. Available from:
https://euagenda.eu/upload/publications/untitled-103401-ea.pdf (Accessed:01 February 2020).
Centre for Low Carbon Futures (2013) Liquid air in the energy and transport systems. Opportunities
for industry and innovation in the UK. York, UK: The Centre for Low Carbon Futures.
Chao, Y., Huang, C.T., Lee, H.M., and Chang, M.B. (2008) ‘Hydrogen production via partial oxidation
of methane with plasma-assisted catalysis’, International Journal of Hydrogen Energy, 33 (1), pp.
664–71.
Chorzowski, M. and Gizicki, W. (2015) ‘Technical and economic aspects of oxygen separation for
oxy-fuel purposes’, Archives of Thermodynamics, 36 (1), pp. 157–70.
Coelho, P.J. (2017) ‘Radiative Transfer in Combustion Systems’, in: Kulacki, F. (eds) Handbook of
Thermal Science and Engineering, Springer, Cham.
CSIRO (2018) National hydrogen roadmap. Pathways to an economically sustainable hydrogen
industry in Australia, Canberra, ACT: Commonwealth Scientific and Industrial Research Organisation.
Dagdougui, H., Sacile, R., Bersani, C., and Ouammi, A. (2018) Hydrogen infrastructure for energy
applications. Production, storage, distribution and safety, London, UK: Academic Press.
Dincer, I., Colpan, C.O., and Kadioglu, F. (2013) Causes, impacts and solutions to global warming,
New York, NY: Springer.
Di Pascoli, S.D., Femia, A.M., and Luzzati, T. (2001) ‘Natural gas, cars and the environment. A
(relatively) “clean” and cheap fuel looking for users’, Ecological Economist, 38 (1), pp. 179–89.
Dissanayake, K. (2017) ‘Ammonia as an alternative for fuel internal combustion engines’, IOSR
Journal of Medical and Civil Engineering, 14 (1/VI), pp. 46–9.
EESI (2019) Fossil fuels [Online]. Available from: https://www.eesi.org/topics/fossil-fuels/description
(Accessed: 30 December 2019).
EIA (2017) Cost and performance characteristics of new generating technologies, Annual Energy
Outlook 2019 [Online]. Available from:
https://www.eia.gov/outlooks/aeo/assumptions/pdf/table_8.2.pdf (Accessed: 24 September 2019).
36
The contents of this paper are the authors’ sole responsibility. They do not necessarily represent the views
of the Oxford Institute for Energy Studies or any of its Members.](https://image.slidesharecdn.com/ammonia-as-a-storage-solution-for-future-decarbonized-systems-el-42-241220080732-af182e95/85/Ammonia-as-a-storage-solution-for-future-decarbonized-systems-EL-42-pptx-37-320.jpg)
![EIA (2019) Electricity explained [Online]. Available from:
https://www.eia.gov/energyexplained/electricity/ (Accessed: 15 January 2020).
Eldardiry, H. and Habib, E. (2018) ‘Carbon capture and sequestration in power generation: Review of
impacts and opportunities for water sustainability’, Sustainability and Society, 8 (6), pp. 1–15.
Elucidare (2008) Ammonia. New possibilities for hydrogen storage and transportation [Online].
Available from: http://www.elucidare.co.uk/news/Ammonia%20as%20H2%20carrier.pdf (Accessed:
04 December 2019).
Energy Post (2019) Can Vanadium Flow Batteries beat Li-ion for utility-scale storage? [Online].
Available from: https://energypost.eu/can-vanadium-flow-batteries-beat-li-ion-for-utility-scale-storage/
(Accessed: 19 November 2019).
Energy Post (2020) Green Ammonia can replace fossil fuel storage at scale [Online]. Available from:
https://energypost.eu/green-ammonia-can-replace-fossil-fuel-storage-at-scale/ (Accessed: 07 October
2020).
Energy Research Partnership (2011) The future role for energy storage in the UK main report
[Online]. Available from: http://erpuk.org/wp-content/uploads/2014/10/52990-ERP-Energy-Storage-
Report-v3.pdf (Accessed: 06 November 2019).
Energy Research Partnership (2016) Heating buildings. Reducing energy demand and greenhouse
gas emissions [Online]. Available from: http://erpuk.org/wp-content/uploads/2017/01/ERP-Heating-
Buildings-report-Oct-2016.pdf (Accessed: 07 November 2019).
Esposito, D.V. (2017) ‘Membraneless electrolyzers for low-cost hydrogen production in a renewable
energy future’, Joule, 1 (1), pp. 651–8.
Fertilizers Europe (2013) Guidance for inspection and leak detection in liquid ammonia pipelines
[Online]. Available from: https://www.fertilizerseurope.com/wp-
content/uploads/2019/08/Guidance_for_inspection_of_and_leak_detection_in_liquid_ammonia_pipeli
nes_FINAL_01.pdf (Accessed: 10 October 2020).
Fertilizers Europe (2019) Ammonia Stress Corrosion Cracking [Online]. Available from:
https://www.fertilizerseurope.com/wp-content/uploads/2019/08/SCC2.pdf (Accessed: 08 October
2020).
Fleurbaey, M., et al. (2019) ‘The social cost of carbon: Valuing inequality, risk, and population for
climate policy’, The Monist, 102, 1, pp. 84–109.
Fuchs, G., Lunz, B., Leuthold, M., and Sauer, D.U. (2012) Technology overview on electricity storage.
Overview on the potential and on the deployment perspectives of electricity storage technologies,
Aachen: ISEA.
Garagounis, I., Kyriakou, V., Skodra, A., Vasileiou, E., and Stoukides, M. (2014) ‘Electrochemical
synthesis of ammonia in solid electrolyte cells’, Frontiers in Energy Research, 2 (1), pp. 1–10.
GENI (2012) Energy storage technologies & their role in renewable integration [Online]. Available
from: http://www.geni.org/globalenergy/research/energy-storage-technologies/Energy-Storage-
Technologies.pdf (Accessed: 14 November 2019).
Giannakopoulos, C. and Psiloglou, B.E. (2006) ‘Trends in energy load demand for Athens, Greece:
Weather and non-weather related factors’, Climate Research, 31 (1), pp. 97–108.
Giddey, S., Badwal, S.P.S., and Kulkarni, A. (2013) ‘Review of electrochemical ammonia production
technologies and materials’, International Journal of Hydrogen Energy, 38 (1), pp. 14576–94.
37
The contents of this paper are the authors’ sole responsibility. They do not necessarily represent the views
of the Oxford Institute for Energy Studies or any of its Members.](https://image.slidesharecdn.com/ammonia-as-a-storage-solution-for-future-decarbonized-systems-el-42-241220080732-af182e95/85/Ammonia-as-a-storage-solution-for-future-decarbonized-systems-EL-42-pptx-38-320.jpg)
![Global CCS Institute (2017) Global costs of carbon capture and storage [Online]. Available from:
https://www.globalccsinstitute.com/archive/hub/publications/201688/global-ccs-cost-updatev4.pdf
(Accessed: 13 January 2020).
Global Petrol Prices (2019a) Electricity prices [Online]. Available from:
https://www.globalpetrolprices.com/electricity_prices/ (Accessed: 15 January 2020).
Global Petrol Prices (2019b) Natural gas prices [Online]. Available from:
https://www.globalpetrolprices.com/natural_gas_prices/ (Accessed: 15 January 2020).
Godula-Jopek, A., Jehle, W., and Wellnitz, J. (2012) Hydrogen storage technologies. New Materials,
Transport, and Infrastructure, Weinheim, Germany: Wiley-VCH Verlag & Co. KGaA.
Green Tech Media (2018) Siemens tests ammonia as a form of energy storage for renewables
[Online]. Available from: https://www.greentechmedia.com/articles/read/siemens-ammonia-hydrogen-
energy-storage (Accessed: 04 December 2019).
Green Tech Media (2020) Marine sector turns to ammonia to decarbonize shipping [Online]. Available
from: https://www.greentechmedia.com/articles/read/marine-sector-looks-to-ammonia-to-decarbonize-
shipping (Accessed: 05 October 2020).
Gur, T.M. (2018) ‘Review of electrical energy storage technologies, materials and systems:
Challenges and prospects for large-scale grid storage’, Energy and Environmental Science, 10 (1),
pp. 2696–767.
Hochman, G., et al. (2019) The potential economic feasibility of direct electrochemical nitrogen
reduction as a route to ammonia [Online]. Available from:
https://chemrxiv.org/articles/The_Potential_Economic_Feasibility_of_Direct_Electrochemical_Nitrogen
_Reduction_as_a_Route_to_Ammonia/9894437 (Accessed: 11 February 2020).
Holland, H.D. and Turekian, K.K. (2005) Treatise on geochemistry, Boston, MA: Elsevier.
Holleman, A.F. and Wiberg, E. (2001) Inorganic chemistry, San Diego, CA: UCSD Academic Press.
Horseman, S., Evans, D., Rowley, J., and Chadwick, A. (2019) ‘Underground gas storage. Geology,
technology, planning and regulation’, Energy Resources, 1 (1), pp. 12–13.
Hydrogen Council (2020) Path to hydrogen competitiveness. A cost perspective, Brussels, Belgium:
Hydrogen Council.
ICIS (2020) Ammonia prices, markets & analysis [Online]. Available from:
https://www.icis.com/explore/commodities/chemicals/ammonia/ (Accessed: 24 April 2020).
IEA (2019a) Key world energy statistics [Online]. Available from:
https://webstore.iea.org/download/direct/2831?fileName=Key_World_Energy_Statistics_2019.pdf
(Accessed: 15 January 2020).
IEA (2019b) World Energy Investment 2019 [Online]. Available from: https://webstore.iea.org/world-
energy-investment-2019 (Accessed: 26 October 2019).
IEA (2019c) The future of hydrogen. Seizing today’s opportunities, Paris, France: International Energy
Agency.
IEEE (2017) It’s big and long-lived, and it won’t catch fire: The vanadium redox-flow battery [Online].
Available from: https://spectrum.ieee.org/green-tech/fuel-cells/its-big-and-longlived-and-it-wont-catch-
fire-the-vanadium-redoxflow-battery (Accessed: 14 November 2019).
IIAR (2008) Ammonia data book [Online]. Available from:
http://web.iiar.org/membersonly/PDF/CO/databook_ch2.pdf (Accessed: 04 December 2019).
38
The contents of this paper are the authors’ sole responsibility. They do not necessarily represent the views
of the Oxford Institute for Energy Studies or any of its Members.](https://image.slidesharecdn.com/ammonia-as-a-storage-solution-for-future-decarbonized-systems-el-42-241220080732-af182e95/85/Ammonia-as-a-storage-solution-for-future-decarbonized-systems-EL-42-pptx-39-320.jpg)
![Institute for Policy Integrity (2015) Expert consensus on the economics of climate change, New York,
NY: Institute for Policy Integrity.
International Carbon Action Partnership (2020) China – Beijing pilot ETS [Online]. Available from:
https://icapcarbonaction.com/en/?option=com_etsmap&task=export&format=pdf&layout=list&systems
%5B%5D=53 (Accessed: 02 February 2020).
IRENA (2017) Electricity storage and renewables: Costs and markets to 2030 [Online]. Available
from: https://www.irena.org/-
/media/Files/IRENA/Agency/Publication/2017/Oct/IRENA_Electricity_Storage_Costs_2017.pdf
(Accessed: 14 November 2019).
ISPT (2018) Power to ammonia. Feasibility study for the value chains and business cases to produce
CO2-free ammonia suitable for various market applications, Amersfoort, Netherlands: Institute for Sustainable
Process Technology.
Jacobson, M.Z. (2019) ‘The health and climate impacts of carbon capture and direct air capture’,
Energy and Environmental Science, 12 (1), 3567–74.
Kalamaras, C.M. and Efstathiou, A.M. (2013) ‘Hydrogen production technologies: Current state and
future developments’, Conference Papers in Energy, 1 (1), pp. 1–9.
Kanman, E. and Jonsson, H. (2001) ‘Including oxidization of ammonia in the eutrophication impact
category’, The International Journal of Life Cycle Assessment, 6 (29), pp. 29–33.
Kim, H.S., et al. (2020) ‘Current catalyst technology of Selective Catalytic Reduction (SCR) for NOx
removal in South Korea’, Catalysts, 10 (1), pp. 1–36.
Kim, J.N., Chue, K.T., Cho, S.H., and Kim, J.D. (2006) ‘Production of high-purity nitrogen from air by
pressure swing adsorption on zeolite X’, Separation Science and Technology, 30 (3), pp. 347–68.
Kobayashi, H., Hayakawa, A., Somarathne, K.D.K.A., and Okafor, E.C. (2019) ‘Science and
technology of ammonia combustion’, Proceedings of the Combustion Institute, 37 (1), pp. 109–33.
Kraemer, S. (2018) ‘Missing link for a solar hydrogen is … ammonia?’, PhysOrg, 9 January, pp. 1–
4.
Kyriakou, V., Garagounis, I., Vourros, A., Vasileiou, E., and Stoukides, M. (2019) ‘An electrochemical
Haber-Bosch process’, Joule, 4 (1), pp. 1-17.
Lan, R. and Tao, S. (2014) ‘Ammonia as a suitable fuel for fuel cells’, Frontiers in Energy Research, 2
(35), 1–4.
Lasocki, J. (2018) ‘Ammonia and conventional engine fuels: Comparative environmental impact
assessment’, E3S Web of Conferences, 22 (1), pp. 1–8.
Lee, I.Y., Kim, S.D., Hwang, C.S., Kim, S.R., and Park, S.W. (2016) ‘Effects of liquid ammonia
treatment on the physical properties of knit fabric’, Materials Science and Engineering, 141 (1), 1–8.
Leung, D.Y.C., Caramanna, G., and Maroto-Valer, M.M. (2014) ‘An overview of current status of
carbon dioxide capture and storage technologies’, Renewable and Sustainable Energy Reviews, 39
(1), pp. 426–43.
Luckow, P. et al. (2015) 2015 Carbon dioxide price forecast, Cambridge, MA: Synapse Energy
Economics, Inc.
Mazzanti, G. and Marzinotto, M. (2013) Extruded cables for high-voltage direct-current transmission:
Advances in research and development, New York, NY: Wiley-IEEE Press.
McEnaney, E.M. et al. (2017) ‘Ammonia synthesis from N2 and H2O using a lithium cycling
electrification strategy at atmospheric pressure’, Energy and Environmental Science, 10 (7), pp.
1621–30.
39
The contents of this paper are the authors’ sole responsibility. They do not necessarily represent the views
of the Oxford Institute for Energy Studies or any of its Members.](https://image.slidesharecdn.com/ammonia-as-a-storage-solution-for-future-decarbonized-systems-el-42-241220080732-af182e95/85/Ammonia-as-a-storage-solution-for-future-decarbonized-systems-EL-42-pptx-40-320.jpg)
![Mehmeti, A., Angelis-Dimakis, A., Arampatzis, G., McPhail, S.J., and Ulgiati, S. (2018) ‘Life cycle
assessment and water footprint of hydrogen production methods: From conventional to emerging
technologies’, Environments, 5 (1), pp. 1–19.
Modak, J.M. (2002) ‘Haber process for ammonia synthesis’, Resonance, 7 (1), pp. 69–77.
Negovanovic, M., Kricak, L., Milanovic, S., Dokic, N., and Simic, N. (2015) ‘Ammonium nitrate
explosion hazards’, Underground Mining Engineering, 27 (1), pp. 49–63.
Nemanic, V. (2019) ‘Hydrogen permeation barriers: Basic requirements, materials selection,
deposition methods, and quality evaluation’, Nuclear Materials and Energy, 19 (1), pp. 451–7.
New York State Department of Health (2004) The facts about ammonia. General information [Online].
Available from:
https://www.health.ny.gov/environmental/emergency/chemical_terrorism/docs/ammonia_general.pdf
(Accessed: 09 October 2020).
Nitrogen+Syngas (2018) Sustainable ammonia for food and power [Online]. Available from:
https://www.protonventures.com/wp-content/uploads/2018/09/NS-354-Small-scale-plant-design-
PROTON-VENTURES-3-1.pdf (Accessed: 14 February 2020).
Nomura, S. et al. (2010) ‘Technical and cost evaluation on SMES for electric power
compensation’,
IEEE Transactions on Applied Superconductivity, 20 (1), pp. 1373–8.
Nozari, H. and Karabeyoglu, A. (2016) ‘NOx emission analysis and flame stabilization of ammonia-
hydrogen-air premixed flames’, NH3 Fuel Conference 2016, Koc University, 22 August. Istanbul: NH3
Fuel Association.
Omura, A. (2012) ‘Enhanced temperature variability in high-altitude climate change’, Theoretical and
Applied Climatology, 110 (4), pp. 499–508.
Paksoy, H.O. (2007) Thermal energy storage for sustainable energy consumption: Fundamentals,
case studies and design, New York, NY: Springer.
Patil, A., Laumans, L., and Vrijenhoef, H. (2014) ‘Solar to ammonia – via Proton’s NFuel units’,
Procedia Engineering, 83 (2), pp. 322–7.
Pattabathula, V. and Richardson, J. (2016) ‘Introduction to ammonia production’, Chemical
Engineering Progress, 9 (1), pp. 69–75.
Perinelli, D.R. et al. (2019) ‘Quaternary ammonium leucine-based surfactants: The effect of a benzyl
group on physicochemical properties and antimicrobial activity’, Pharmaceutics, 11 (287), pp. 1–11.
Philibert, C. (2017) Producing ammonia and fertilizers: New opportunities from renewables. Paris,
France: International Energy Agency.
Pfromm, P. (2017) ‘Towards sustainable agriculture: Fossil-free ammonia’, Journal of Renewable and
Sustainable Energy, 9 (1), pp. 1–11.
PG&E (2018) Resolution E-4949 [Online]. Available from:
https://docs.cpuc.ca.gov/PublishedDocs/Published/G000/M238/K048/238048767.PDF (Accessed: 14
November 2019).
PV Magazine (2019) Dubai confirms Saudi’s ACWA won 900 MW solar project tender with $
0.016953/kWh bid [Online]. Available from: https://www.pv-magazine.com/2019/11/22/dubai-confirms-
saudis-acwa-won-900-mw-solar-project-tender-with-0-016953-kwh-
bid/?utm_source=Bibblio&utm_campaign=Internal (Accessed: 13 February 2020).
PV Magazine (2020) Qatar’s 800 MW tender draws world record solar power price of $0.01567/kWh
[Online]. Available from: https://www.pv-magazine.com/2020/01/23/qatars-800-mw-pv-tender-saw-
world-record-final-price-0-01567-kwh/ (Accessed: 03 February 2020).
40
The contents of this paper are the authors’ sole responsibility. They do not necessarily represent the views
of the Oxford Institute for Energy Studies or any of its Members.](https://image.slidesharecdn.com/ammonia-as-a-storage-solution-for-future-decarbonized-systems-el-42-241220080732-af182e95/85/Ammonia-as-a-storage-solution-for-future-decarbonized-systems-EL-42-pptx-41-320.jpg)
![Rao, C.N.R. and Dey, S. (2017) ‘Solar thermochemical splitting of water to generate hydrogen’,
PNAS, 114 (51), pp. 13385–93.
Ray, A. (2015) ‘Cryogenic separation of atmospheric air in a typical air separation unit (ASU) using
Hampson–Linde cycle’, International Journal of Engineering and Technical Research, 3 (12), pp. 81–
4.
Renewable Energy World (2019) Why lithium-ion technology is poised to dominate the energy storage
future [Online]. Available from: https://www.renewableenergyworld.com/2019/04/03/why-lithiumion-
technology-is-poised-to-dominate-the-energy-storage-future/ (Accessed: 19 November 2019).
Revankar, S.T. (2019) ‘Nuclear hydrogen production’, in: Storage and hybridization of nuclear energy,
Amsterdam: Elsevier, pp. 49–117.
Rivard, E., Trudeau, M., and Zaghib, K. (2019) ‘Hydrogen storage for mobility: A review’, MDPI, 12
(1973), pp. 1–22.
Royal Society (2020) Ammonia: Zero-carbon fertiliser, fuel and energy store, London, UK: The Royal
Society.
Rutberg, P.G. et al. (2015) ‘Conversion of methane by CO2 + H2O + CH4 plasma’, Applied Energy, 148 (1), pp.
159–68.
Sahafzadeh, M., Ataei, A., Tahouni, N., and Panjeshahi, M.H. (2013) ‘Integration of a gas turbine with
an ammonia process for improving energy efficiency’, Applied Thermal Engineering, 58 (1–2), pp.
594–604.
Scott, K. (2019) ‘Introduction to electrolysis, electrolysers and hydrogen production’, in:
Electrochemical methods for hydrogen production, London, UK: Royal Society of Chemistry, pp. 1–
27.
Shtyrlin, N. et al. (2016) ‘Synthesis and antibacterial activity of quaternary ammonium 4-
deoxypyridoxine derivatives’, BioMed Research International, 1 (1), pp. 1–8.
SINTEF (2015) Cost reduction strategies for PEM electrolysis [Online]. Available from:
https://www.sintef.no/contentassets/1ac5d74dbeac4e5ea19aa3079df0997a/02-02_anderson-
proton.pdf/ (Accessed: 30 December 2019).
Siemens (2017) ‘Green Ammonia REFUEL Kickoff Meeting, August 17, Denver Elfriede Simon, CT
REE STS’ https://arpa-e.energy.gov/sites/default/files/04c%20Denver-Green%20Ammonia-Siemens-
final.pdf.
Smith, A.R. and Klosek, J. (2001) ‘A review of air separation technologies and their integration with
energy conversion processes’, Fuel Processing Technology, 70 (1), pp. 115–34.
Soloveichik, G. (2019) ‘Electrochemical synthesis of ammonia as a potential alternative to the Haber–
Bosch process’, Nature Catalysis, 2 (1), pp. 377–80.
Stanford News (2019) Stanford study casts doubt on carbon capture [Online]. Available from:
https://news.stanford.edu/2019/10/25/study-casts-doubt-carbon-capture/ (Accessed: 19 January
2020).
Stonergy (2019) Underground storage of hydrogen in salt caverns [Online]. Available from:
http://www.energnet.eu/sites/default/files/3-Hevin-Underground%20Storage%20H2%20in%20Salt.pdf
(Accessed: 06 October 2020).
Successful Farming (2020) Fertilizer prices fall to lowest levels in a decade, economist says [Online].
Available from: https://www.agriculture.com/news/crops/fertilizer-prices-fall-to-lowest-levels-in-a-
decade-economist-says (Accessed: 24 April 2020).
41
The contents of this paper are the authors’ sole responsibility. They do not necessarily represent the views
of the Oxford Institute for Energy Studies or any of its Members.](https://image.slidesharecdn.com/ammonia-as-a-storage-solution-for-future-decarbonized-systems-el-42-241220080732-af182e95/85/Ammonia-as-a-storage-solution-for-future-decarbonized-systems-EL-42-pptx-42-320.jpg)
![UCL (2018) Ammonia toxicity [Online]. Available from:
https://www.ucl.ac.uk/~ucbcdab/urea/amtox.htm (Accessed: 04 December 2019).
US Department of Agriculture (2019) USDA Market News [Online]. Available from:
https://www.ams.usda.gov/market-news (Accessed: 05 April 2020).
US Department of Energy (2006) Potential roles of ammonia in a hydrogen economy [Online].
Available from:
https://www.energy.gov/sites/prod/files/2015/01/f19/fcto_nh3_h2_storage_white_paper_2006.pdf
(Accessed: 04 December 2019).
US Department of Energy (2010) Alternatives to electricity for transmission and annual-scale firming
storage for diverse, stranded, renewable energy resources: Hydrogen and ammonia [Online].
Available from: https://www.osti.gov/etdeweb/servlets/purl/21396853 (Accessed: 27 November
2019).
US Department of Energy (2018) A review of emerging energy storage technologies [Online].
Available from:
https://www.energy.gov/sites/prod/files/2018/06/f53/EAC_A%20Review%20of%20Emerging%20Ener
gy%20Storage%20Technologies%20%28June%202018%29.pdf (Accessed: 08 August 2019).
US Department of Energy (2019) DOE Technical Targets for Hydrogen Production from Electrolysis
[Online]. Available from: https://www.energy.gov/eere/fuelcells/doe-technical-targets-hydrogen-
production-electrolysis (Accessed: 19 January 2020).
US Department of Energy (2020) Hydrogen storage – basics [Online]. Available from:
https://www.energy.gov/eere/fuelcells/hydrogen-storage-basics-0 (Accessed: 06 October 2020).
US Geological Survey (2017) Nitrogen statistics and information [Online]. Available from:
https://www.usgs.gov/centers/nmic/nitrogen-statistics-and-information (Accessed: 12 December
2019).
Valera-Medina, A. et al. (2018) ‘Ammonia for power’, Progress in Energy and Combustion Science,
69 (1), 63–102.
Verhelst, S. et al. (2011) ‘Electricity powering combustion: Hydrogen engines’, Proceedings of the
IEEE, 100 (2), pp. 427–39.
Vrijenhoef, J.P. (2017) Opportunities for small scale ammonia production. London, UK: International
Fertiliser Society.
Walker, G. (2008) Solid-state hydrogen storage, Cambridge, UK: Woodhead Publishing.
Wang, G., Mitsos, A., and Marquardt, W. (2017) ‘Conceptual design of ammonia-based energy
storage system: System design and time-invariant performance’, AlChE Journal, 7 (17), pp. 1–80.
Weber, J. et al. (2018) ‘Impact of climate change on backup energy and storage needs in wind-
dominated power systems in Europe’, PLoS One, 13 (8), pp. 1–20.
Wilkinson, I. (2017) The role of “green” ammonia in decarbonizing energy systems: Practical
demonstration and economic considerations [Online]. Available from:
https://nh3fuelassociation.org/2017/09/26/the-role-of-green-ammonia-in-decarbonising-energy-
systems-practical-demonstration-and-economic-considerations/ (Accessed: 05 April 2020).
World Bank (2020) Carbon Pricing Dashboard [Online]. Available from:
https://carbonpricingdashboard.worldbank.org/ (Accessed: 02 February 2020).
World Energy Council (2016) World Energy Resources 2016 [Online]. Available from:
https://www.worldenergy.org/assets/images/imported/2016/10/World-Energy-Resources-Full-report-
2016.10.03.pdf (Accessed: 17 January 2020).
42
The contents of this paper are the authors’ sole responsibility. They do not necessarily represent the views
of the Oxford Institute for Energy Studies or any of its Members.](https://image.slidesharecdn.com/ammonia-as-a-storage-solution-for-future-decarbonized-systems-el-42-241220080732-af182e95/85/Ammonia-as-a-storage-solution-for-future-decarbonized-systems-EL-42-pptx-43-320.jpg)
![World Energy Council (2019) World Energy Scenarios 2019 [Online]. Available from:
https://www.worldenergy.org/assets/downloads/Scenarios_Report_FINAL_for_website.pdf (Accessed:
30 December 2019).
Yang, J., Weng, W., and Xiao, W. (2019) ‘Electrochemical synthesis of ammonia in molten salts’,
Journal of Energy Chemistry, 43 (1), pp. 195–207.
Ye, L., Nayak-Luke, R., Banares-Alcantara, R., and Tsang, E. (2017) ‘Reaction: “Green” ammonia
production’, Chem, 3 (5), pp. 712–14.
43
The contents of this paper are the authors’ sole responsibility. They do not necessarily represent the views
of the Oxford Institute for Energy Studies or any of its Members.](https://image.slidesharecdn.com/ammonia-as-a-storage-solution-for-future-decarbonized-systems-el-42-241220080732-af182e95/85/Ammonia-as-a-storage-solution-for-future-decarbonized-systems-EL-42-pptx-44-320.jpg)


