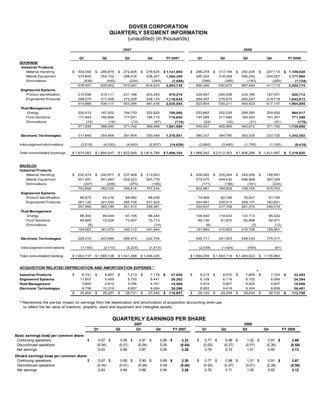
During the fourth quarter of 2008:
- The company repurchased 10 million shares at an average price of $46.15 per share, completing its $500 million share repurchase program.
- It acquired one company for $3.9 million to boost its Fluid Management segment.
- It sold a line of business for a $7.5 million gain in its Electronic Technologies segment.
- It incurred tax expenses of $28 million related to prior tax matters and discontinued operations.
CBS Corporation reported financial results for the fourth quarter and full year of 2008. Revenues for the fourth quarter were $3.5 billion, down 6% from the prior year. Adjusted OIBDA was $590.7 million for the quarter, down from $849.8 million in the previous year. For the full year, revenues were $14 billion, down 1% from 2007. Adjusted OIBDA for the full year was $2.8 billion, lower than the $3.18 billion reported in 2007. The company also announced a reduction in its quarterly dividend from $0.27 to $0.05 per share.
U.S. Bancorp reported record net income for the second quarter of 2005 of $1.121 billion, an 8.1% increase from the second quarter of 2004. Key factors contributing to increased earnings included strong growth in fee-based revenue across most categories, lower credit costs, and reduced tax expenses. However, net interest income declined slightly due to margin compression from tighter credit spreads and changes in asset/liability management. Overall, the results demonstrated continued strong performance and returns, with loan growth, improving credit quality, and investments positioned to further enhance the business.
This document provides financial information for the company including operating income by segment, net income, income from continuing operations, total stockholders' equity on both a book value and adjusted basis, debt ratios, and return on equity. It includes this information for both the first quarter of 2008 compared to 2007 as well as full year 2007 compared to 2006.
allstate Quarterly Investor Information 2003 4th Earnings Press Release finance7
Allstate reported strong financial results for Q4 2003 and full year 2003. Net income increased 71% for Q4 and 138.5% for the full year compared to the previous periods. Operating income also increased significantly. For Q4, property-liability underwriting income increased 272% due to higher premiums and continued favorable loss trends, partially offset by higher catastrophe losses. Allstate also increased its quarterly dividend by 22% and added $1 billion to its share repurchase program. The company expects continued momentum and profitability in 2004.
HSBC reported financial results for the first half of 2008. While total operating income increased slightly, pre-tax profits decreased 28% to $10.2 billion due to a 58% rise in loan impairment charges. Net income attributable to shareholders fell 29% to $7.7 billion. However, HSBC maintained a strong capital position with tier 1 and total capital ratios of 8.8% and 11.9% respectively. The company also announced a 6% increase in its interim dividend and the completion of the sale of its regional bank network in France.
1) TCF Financial Corporation reported first quarter 2009 diluted earnings per share of $0.17, down from $0.38 in the first quarter of 2008. Net income for the quarter was $26.6 million, down 43.8% from the prior year.
2) Total deposits increased by over $1 billion compared to the previous quarter due to successful marketing strategies, however this excess liquidity lowered the net interest margin to 3.66%.
3) Banking fees declined from the prior year due to lower transaction volumes, while the leasing business saw a 4.3% revenue increase. Card revenues were flat with the prior periods.
Nordnet reported increased operating income and profit after tax for 2010 compared to 2009. However, earnings per share were down slightly. For 2011, Nordnet plans cost reductions of 15% to secure goals and visions in light of decreased market activity. Measures include reducing consultants, marketing investments, and potentially reducing staff. Nordnet also reported highlights for 2010 such as successful integrations and new products, and goals to double revenues by 2013 while maintaining operating margins.
Northrop Grumman reported third quarter 2008 results, including a 6% increase in sales to $8.4 billion and a 4% increase in earnings from continuing operations to $509 million compared to the third quarter of 2007. Earnings per share from continuing operations increased 6% to $1.50. Based on the strong results, Northrop Grumman raised its full year 2008 guidance for earnings from continuing operations to a range of $5.10 to $5.20 per share. New business awards totaled $11.5 billion, resulting in a record backlog of $70.1 billion.
Bank Of America Fourth Quarter 2008 Resultsearningsreport
Bank of America reported a loss of $1.8 billion for the fourth quarter of 2008. The results were negatively impacted by $4.6 billion in capital markets dislocation charges and a $8.5 billion provision for credit losses, which included a $3 billion increase in loan loss reserves. Despite the loss, pre-provision profits were up in most primary businesses from the third quarter of 2008. Total average deposits grew by $34.3 billion since the prior quarter. The company also raised capital through a common equity offering and funds from the Troubled Asset Relief Program.
The document provides an earnings presentation for Sallie Mae for the second quarter of 2008. It summarizes key financial metrics including core earnings per share of $0.27, net income of $156 million, and net interest margin of 1.28%. It also discusses liquidity positions, financing activity, segment earnings details, and provides a reconciliation of GAAP to core earnings per share. The presentation outlines long term objectives around asset quality, productivity, capitalization and quality earnings.
This document summarizes Raytheon's financial results for the fourth quarter and full year of 2008. Key points include: Raytheon reported solid financial results for Q4 and full year 2008, with record backlog of $38.9 billion; Q4 sales were $6.1 billion and adjusted EPS was $1.13; Full year sales grew 9% to $23.2 billion and adjusted EPS grew 23% to $4.06; Raytheon reaffirmed its financial guidance for 2009 and expects continued growth.
This document summarizes Bank of America's second quarter 2009 results. It reported net income of $3.2 billion and diluted EPS of $0.33. Revenue was $33.1 billion. Provision for credit losses was $13.4 billion as the allowance was strengthened for continued economic deterioration. Large items impacting earnings included gains from the sale of China Construction Bank shares and a merchant processing business, but losses from derivative adjustments and capital markets disruption charges. The company continued operating in a challenging economic environment.
CIT Group Inc. reported quarterly and annual financial results. For the quarter, net earnings were $134.7 million and net operating earnings were $157.1 million. Credit quality metrics like delinquencies and charge-offs were slightly higher than the previous quarter. The commercial paper program was re-launched at $4.7 billion outstanding and new bank credit facilities were completed, improving the company's funding and liquidity position. Origination volumes increased compared to the previous quarter across most business units.
U.S. Bancorp reported net income of $1,090 million for Q1 2008, down slightly from $1,130 million in Q1 2007. Earnings per share were $0.62, down 1.6% from the prior year. The results were impacted by a $492 million gain from the Visa IPO, $253 million in impairment charges, and $192 million in increased credit loss provisions. Net interest income was up 9.8% to $1,830 million due to loan and securities growth and a higher net interest margin of 3.55%. Noninterest income rose 18.6% to $2,044 million, reflecting organic fee income growth of 7.3% and
This document provides a consolidated report and financial highlights for FirstEnergy Corp for the 4th quarter of 2007. Some key points:
- Normalized non-GAAP earnings per share for Q4 2007 were $0.90 compared to $0.84 in Q4 2006.
- GAAP earnings per share for Q4 2007 were $0.88 compared to $0.85 in Q4 2006.
- Normalized non-GAAP earnings for 2007 were $4.23 per share, near the top of guidance range.
- 2008 earnings guidance range is $4.15 to $4.35 per share.
This document provides an agenda and financial overview for ITW's Q2 2003 conference call. Key points include:
- Revenue increased 5.3% to $2.56B in Q2 2003 compared to Q2 2002. Operating income rose 5.9% and margins were flat.
- Engineered Products North America saw a 3% revenue decline and 14.2% operating income decline due to weakness in construction and auto.
- Engineered Products International had 20.1% revenue growth and 16.2% operating income growth driven by acquisitions and foreign exchange.
- Specialty Systems North America reported a 4.5% revenue decline but a 4.1% increase in operating income
This document provides a consolidated report for FirstEnergy Corp.'s third quarter of 2007. Some key highlights include:
- Normalized non-GAAP earnings were $1.32 per share for Q3 2007 compared to $1.42 per share for Q3 2006.
- GAAP earnings were $1.36 per share for Q3 2007 compared to $1.41 per share for Q3 2006.
- Earnings guidance for 2007 was revised to $4.15 to $4.25 per share from the previous range of $4.05 to $4.25 per share.
- GAAP earnings for 2007 were $577 million, or $1.35 per diluted share, compared to $572 million, or $1.36 per diluted share in 2006. Ongoing earnings were $1.43 per diluted share for 2007 compared to $1.30 in 2006.
- Higher 2007 ongoing earnings were attributed to higher electric and gas margins from rate increases and sales growth, partially offset by higher operating expenses and financing costs.
- The company reaffirmed 2008 earnings guidance of $1.45 to $1.55 per diluted share.
Expeditors International of Washington, 1st08qerfinance39
Expeditors International of Washington, Inc. announced a 12% increase in net earnings for Q1 2008 compared to Q1 2007. Total revenues increased 17% to $1.3 billion while operating income rose 12% to $105.6 million. Diluted earnings per share grew 11% to $0.30. The company saw increases in airfreight, ocean freight, and customs brokerage revenues and feels well positioned for continued market share gains despite economic uncertainty.
- SunTrust reported second quarter earnings of $1.53 per share, down from $1.89 per share in the second quarter of 2007, due to higher loan loss provisions, credit-related expenses, and valuation losses. These factors were partially offset by gains from selling Coca-Cola stock and a non-strategic subsidiary.
- The company completed transactions involving its Coca-Cola stock holdings that increased its regulatory capital ratio by an estimated 68 basis points as of June 30, 2008.
- Credit metrics continued to deteriorate in the quarter, though at a slower pace, with net charge-offs increasing 8.6% and the allowance for loan losses rising to 1.46% of total loans.
Expeditors International of Washington, 3rd01qerfinance39
- Expeditors International of Washington reported a 7% increase in net earnings for Q3 2001 compared to Q3 2000, reaching a record quarterly net of $27.4 million.
- Net revenues increased 4% for Q3 2001 while total revenues decreased 10% and operating income increased 6% compared to the same period last year.
- For the first nine months of 2001, net earnings increased 23% year-over-year, with net revenues up 14% and operating income rising 19%.
Expeditors International of Washington, 4th02qerfinance39
Expeditors International of Washington, Inc. announced quarterly earnings of $35,996,000 for Q4 2002, a 33% increase over Q4 2001. Net revenues increased 30% to $201,602,000. For the full year 2002, net earnings increased 16% to $112,529,000 and net revenues grew 12% to $682,213,000. The company's CEO attributed the strong results to the tremendous efforts of employees in serving customers during an unprecedented period with many disruptions.
U.S. Bancorp reported record net income and earnings per share for the first quarter of 2006. Net income increased 7.7% compared to the first quarter of 2005, to $1,153 million, while earnings per share grew 10.5% to $0.63. Total net revenue increased 6.6% driven by 16.8% growth in noninterest income, which offset a 1.5% decline in net interest income. The provision for credit losses decreased 33.1% and credit quality remained strong.
fifth third bancorp 5033603C-B0AA-45B0-B2AF-058D5B12B34C_FITB_Citi_012809finance28
1) Fifth Third Bank reported a net loss in Q4 2008 and for the full year due to credit deterioration, losses on loans sold or transferred, and a goodwill impairment charge.
2) However, the bank strengthened its credit metrics and risk profile in Q4, and its capital levels remained well above targets.
3) While 2008 was challenging, Fifth Third retained most of its pre-2008 loss absorption capacity and expects capital levels to exceed targets in the difficult economic environment.
This document provides selected financial data for Mohawk Industries for the years 2003-2002. It includes statements of earnings, balance sheets, and cash flows. It also discusses critical accounting policies including inventory valuation, accounts receivable, revenue recognition, goodwill and intangible asset impairments, and deferred taxes. The company acquired Dal-Tile in 2002 and Lees Carpet in 2003 to expand into ceramic tile and commercial carpet markets.
Mohawk Industries is a leading global flooring manufacturer that produces carpet, rugs, ceramic tile, wood, stone, laminate, and other flooring products. In 2006, Mohawk saw sales growth of 19% to $7.9 billion despite challenges in the housing market, due to its recent acquisition of Unilin and price increases. Earnings per share grew 17% compared to 2005. Mohawk invested $166 million in capital expenditures to increase production capacity and enhance customer service. Going forward, Mohawk aims to continue expanding its product categories, customer markets, and global presence through strategic investments and organizational changes.
This document provides an agenda and background information for an investor presentation by Mohawk Industries. The presentation will be held in Charlotte, NC and include management presentations in the morning and tours of two Mohawk manufacturing facilities in the afternoon. Mohawk is a leading flooring manufacturer with market positions across major categories. It aims to deliver consistent financial performance through disciplined management and a vertically integrated business model.
The document is Dover Corporation's 2007 Annual Report. It provides an overview of Dover as a diversified global manufacturer serving industrial and commercial markets. It discusses Dover's realignment into four business segments: Industrial Products, Engineered Systems, Fluid Management, and Electronic Technologies. The realignment enhances sharing of best practices, identifies synergy opportunities, provides direction for acquisitions, and creates leadership opportunities while providing clarity to shareholders.
1) In Q4 2007, the company repurchased 4.8 million shares for $222 million, and a total of 12.4 million shares in 2007 for $591 million. They also repurchased an additional 1 million shares in early 2008 for $40 million.
2) In Q4 2007, the company completed two acquisitions for a total of $97.1 million and seven acquisitions in 2007 for a total of $273.6 million. They also finalized the sale of six businesses in 2007 resulting in an after-tax loss of $17.1 million.
3) Organic revenue growth was 2.3% for 2007, with acquisitions contributing 9.7
Dover Corporation reported record results for the fourth quarter and full year of 2006. Revenue for Q4 2006 increased 20% to $1.7 billion compared to the previous year. For the full year, revenue increased 22% to $6.5 billion. Earnings from continuing operations for Q4 2006 were $156.1 million, a 28% increase over the previous year. For the full year, earnings from continuing operations increased 35% to $603.3 million. The company also reported strong cash flow from operations of over $880 million for the full year, up 57% from 2005.
CBS Corporation reported financial results for the fourth quarter and full year of 2008. Fourth quarter revenues were $3.5 billion, a 6% decrease from the prior year due to lower advertising revenues in a weak economy, partially offset by acquisitions and higher affiliate fees. Full year revenues were $14 billion, a 1% decrease for similar reasons. Operating income and cash flow decreased in the fourth quarter and full year compared to the previous year. The company also announced a reduction in its quarterly dividend from $0.27 to $0.05 per share to strengthen its financial flexibility in the uncertain economic environment.
Expeditors International of Washington, 3rd08qerfinance39
Expeditors International of Washington reported record quarterly profits for Q3 2008. Net earnings increased 15% to $85.6 million compared to $74.3 million in Q3 2007. Total revenues grew 11% to $1.56 billion while operating income rose 13% to $135.4 million. For the first nine months of 2008, net earnings increased 12% to $223.3 million and revenues grew 14% to $4.33 billion, reflecting strong growth across all business segments. The company attributed its strong results to its unique culture and business model focused on long-term profitability rather than short-term gains.
Pfizer Quarterly Corporate Performance - Second Quarter 2008finance5
This document summarizes Pfizer's second quarter 2008 earnings teleconference. It provides financial details such as a 9% increase in reported revenues and a 119% increase in reported net income compared to the previous year. Adjusted income increased 26% and adjusted diluted EPS grew 31%. Cost-reduction initiatives declined due to lower workforce costs. Several drugs were highlighted as top sellers, such as Lipitor, Lyrica, and Celebrex. Pfizer is on track to achieve its target of reducing costs by $1.5-2 billion through cost-cutting initiatives.
The document summarizes Pfizer's second quarter 2008 earnings teleconference. Key highlights include:
- Revenues increased 9% year-over-year to $12.1 billion, and net income increased 119% to $2.8 billion. Adjusted diluted EPS grew 31% to $0.55.
- Cost-reduction initiatives have achieved $1.2 billion in savings to date against a target of $1.5-2 billion for 2008.
- Several major products performed well including Lipitor, Lyrica, Celebrex, and Viagra. Sutent and Chantix revenue also grew.
- Guidance for 2008 was reaffirmed for revenue of $
Northrop Grumman reported financial results for Q3 2008 with the following highlights:
- Earnings per share increased 6% to $1.50 compared to Q3 2007.
- Sales for Q3 2008 increased 6% to $8.4 billion.
- New business awards totaled $11.5 billion, bringing total backlog to a record $70.1 billion.
- Cash from operations increased 35% to $1.4 billion for the quarter.
Raytheon reported strong financial results for Q2 2008, with sales up 11% and EPS up 27%. All business segments saw sales growth. Raytheon increased full-year guidance for sales, EPS, operating cash flow and return on invested capital. The company also reported solid bookings of $6 billion for Q2 and a backlog of $37.5 billion.
Wesco International provides reconciliations of non-GAAP financial measures for the twelve months ended June 30, 2008 and 2007. EBITDA is calculated as income from operations plus depreciation and amortization. Total debt as of June 30, 2008 is $1.245 billion with a financial leverage ratio of 3.0. Free cash flow is calculated as net income plus depreciation and amortization, less changes in working capital items and capital expenditures, resulting in $37.7 million for the three months ended June 30, 2008. Gross profit is calculated by deducting cost of goods sold excluding depreciation from net sales, resulting in a gross margin of 19.5% for the three months
Wesco International provides reconciliations of non-GAAP financial measures for the twelve months ended June 30, 2008 and 2007. EBITDA is calculated as income from operations plus depreciation and amortization. Total debt is calculated as short term debt, current debt, and long term debt. Free cash flow is calculated as net income plus depreciation and amortization, less changes in working capital items and capital expenditures. Gross profit is calculated as net sales minus cost of goods sold excluding depreciation and amortization.
The Progressive Corporation reported strong financial results for the first half of 2004, with net income of $846.3 million, up 46% from the same period in 2003. Net premiums earned grew 18% to $6.3 billion due to a 12% increase in net premiums written. The combined ratio was 84.3%, substantially better than industry averages. Progressive expects growth to slow as fewer customers actively shop for better rates in the stable market conditions. The company made progress on initiatives to improve claims handling and customer service.
The Progressive Corporation reported strong financial results for the second quarter and first half of 2004. Net income increased 35% for the quarter and 46% year-to-date, driven by higher revenues and improved underwriting margins. Underwriting margins increased to 15.7% for the quarter and improved loss frequency and severity trends contributed to profitability. While growth was solid, the company expects new business growth to slow in the current market environment of low rates and less customer shopping. Progressive aims to continue improving customer service and expanding successful initiatives to outperform competitors over the long run.
Fifth Third Bancorp reported a net loss for Q2 2008 due to charges related to leveraged leases. Excluding these charges, pre-tax earnings were up 16% year-over-year due to increases in noninterest income and loans. However, credit costs rose significantly due to deteriorating economic conditions, particularly in real estate loans in Florida and Michigan. In response, Fifth Third raised capital levels and reduced dividends to strengthen its position for potential future losses.
Fifth Third Bancorp reported a net loss for Q2 2008 due to charges related to leveraged leases. Excluding these charges, pre-tax earnings were up 16% year-over-year due to increases in noninterest income and average loans. However, credit costs increased significantly due to deteriorating economic conditions, particularly in real estate loans in Florida and Michigan. In response, Fifth Third raised capital levels and reduced the common dividend to strengthen its position during the economic downturn.
CC Media Holdings reported financial results for Q4 and full year 2008. Q4 revenue was $1.6 billion, down 14% year-over-year, and full year revenue was $6.7 billion, down 3%. Operating expenses grew 3% in Q4 and 5% for the full year. The company reported a large net loss of $4.99 billion in Q4 and $4.6 billion for the full year, primarily due to a $5.3 billion impairment charge. OIBDAN (operating income before depreciation and amortization) declined 50% in Q4 to $309 million and 21% for the full year to $1.8 billion. The company also announced
Pfizer Quarterly Corporate Performance - Third Quarter 2008finance5
This document summarizes Pfizer's third quarter 2008 earnings teleconference. It discusses Pfizer's financial results for the third quarter and year-to-date, including adjusted revenues increasing 2% for both periods. It also reviews significant items that impacted results, progress on Pfizer's cost reduction target, and select product highlights for the quarter.
In the third quarter 2008 earnings teleconference, Pfizer reported increased revenues and earnings compared to the previous year. Adjusted revenues increased 2% to $12.2 billion while adjusted income and EPS grew 5% and 7% respectively. Key products such as Lyrica, Celebrex and Viagra performed well. Pfizer also exceeded its cost reduction target, achieving $1.7 billion in savings through the third quarter with a goal of $2 billion for 2008 versus 2006. Pfizer narrowed its full-year revenue and EPS guidance ranges.
hess 7/30/2008 Estimated Results for the Second Quarter of 2008finance8
Hess Corporation reported its estimated financial results for the second quarter of 2008. Net income was $900 million, up from $557 million in the second quarter of 2007. Oil and gas production increased 4% compared to the second quarter of 2007. Exploration and Production earnings were $1,025 million, up significantly from $505 million in the second quarter of 2007 due to higher oil and gas prices and increased production volumes. However, Marketing and Refining lost $52 million compared to a profit of $122 million in the prior year period due to lower margins and trading results.
hess 1/28/2009 Estimated Results for the Fourth Quarter of 2008finance8
Hess Corporation reported a net loss of $74 million for Q4 2008 compared to net income of $510 million for Q4 2007. Key factors included after-tax dry hole costs of $86 million and foreign exchange losses of $84 million. Oil and gas production was 379,000 barrels per day, down 11,000 barrels from Q4 2007 due to hurricanes. Proved reserves increased to 1.432 billion barrels at the end of 2008, replacing 171% of 2008 production. Marketing and Refining earnings were $152 million, up from $31 million in Q4 2007.
This document summarizes Danaher Corporation's supplemental financial information for quarters ending April 2, 2004 through October 1, 2004 and the nine months ending October 1, 2004. It provides details on free cash flow, the ratio of free cash flow to net earnings, debt to total capital ratios, and net debt to total capital ratios. Free cash flow increased quarter-over-quarter and Danaher Corporation's debt to total capital and net debt to total capital ratios improved from December 31, 2003 to October 1, 2004.
Smurfit-Stone reported a net loss of $19 million for Q1 2005, an improvement from a $66 million loss in Q1 2004. Net sales increased 8% to $2.1 billion. The company continued to face cost pressures from higher energy, fiber, and employee benefit costs which narrowed margins. However, demand was improving and costs were expected to moderate for the rest of the year, leading the company to expect a return to profitability in Q2 2005.
Smurfit-Stone Container Corporation reported second quarter 2005 net income of $1 million, an improvement from a $10 million net loss in the second quarter of 2004. Sales increased to $2.2 billion from $2 billion in the prior year period. For the first half of 2005, the company reported a net loss of $18 million, an improvement from a $76 million net loss in the first half of 2004, with sales of $4.2 billion compared to $4 billion in the prior year. The company expects third quarter results to be negatively impacted by unfavorable pricing trends but anticipates increased packaging demand in the seasonally strong period.
Smurfit-Stone Container Corporation reported a net loss of $229 million or $0.90 per share for Q3 2005, primarily due to a $293 million pretax restructuring charge related to mill closures in Canada and a paper machine closure. Net sales were $2.1 billion, down from $2.2 billion in Q3 2004. For the first nine months of 2005, the net loss was $247 million or $0.97 per share, compared to a net loss of $48 million or $0.19 per share for the same period in 2004. The company expects costs to increase in Q4 due to higher energy and freight expenses, while average corrugated prices are expected to
- Smurfit-Stone Container Corporation reported a net loss of $92 million for Q4 2005 and a net loss of $339 million for the full year 2005.
- Market conditions were unfavorable in the first half of 2005 with declining containerboard and corrugated prices but began to improve in Q4 2005. However, higher energy and fiber costs negatively impacted results.
- The company expects better comparisons going forward as market conditions improve but not meaningful sequential earnings growth in Q1 2006 due to seasonal factors and cost pressures.
- Smurfit-Stone Container Corporation reported a net loss of $64 million for Q1 2006 compared to a net loss of $19 million in Q1 2005.
- Net sales were $2.1 billion for Q1 2006, comparable to Q1 2005. However, higher costs such as energy and freight, as well as lower containerboard and corrugated prices, negatively impacted year-over-year results.
- The company expects results to improve in Q2 2006 but not reach breakeven, and anticipates returning to profitability in Q3 2006 as prices have rebounded and benefits from strategic initiatives continue.
Smurfit-Stone Container Corporation reported financial results for the second quarter of 2006. The company reported a net loss of $44 million compared to net income of $1 million in the second quarter of 2005. Sales were flat at $1.76 billion. For the first half of 2006 the company reported a net loss of $108 million compared to a net loss of $18 million in the first half of 2005, with sales of $3.5 billion, consistent with the previous year. The company's containerboard and corrugated containers segment saw improved operating profits compared to the previous quarter and previous year.
1) Smurfit-Stone Container Corporation reported a net income of $22 million or $0.09 per diluted share for Q4 2006, compared to a net loss of $0.36 per diluted share in Q4 2005.
2) For full year 2006, Smurfit-Stone reported a net loss of $71 million or $0.28 per diluted share, an improvement from a net loss of $339 million or $1.33 per diluted share in 2005.
3) The company exceeded its cost reduction target for 2006 from its strategic initiatives program, achieving $243 million in savings, and expects further meaningful earnings growth in 2007.
1) Smurfit-Stone Container Corporation reported a net loss of $55 million for the first quarter of 2007 compared to a net loss of $0.25 per share in the first quarter of 2006.
2) The company announced plans to close two containerboard mills with 200,000 tons of annual capacity and restart a previously idled paper machine with 170,000 tons of annual capacity to realign its mill system.
3) While costs increased due to higher wood and recycled fiber prices, the company expects improved second quarter results and a return to profitability due to moderating costs and stronger demand.
Smurfit-Stone Container Corporation reported financial results for the second quarter of 2007, with the following highlights:
1) Operating profits were up 59% from the previous quarter and 16% from the second quarter of 2006, driven by higher average prices across major product lines.
2) Sales increased 6% year-over-year to $1.87 billion for the second quarter.
3) The company expects higher mill production and continued price improvements to drive further financial gains in the third quarter.
Smurfit-Stone Container Corporation reported improved financial results in the third quarter of 2007 compared to the previous quarter:
- Adjusted net income nearly doubled from the second quarter, reaching $28 million.
- Strategic initiatives led to $18 million in quarterly benefits from cost reductions.
- Debt was reduced by $328 million through the sale of the Brewton, Alabama mill.
While earnings are expected to decrease in the fourth quarter due to seasonal factors, management expects ongoing benefits from strategic cost cutting initiatives and capital investments to drive continued margin improvements.
Smurfit-Stone Container Corporation reported improved financial results for both the fourth quarter and full year of 2007 compared to 2006. The company exceeded its strategic initiatives target of $420 million in savings for 2007. Higher average prices, operational improvements, and cost savings drove the increased earnings. Smurfit-Stone expects further year-over-year profit growth in the first quarter and full year of 2008.
Madhya Pradesh, the "Heart of India," boasts a rich tapestry of culture and heritage, from ancient dynasties to modern developments. Explore its land records, historical landmarks, and vibrant traditions. From agricultural expanses to urban growth, Madhya Pradesh offers a unique blend of the ancient and modern.
OJP data from firms like Vicinity Jobs have emerged as a complement to traditional sources of labour demand data, such as the Job Vacancy and Wages Survey (JVWS). Ibrahim Abuallail, PhD Candidate, University of Ottawa, presented research relating to bias in OJPs and a proposed approach to effectively adjust OJP data to complement existing official data (such as from the JVWS) and improve the measurement of labour demand.
The Rise and Fall of Ponzi Schemes in America.pptxDiana Rose
Ponzi schemes, a notorious form of financial fraud, have plagued America’s investment landscape for decades. Named after Charles Ponzi, who orchestrated one of the most infamous schemes in the early 20th century, these fraudulent operations promise high returns with little or no risk, only to collapse and leave investors with significant losses. This article explores the nature of Ponzi schemes, notable cases in American history, their impact on victims, and measures to prevent falling prey to such scams.
Understanding Ponzi Schemes
A Ponzi scheme is an investment scam where returns are paid to earlier investors using the capital from newer investors, rather than from legitimate profit earned. The scheme relies on a constant influx of new investments to continue paying the promised returns. Eventually, when the flow of new money slows down or stops, the scheme collapses, leaving the majority of investors with substantial financial losses.
Historical Context: Charles Ponzi and His Legacy
Charles Ponzi is the namesake of this deceptive practice. In the 1920s, Ponzi promised investors in Boston a 50% return within 45 days or 100% return in 90 days through arbitrage of international reply coupons. Initially, he paid returns as promised, not from profits, but from the investments of new participants. When his scheme unraveled, it resulted in losses exceeding $20 million (equivalent to about $270 million today).
Notable American Ponzi Schemes
1. Bernie Madoff: Perhaps the most notorious Ponzi scheme in recent history, Bernie Madoff’s fraud involved $65 billion. Madoff, a well-respected figure in the financial industry, promised steady, high returns through a secretive investment strategy. His scheme lasted for decades before collapsing in 2008, devastating thousands of investors, including individuals, charities, and institutional clients.
2. Allen Stanford: Through his company, Stanford Financial Group, Allen Stanford orchestrated a $7 billion Ponzi scheme, luring investors with fraudulent certificates of deposit issued by his offshore bank. Stanford promised high returns and lavish lifestyle benefits to his investors, which ultimately led to a 110-year prison sentence for the financier in 2012.
3. Tom Petters: In a scheme that lasted more than a decade, Tom Petters ran a $3.65 billion Ponzi scheme, using his company, Petters Group Worldwide. He claimed to buy and sell consumer electronics, but in reality, he used new investments to pay off old debts and fund his extravagant lifestyle. Petters was convicted in 2009 and sentenced to 50 years in prison.
4. Eric Dalius and Saivian: Eric Dalius, a prominent figure behind Saivian, a cashback program promising high returns, is under scrutiny for allegedly orchestrating a Ponzi scheme. Saivian enticed investors with promises of up to 20% cash back on everyday purchases. However, investigations suggest that the returns were paid using new investments rather than legitimate profits. The collapse of Saivian l
University of North Carolina at Charlotte degree offer diploma Transcripttscdzuip
办理美国UNCC毕业证书制作北卡大学夏洛特分校假文凭定制Q微168899991做UNCC留信网教留服认证海牙认证改UNCC成绩单GPA做UNCC假学位证假文凭高仿毕业证GRE代考如何申请北卡罗莱纳大学夏洛特分校University of North Carolina at Charlotte degree offer diploma Transcript
Independent Study - College of Wooster Research (2023-2024) FDI, Culture, Glo...AntoniaOwensDetwiler
"Does Foreign Direct Investment Negatively Affect Preservation of Culture in the Global South? Case Studies in Thailand and Cambodia."
Do elements of globalization, such as Foreign Direct Investment (FDI), negatively affect the ability of countries in the Global South to preserve their culture? This research aims to answer this question by employing a cross-sectional comparative case study analysis utilizing methods of difference. Thailand and Cambodia are compared as they are in the same region and have a similar culture. The metric of difference between Thailand and Cambodia is their ability to preserve their culture. This ability is operationalized by their respective attitudes towards FDI; Thailand imposes stringent regulations and limitations on FDI while Cambodia does not hesitate to accept most FDI and imposes fewer limitations. The evidence from this study suggests that FDI from globally influential countries with high gross domestic products (GDPs) (e.g. China, U.S.) challenges the ability of countries with lower GDPs (e.g. Cambodia) to protect their culture. Furthermore, the ability, or lack thereof, of the receiving countries to protect their culture is amplified by the existence and implementation of restrictive FDI policies imposed by their governments.
My study abroad in Bali, Indonesia, inspired this research topic as I noticed how globalization is changing the culture of its people. I learned their language and way of life which helped me understand the beauty and importance of cultural preservation. I believe we could all benefit from learning new perspectives as they could help us ideate solutions to contemporary issues and empathize with others.
A toxic combination of 15 years of low growth, and four decades of high inequality, has left Britain poorer and falling behind its peers. Productivity growth is weak and public investment is low, while wages today are no higher than they were before the financial crisis. Britain needs a new economic strategy to lift itself out of stagnation.
Scotland is in many ways a microcosm of this challenge. It has become a hub for creative industries, is home to several world-class universities and a thriving community of businesses – strengths that need to be harness and leveraged. But it also has high levels of deprivation, with homelessness reaching a record high and nearly half a million people living in very deep poverty last year. Scotland won’t be truly thriving unless it finds ways to ensure that all its inhabitants benefit from growth and investment. This is the central challenge facing policy makers both in Holyrood and Westminster.
What should a new national economic strategy for Scotland include? What would the pursuit of stronger economic growth mean for local, national and UK-wide policy makers? How will economic change affect the jobs we do, the places we live and the businesses we work for? And what are the prospects for cities like Glasgow, and nations like Scotland, in rising to these challenges?
Confirmation of Payee (CoP) is a vital security measure adopted by financial institutions and payment service providers. Its core purpose is to confirm that the recipient’s name matches the information provided by the sender during a banking transaction, ensuring that funds are transferred to the correct payment account.
Confirmation of Payee was built to tackle the increasing numbers of APP Fraud and in the landscape of UK banking, the spectre of APP fraud looms large. In 2022, over £1.2 billion was stolen by fraudsters through authorised and unauthorised fraud, equivalent to more than £2,300 every minute. This statistic emphasises the urgent need for robust security measures like CoP. While over £1.2 billion was stolen through fraud in 2022, there was an eight per cent reduction compared to 2021 which highlights the positive outcomes obtained from the implementation of Confirmation of Payee. The number of fraud cases across the UK also decreased by four per cent to nearly three million cases during the same period; latest statistics from UK Finance.
In essence, Confirmation of Payee plays a pivotal role in digital banking, guaranteeing the flawless execution of banking transactions. It stands as a guardian against fraud and misallocation, demonstrating the commitment of financial institutions to safeguard their clients’ assets. The next time you engage in a banking transaction, remember the invaluable role of CoP in ensuring the security of your financial interests.
For more details, you can visit https://technoxander.com.
Falcon stands out as a top-tier P2P Invoice Discounting platform in India, bridging esteemed blue-chip companies and eager investors. Our goal is to transform the investment landscape in India by establishing a comprehensive destination for borrowers and investors with diverse profiles and needs, all while minimizing risk. What sets Falcon apart is the elimination of intermediaries such as commercial banks and depository institutions, allowing investors to enjoy higher yields.
Fabular Frames and the Four Ratio ProblemMajid Iqbal
Digital, interactive art showing the struggle of a society in providing for its present population while also saving planetary resources for future generations. Spread across several frames, the art is actually the rendering of real and speculative data. The stereographic projections change shape in response to prompts and provocations. Visitors interact with the model through speculative statements about how to increase savings across communities, regions, ecosystems and environments. Their fabulations combined with random noise, i.e. factors beyond control, have a dramatic effect on the societal transition. Things get better. Things get worse. The aim is to give visitors a new grasp and feel of the ongoing struggles in democracies around the world.
Stunning art in the small multiples format brings out the spatiotemporal nature of societal transitions, against backdrop issues such as energy, housing, waste, farmland and forest. In each frame we see hopeful and frightful interplays between spending and saving. Problems emerge when one of the two parts of the existential anaglyph rapidly shrinks like Arctic ice, as factors cross thresholds. Ecological wealth and intergenerational equity areFour at stake. Not enough spending could mean economic stress, social unrest and political conflict. Not enough saving and there will be climate breakdown and ‘bankruptcy’. So where does speculative design start and the gambling and betting end? Behind each fabular frame is a four ratio problem. Each ratio reflects the level of sacrifice and self-restraint a society is willing to accept, against promises of prosperity and freedom. Some values seem to stabilise a frame while others cause collapse. Get the ratios right and we can have it all. Get them wrong and things get more desperate.
[4:55 p.m.] Bryan Oates
OJPs are becoming a critical resource for policy-makers and researchers who study the labour market. LMIC continues to work with Vicinity Jobs’ data on OJPs, which can be explored in our Canadian Job Trends Dashboard. Valuable insights have been gained through our analysis of OJP data, including LMIC research lead
Suzanne Spiteri’s recent report on improving the quality and accessibility of job postings to reduce employment barriers for neurodivergent people.
Decoding job postings: Improving accessibility for neurodivergent job seekers
Improving the quality and accessibility of job postings is one way to reduce employment barriers for neurodivergent people.
KYC Compliance: A Cornerstone of Global Crypto Regulatory FrameworksAny kyc Account
This presentation explores the pivotal role of KYC compliance in shaping and enforcing global regulations within the dynamic landscape of cryptocurrencies. Dive into the intricate connection between KYC practices and the evolving legal frameworks governing the crypto industry.
Discover the Future of Dogecoin with Our Comprehensive Guidance36 Crypto
Learn in-depth about Dogecoin's trajectory and stay informed with 36crypto's essential and up-to-date information about the crypto space.
Our presentation delves into Dogecoin's potential future, exploring whether it's destined to skyrocket to the moon or face a downward spiral. In addition, it highlights invaluable insights. Don't miss out on this opportunity to enhance your crypto understanding!
https://36crypto.com/the-future-of-dogecoin-how-high-can-this-cryptocurrency-reach/
13 Jun 24 ILC Retirement Income Summit - slides.pptxILC- UK
ILC's Retirement Income Summit was hosted by M&G and supported by Canada Life. The event brought together key policymakers, influencers and experts to help identify policy priorities for the next Government and ensure more of us have access to a decent income in retirement.
Contributors included:
Jo Blanden, Professor in Economics, University of Surrey
Clive Bolton, CEO, Life Insurance M&G Plc
Jim Boyd, CEO, Equity Release Council
Molly Broome, Economist, Resolution Foundation
Nida Broughton, Co-Director of Economic Policy, Behavioural Insights Team
Jonathan Cribb, Associate Director and Head of Retirement, Savings, and Ageing, Institute for Fiscal Studies
Joanna Elson CBE, Chief Executive Officer, Independent Age
Tom Evans, Managing Director of Retirement, Canada Life
Steve Groves, Chair, Key Retirement Group
Tish Hanifan, Founder and Joint Chair of the Society of Later life Advisers
Sue Lewis, ILC Trustee
Siobhan Lough, Senior Consultant, Hymans Robertson
Mick McAteer, Co-Director, The Financial Inclusion Centre
Stuart McDonald MBE, Head of Longevity and Democratic Insights, LCP
Anusha Mittal, Managing Director, Individual Life and Pensions, M&G Life
Shelley Morris, Senior Project Manager, Living Pension, Living Wage Foundation
Sarah O'Grady, Journalist
Will Sherlock, Head of External Relations, M&G Plc
Daniela Silcock, Head of Policy Research, Pensions Policy Institute
David Sinclair, Chief Executive, ILC
Jordi Skilbeck, Senior Policy Advisor, Pensions and Lifetime Savings Association
Rt Hon Sir Stephen Timms, former Chair, Work & Pensions Committee
Nigel Waterson, ILC Trustee
Jackie Wells, Strategy and Policy Consultant, ILC Strategic Advisory Board
13 Jun 24 ILC Retirement Income Summit - slides.pptx
dover 4Q08_Supplement
1. INVESTOR SUPPLEMENT
FOURTH QUARTER AND FULL YEAR 2008
Share Repurchase Program
During the twelve months ended December 31, 2008, the Company repurchased 10,000,000 shares of its
common stock in the open market at an average price of $46.15 per share. As of December 31, 2008, the
Company had completed the purchases of all authorized shares under its $500 million share repurchase
program, which was approved by the Board of Directors in the fourth quarter of 2007.
Acquisitions
During the fourth quarter of 2008, the Company completed one add-on acquisition in the Fluid Management
segment totaling $3.9 million. During 2008, Dover made a total of four add-on acquisitions, totaling $103.8
million, net of cash acquired.
Divestitures
During the fourth quarter of 2008, the Company completed the sale of a line of business resulting in a $7.5
million gain recorded in the Electronic Technologies segment. There was no tax expense recorded in
connection with this disposition.
In addition, during the fourth quarter of 2008, the Company reached final settlement on certain Federal tax
matters related to businesses previously discontinued and sold, which increased tax expense by
approximately $15.0 million. The Company also recognized certain state tax assessments related to
previously sold discontinued operations consistent with Financial Accounting Standards Board Interpretation
No. 48, resulting in additional tax expense of approximately $13.0 million, net of Federal benefit. Finally, the
Company increased its loss provision for the anticipated sale of a discontinued operation by an additional
$21.0 million, for which no tax benefit was recognized.
For the year ended December 31, 2008, in addition to the tax adjustments described above, the Company
recorded adjustments to the carrying value of discontinued operations resulting in a net after-tax loss of
approximately $74.0 million, and recorded net losses from operations of approximately $2.0 million. At year
end 2008, one business remains held for sale in discontinued operations.
Growth Factors
2008
Revenue Growth Q1 Q2 Q3 Q4 FY 2008
Organic 2.7% 5.4% 2.8% -5.7% 1.2%
Net Acquisitions (A) 1.1% 1.3% 0.8% 0.4% 0.8%
Currency translation 3.2% 3.5% 1.8% -3.0% 1.4%
7.0% 10.2% 5.4% -8.3% 3.4%
(A) - Acquisition Growth before the disposition of a line of business was 1.8%, 2.0%, 1.7%, 1.2% and 1.7% in each period, respectively.
2. Cash Flow
The following table is a reconciliation of free cash flow (a non-GAAP measure) with cash flows from operating
activities.
Three Months Ended December 31, Years Ended December 31,
Free Cash Flow (in thousands) 2008 2007 2008 2007
Cash flow provided by operating activities $ 270,353 $ 370,350 $ 1,010,416 $ 927,693
Less: Capital expenditures 42,476 43,842 175,795 173,653
Free cash flow $ 227,877 $ 326,508 $ 834,621 $ 754,040
Free cash flow as a percentage of revenue 13.2% 17.3% 11.0% 10.3%
Free cash flow as a percentage of earnings from continuing operations 120.1% 112.6%
The full year increase in free cash flow reflects higher earnings from continuing operations before
depreciation and amortization and lower tax payments in 2008. In addition, Adjusted Working Capital (a non-
GAAP measure calculated as accounts receivable, plus inventory, less accounts payable) decreased from the
prior year end by $86.0 million, or 6% to $1,275.9 million which reflected a decrease in receivables of $91.0
million, a decrease in inventory of $37.8 million and a decrease in accounts payable of $42.8 million.
Excluding acquisitions, dispositions and the effects of foreign exchange translation, Adjusted Working Capital
would have decreased by $56.3 million, or 4%. “Average Annual Adjusted Working Capital” as a percentage
of revenue (a non-GAAP measure calculated as the five-quarter average balance of accounts receivable, plus
inventory, less accounts payable divided by the trailing twelve months of revenue) decreased to 18.3% at
December 31, 2008 from 18.9% at December 31, 2007 and inventory turns were 7.1 at December 31, 2008
compared to 6.7 at December 31, 2007.
Capitalization
The following table provides a summary reconciliation of total debt and net debt to total capitalization to the
most directly comparable GAAP measures:
At December 31, At December 31,
Net Debt to Total Capitalization Ratio (in thousands) 2008 2007
Current maturities of long-term debt $ 32,194 $ 33,175
Commercial paper and other short-term debt 192,750 605,474
Long-term debt 1,860,729 1,452,003
Total debt 2,085,673 2,090,652
Less: Cash, cash equivalents and short-term investments 826,869 606,105
Net debt 1,258,804 1,484,547
Add: Stockholders' equity 3,792,866 3,946,173
Total capitalization $ 5,051,670 $ 5,430,720
Net debt to total capitalization 24.9% 27.3%
Net debt at December 31, 2008 decreased $225.7 million as a result of cash generated from operations. The
increase in long-term debt was used primarily to fund acquisitions, decrease short-term debt and repurchase
shares in excess of the Company’s available free cash flow. The decrease in net debt to total capitalization,
after $462 million of open market share repurchases, reflects strong free cash flow and net proceeds from
dispositions of $93 million.
Tax Rate
The effective tax rate for continuing operations for the fourth quarter of 2008 was 21.4%, compared to the
prior year rate of 24.6%. The 2008 rate was favorably impacted by benefits recognized for tax positions that
were effectively settled. In addition, the fourth quarter of 2008 had more non-U.S. earnings in low-taxed
overseas jurisdictions when compared to the prior year quarter. The effective tax rate for continuing
operations for each of the twelve month periods ended December 31, 2008 and 2007 was 26.6%.
3. DOVER CORPORATION
CONSOLIDATED STATEMENTS OF EARNINGS
(unaudited) (in thousands, except per share data)
Three Months Ended December 31 Twelve Months Ended December 31
2008 2007 2008 2007
$ 1,726,648 $ 1,883,588 $ 7,568,888 $ 7,317,270
Revenue
Cost of goods and services 1,120,148 1,207,494 4,838,881 4,697,768
606,500 676,094 2,730,007 2,619,502
Gross profit
Selling and administrative expenses 375,378 419,613 1,700,677 1,614,005
231,122 256,481 1,029,330 1,005,497
Operating earnings
Interest expense, net 19,293 22,536 96,037 89,589
Other expense (income), net (3,798) 1,789 (12,726) 3,541
Total interest/other expense, net 15,495 24,325 83,311 93,130
Earnings before provision for income
215,627 232,156 946,019 912,367
taxes and discontinued operations
Provision for income taxes 46,045 57,024 251,261 242,617
169,582 175,132 694,758 669,750
Earnings from continuing operations
Earnings (loss) from discontinued operations, net of tax (48,855) 10,232 (103,927) (8,670)
$ 120,727 $ 185,364 $ 590,831 $ 661,080
Net earnings
Basic earnings (loss) per common share:
Earnings from continuing operations $ 0.91 $ 0.89 $ 3.69 $ 3.33
Earnings (loss) from discontinued operations (0.26) 0.05 (0.55) (0.04)
Net earnings 0.65 0.95 3.13 3.28
Weighted average shares outstanding 185,965 195,932 188,481 201,330
Diluted earnings (loss) per common share:
Earnings from continuing operations $ 0.91 $ 0.89 $ 3.67 $ 3.30
Earnings (loss) from discontinued operations (0.26) 0.05 (0.55) (0.04)
Net earnings 0.65 0.94 3.12 3.26
Weighted average shares outstanding 186,207 197,286 189,269 202,918
Dividends paid per common share $ 0.25 $ 0.20 $ 0.90 $ 0.77
The following table is a reconciliation of the share amounts used in computing earnings per share:
Three Months Ended December 31 Twelve Months Ended December 31
2008 2007 2008 2007
Weighted average shares outstanding - Basic 185,965 195,932 188,481 201,330
Dilutive effect of assumed exercise
of employee stock options 242 1,354 788 1,588
Weighted average shares outstanding - Diluted 186,207 197,286 189,269 202,918
Anti-dilutive shares excluded from diluted EPS computation 6,722 1,635 5,103 3,241
6. DOVER CORPORATION
CONDENSED CONSOLIDATED BALANCE SHEET AND STATEMENT OF CASH FLOWS
(unaudited) (in thousands)
BALANCE SHEET
At December 31, 2008 At December 31, 2007
Assets:
Cash and cash equivalents $ 547,409 $ 606,105
Short-term investments 279,460 -
Receivables, net of allowances 1,013,174 1,104,090
Inventories, net 636,121 673,944
Deferred tax and other current assets 138,022 161,855
Property, plant and equipment, net 872,134 892,237
Goodwill 3,255,566 3,259,729
Intangible assets, net 952,409 1,051,650
Other assets 103,903 167,403
Assets of discontinued operations 69,106 152,757
$ 7,867,304 $ 8,069,770
Liabilities and Stockholders' Equity
Notes payable and current maturities of long-term debt $ 224,944 $ 638,649
Payables and accrued expenses 993,565 1,013,097
Taxes payable and other deferrals 916,077 964,313
Long-term debt 1,860,729 1,452,003
Liabilities of discontinued operations 79,123 55,535
Stockholders' equity 3,792,866 3,946,173
$ 7,867,304 $ 8,069,770
CASH FLOWS Twelve Months Ended December 31,
2008 2007
Operating activities:
Net earnings $ 590,831 $ 661,080
Loss from discontinued operations, net of tax 103,927 8,670
Depreciation and amortization 261,154 243,776
Stock-based compensation 25,246 26,292
Contributions to defined benefit plans (55,361) (22,537)
Net change in assets and liabilities 84,619 10,412
Net cash provided by operating activities of continuing operations 1,010,416 927,693
Investing activities:
Purchase of short-term investments (279,460) -
Proceeds from the sale of property and equipment 13,248 24,195
Additions to property, plant and equipment (175,795) (173,653)
Proceeds from sale of businesses 92,774 90,966
Acquisitions (net of cash and cash equivalents acquired) (103,761) (273,610)
Net cash used in investing activities of continuing operations (452,994) (332,102)
Financing activities:
Increase (decrease) in debt, net (4,995) 317,609
Purchase of treasury stock (466,736) (596,009)
Proceeds from exercise of stock options, including tax benefits 79,898 87,117
Dividends to stockholders (169,071) (154,390)
Net cash used in financing activities of continuing operations (560,904) (345,673)
Effect of exchange rate changes on cash (45,817) 34,175
Net cash used in discontinued operations (9,397) (50,709)
Net increase (decrease) in cash and cash equivalents (58,696) 233,384
Cash and cash equivalents at beginning of period 606,105 372,721
Cash and cash equivalents at end of period $ 547,409 $ 606,105