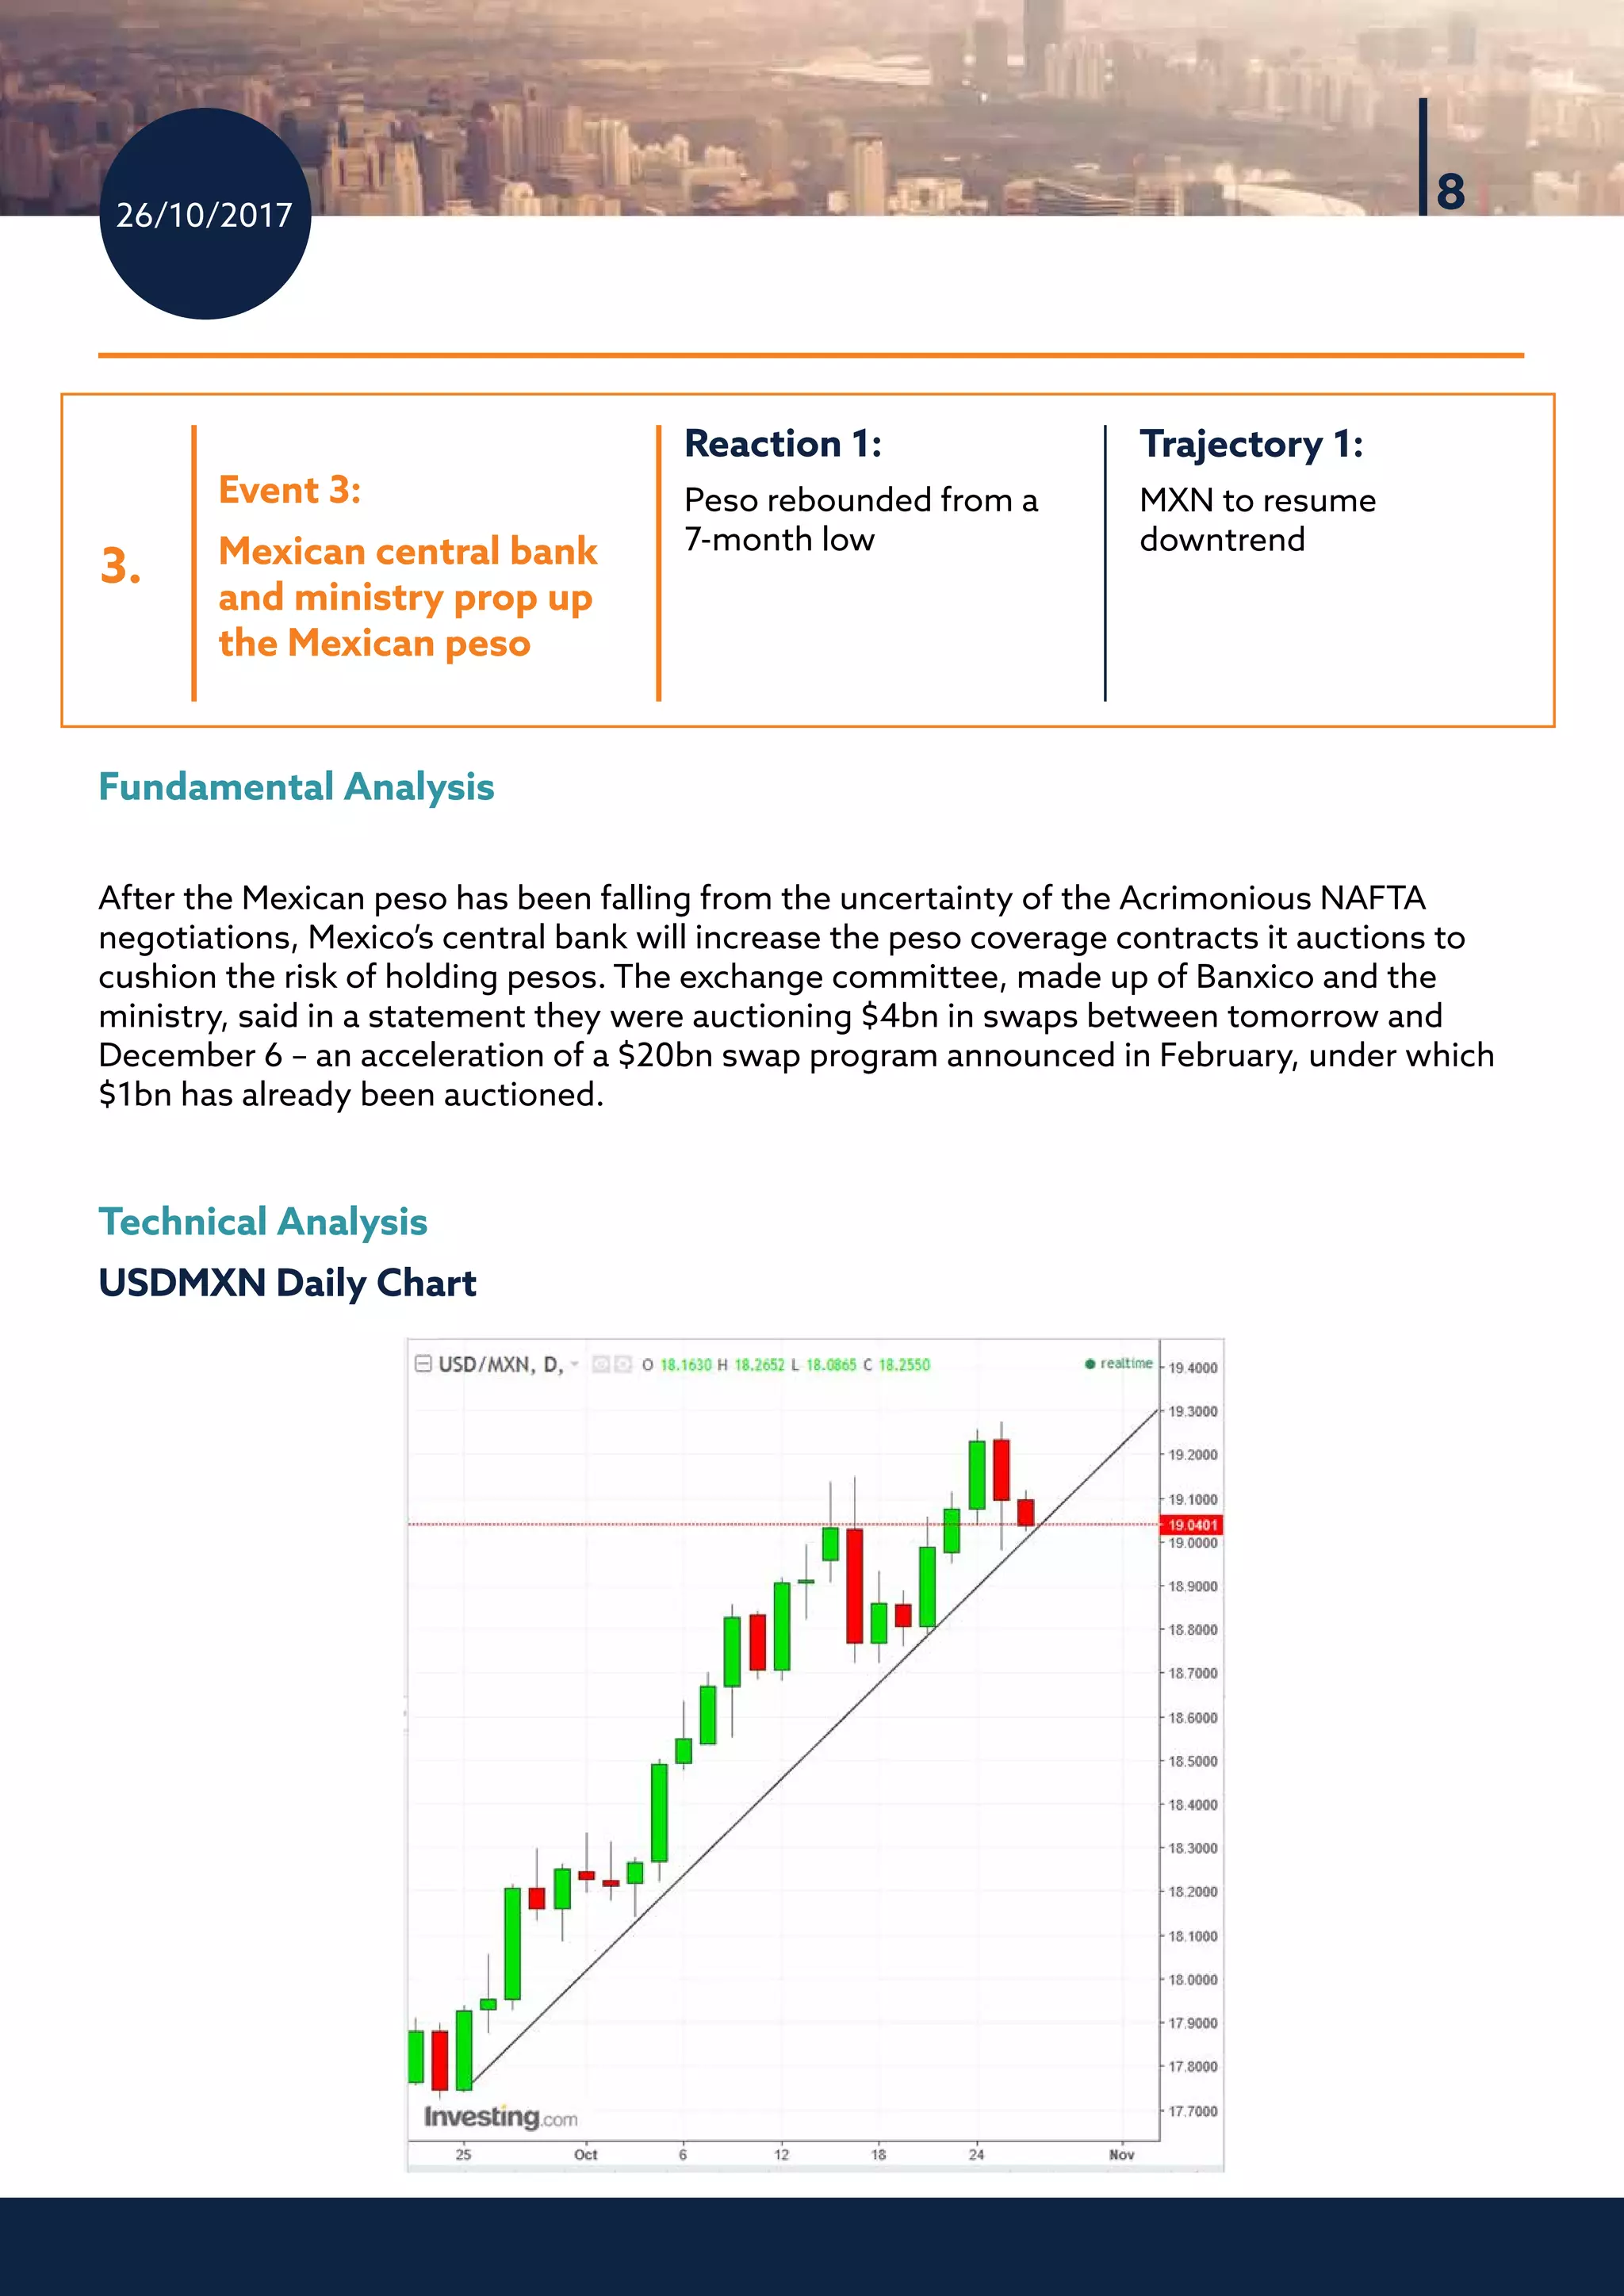
byEvening_tao/Freepik
Read Between the Lines and Connect the Dots!
OneMarket Brief
AllIn
The Daily Market Brief that has everything
News I Analysis I Detailed and Explained Trading Signals I Point-by-Point Trading Strategies I
Market and Trading Education I Trading Tips
Pinchas Cohen is a consultant to companies, offering research analysis, trading
signals, live event coverage and market education. Cohen is Financial Markets
Analysts/Contributing Author to Investing.com - where he writes The Week
Ahead, Opening Bell and Chart of the Day – as well as for The Marker. He is the
Founding Chairman of the Israeli Chamber of Technical Analysts.
Ai1 Objectives
1. Capture the Market Understand the various, often conflicting, market forces.
2. Market Sequence See how these forces form a Cause-Reaction-Trajectory sequence.
3. Market Accessibility Grasp complex topics in simple terms, broadening trade-choices
4. Straightforward Analysis What, why, how to trade
5. Natural Education Increase knowledge while trading, seamlessly.
cohen@ForcastIron.com I linkedin.com/in/pinchas-cohen I +972-54-2559095
26/10/2017
2
Global Stocks Fall with Dollar on Mixed Earnings
and Political Infighting
1.
2.
3.
4.
Market Sequences: Explaining the Moves - Cause -> Effect -> Trajectory
Trajectory 1:	
Real Estate sector is best
positioned sectors to
rally
Trajectory 1:	
Loonie to resume fall
Trajectory 1:	
MXN to resume
downtrend
Trajectory 1:	
Pound to resume uptrend
and yield to resume
downtrend
Reaction 1:
US stocks fell the most in
7 weeks, dollar dropped,
gold advanced
Reaction 1:
Loonie falls
Reaction 1:
Peso rebounded from a
7-month low
Reaction 1:
Pound and Britain’s 10-
year yield gained five
basis points to highest in
nine months.
Event 1:
Mixed corporate
earnings reports,
political infighting
threatened tax reform
Event 2:
Canada’s central
bank warned it would
remain “cautious”
about rate increases
Event 3:
Mexican central bank
and ministry prop up
the Mexican peso
Event 4:
Accelerated UK
growth spurred rate-
hike bets
26/10/2017
3
1.
2.
3.
4.
Upcoming Events
Earnings:
Trajectory :	
Should consensus be
wrong, the Euro should
fall
Trajectory :	
Providing earnings
doesn’t disappoint, the
stock is heading up
Trajectory :	
Disappointing earnings
would retest $940 level -
No Break Down
Trajectory :	
If earnings disappoint,
retest $940 level – No
Break Down
Consensus:
to announce a reduction
in the size of its monthly
bond buying
Consensus:
EPS $1.44 vs $1.44 YoY
Consensus:
EPS $8.32, Revenue
$27.17 billion
Consensus:
EPS $-0.02 vs $0.52 YoY
Upcoming event 1:
ECB policy meeting
upcoming event 2:
UPS earnings report –
after market
Event 3:
Google’s Alphabet
earnings report - after
market
Event 4:
Amazon earnings
report – after market
26/10/2017
4
Fundamental Analysis
Stocks have advanced with a series of fresh highs on positive reports and a reawakened faith
in President Donald Trump’s tax reform, after his budget was approved by the senate.
The impetus that drove stocks to new heights has been put to question, after public criticism
of Trump by Republican Senators Bob Corker and Jeff Flake will make tax reform a lot harder
to pass and weak corporate results caused selloffs in Chipotle Mexican Grill Inc and Advanced
Micro Devices.
Of all the sub-indexes of the S&P the one best positioned to rally is the Real Estate sector.
While Housing starts tumble in September, single-family homes are on the rise. That’s a
sign of an economic recovery, as more families can afford to move into a house, which are
generally purchased, out of an apartment, which are generally rented. Houses also require
more labor to construct, contributing more to the economic growth.
The Real Estate sector also acts as a potential hedge against inflation, due to the tendency of
real estate values and rents to increase when inflation is increasing. As the Fed is becoming
increasingly more confident in rising inflation, investors are likely to invest in Real Estate if
only for its hedging quality.
Technical Analysis
Real Estate Select
Sector SPDR Daily Chart
Market Sequences breakdown: Cause -> Effect -> Trajectory
1.
Trajectory 1:	
Real Estate sector is best
positioned sectors to
rally
Reaction 1:
US stocks fell the most in
7 weeks, dollar dropped,
gold advanced
Event 1:
Mixed corporate
earnings reports,
political infighting
threatened tax reform
26/10/2017
5
The ETF has been trading within a rising channel since Trump won the election and Animal
Spirit has been reawakened. While the S&P 500 Index fell 0.47 percent, led by a 0.99 percent
decline in the Industrials growth sector, Real Estate – although not a defensive stock but
a cyclical stock (goes up when the economy is growing and down when the economy is
shrinking, like Industrials) – fell only 0.25 percent, the second smallest decline only to the
Health Care sector, which is noteworthy considering it’s a defensive sector.
Rising-Channel
What is it?	 A rising-channel is confines in which an asset was trading in an
uptrend.
How is it formed?	The lower line marking the channel-bottom is plotted along
the lows and the upper line marking the channel-top is plotted along the highs.
What the lines mean? The lower line tracks where buyers’ demand overcame
supply, and the upper line tracks where sellers’ supply overcame demand.
Bottom Line: In a rising channel both buyers and sellers agree that prices
should rise, as both are willing to buy and sell at rising prices, when buyers’
eagerness overcomes that of sellers at those pressure points.
Not only did the sector experience the second smallest decline (and absolute smallest decline
among the growth sectors), but it formed a bullish hammer. After the bears managed to push
the price below the channel-bottom, the bulls regained control and pushed the price back
up. The candle’s bullish implication is compounded as it also confirmed the integrity of the
uptrend line, suggesting prices will resume their uptrend.
Trading Strategies
Target Price
1.	 $33.12, October 13 high
2.	 $33.46, September 11 high
Conservative
traders would wait on
a long position for a
stronger confirmation
with a higher close.
Moderate traders would
wait on a long for a return-
move to have an entry closer
to the support and reduce
the potential loss, if the price
breaks down.
Aggressive traders may go
long now, placing the stop-
loss under the 32.13 hammer
low.
26/10/2017
6
Risk-Reward - How to Get on the Good Side of Statistics
A common trader mistake is to cut wins (on fear of exiting on a loss) and run
with their losses – deluding themselves into believing that the price will turn
around, thereby digging an ever-deeper hole. Traders must do the opposite:
cut losses (to avoid losses...duh) and run with their wins to milk the trend,
cover losses and cost of trading and allow themselves the chance to incur a
profit.
A classic risk-reward ratio is 1:3. In this way, a loss won’t take your account to
the point of no return, and a win will make up for several small losses. That
means when traders select a stop-loss, they should factor in the target profit,
consider its viability, then stick to it. Otherwise, they fall back into a negative
risk-reward ratio, by increasing risk and limiting reward probabilities. These
catch up with you.
Fundamental Analysis
The BOC puts rate hikes on hold amid weak inflation and the threat of collapse of the North
American Free Trade negotiations. The Loonie is sold off.
2.
Trajectory 1:	
Loonie to resume fall
Reaction 1:
Loonie falls
Event 2:
Canada’s central
bank warned it would
remain “cautious”
about rate increases
26/10/2017
7
Technical Analysis
USDCAD Daily Chart
The USDCAD broke the downtrend line since May on October 20 and yesterday registered
not just a higher price than the former, August, peak, but even a close above the former
peak’s high, completing the required minimum series of two peaks and troughs in an upward
direction to officially call it an uptrend.
Trading Strategies
Target Prices
1.	 1.3000 – psychological resistance
2.	 1.3200 – July congestion resistance
3.	 1.3400 0 June congestion resistance and implied target by price action Between August
and October in the opposite direction.
Conservative traders might
wait on a long position for a
dip toward the new uptrend
line – probably at 1.26, with
the support of the October
congestion, to limit risk.
Moderate traders
would be happy with
a dip to 1.27, before
going in.
Aggressive traders may
go in now, provided they
can afford a stop-loss to the
discussed levels or risk a loss.
26/10/2017
8
Fundamental Analysis
After the Mexican peso has been falling from the uncertainty of the Acrimonious NAFTA
negotiations, Mexico’s central bank will increase the peso coverage contracts it auctions to
cushion the risk of holding pesos. The exchange committee, made up of Banxico and the
ministry, said in a statement they were auctioning $4bn in swaps between tomorrow and
December 6 – an acceleration of a $20bn swap program announced in February, under which
$1bn has already been auctioned.
Technical Analysis
USDMXN Daily Chart
3.
Trajectory 1:	
MXN to resume
downtrend
Reaction 1:
Peso rebounded from a
7-month low
Event 3:
Mexican central bank
and ministry prop up
the Mexican peso
26/10/2017
9
Even after the announcement of intervention and the ensuing rally of the Mexican peso, the
USDMXN stopped its declined-on top of the uptrend line since September 25, suggesting a
continued rally. The only technical impediment is the former, April resistance of 19.2 – 19.29
level.
Trading Strategies
Target Price:
1. Yesterday’s high
2. 19.2962, April high price
Fundamental Analysis
The UK’s economy had higher than expected growth in the three months to September -
increasing the chances of a rise in interest rates in November.
Gross domestic product (GDP) for the quarter rose by 0.4%, compared with 0.3% in each of
2017’s first two quarters, according to latest Office for National Statistics figures.
Economists said the figures were a green light for a rate rise next week.
If it happens, it will be the first rise since 5 July 2007.
The financial markets are now indicating an 84% probability that rates will rise from their
current record low of 0.25% when the Bank of England’s Monetary Policy Committee (MPC)
meets on 2 November.
Conservative traders
may want to avoid a trade
that is subject to the gaping
uncertainty of NAFTA
negotiations, as well as up
against the resistance since
April
Moderate traders may
want to wait for the price
to demonstrate its uptrend
remains intact even after
Mexico’s intervention, with a
peak higher than yesterday’s
19.2781 high, before entering a
long position
Aggressive
traders may may
enter a long now,
with a stop-loss
beneath yesterday’s
high.
4.
Trajectory 1:	
Pound to resume uptrend
and yield to resume
downtrend
Reaction 1:
Pound and Britain’s 10-
year yield gained five
basis points to highest in
nine months.
Event 4:
Accelerated UK
growth spurred rate-
hike bets
26/10/2017
10
Technical Analysis
GBPUSD Daily Chart
The pound has been trading within an uptrend for over a year. A dip is a good buying
opportunity, as the trend is expected to resume. The next two tests would be the October 13,
1.3338 high, followed by the September 20, 1.3658 high.
Trading Strategies
Conservative
traders may wait
on a long for a
confirmation of the
trend’s integrity,
with either a fall
to the uptrend line
and to rebound or
with registering a
higher price than the
October 13, 1.3292.
Moderate traders may
may wait for a decline to
the 1.2100 congestion
support – and perhaps
a demonstration that
it retains support,
depending on risk
aversion - before entering
a long.
Aggressive traders who are
willing to stay days-to-weeks
in a position may enter a long
now, with a stop-loss beneath (1)
1.3100 or (2) 1.300, depending on
affordability, but traders who go
for the big wins, such as the price
retesting the 1.3650, September
high a 3-percent move, they need
to withstand volatility.
26/10/2017
11
Rising-Channel
What is it?	 A rising-channel is confines in which an asset was trading in an
uptrend.
How is it formed?	The lower line marking the channel-bottom is plotted along
the lows and the upper line marking the channel-top is plotted along the
highs.
What the lines mean? The lower line tracks where buyers’ demand overcame
supply, and the upper line tracks where sellers’ supply overcame demand.
Bottom Line: In a rising channel both buyers and sellers agree that prices
should rise, as both are willing to buy and sell at rising prices, when buyers’
eagerness overcomes that of sellers at those pressure points.
Earnings
The Fundamentals
FactSet median EPS expectation: $1.45, while Estimize expects $1.49, versus $1.44 YoY, with a
revenue of $15.62 billion according to FactSet and $15.75 for Estimize - versus $14.93 billion YoY.
Three Main Questions:
1.	 Is management lowballing guidance to avoid disappointing investors?
2.	 What impact does acquisition of Whole Foods hold?
3.	 Will UPS handle the holiday peak?
UPS Chief Financial Operator Richard Peretz said last quarter, as has he gave guidance for the
rest of the year, that “Earnings per share should be relatively flat when compared with last
year.” As well, a stronger dollar and higher fuel prices offset profits. Finally, a shorter quarter,
of one day, should hurt profits too. It’s almost like a kid giving excuses why he’s about to miss
the shot.
While the Whole Foods acquisition is expected to contribute to the bottom line next year,
it’s unclear what the impact will be for the remainder of the year. Piper Jaffray expects a $1.4
billion contribution for the month of September.
UPS, as well as FedEx, underestimated holiday volumes in 2013, for which they
overcompensated in 2014. Both, being understaffed as well as overstaffed, hurt profits. Will
UPS get it right this year?
26/10/2017
12
The Technicals
UPS Daily Chart
After a contusing Flag-pattern, the supply-demand dynamic formed a continuing symmetrical-
triangle. An upside breakout would signal a resumption of the prior uptrend.
Recently, there has been an unusual high volume of large blocks of call options, as far as into
2020. This looks like footprints of large institutions, suggesting smart-money demand is
rising.
26/10/2017
13
There is one more thing to consider.
UPS Weekly Chart
The price stopped at the
December 2016 high. This
could prove a catalyst
for a significant jump or
a reversal, depending on
whether buyers overcome
everyone who remembers
the 15-percent fall that
followed that price within
the next 7 months and
thinks the move may repeat
itself.
Trading Strategies
Terms & Disclaimer
The sale of this document is to its buyer’s company alone. No part of this document is to be
reproduced, emailed or shared outside of the client’s company, without written permission.
This market brief was written by Pinchas Cohen, who does not hold an investment advice
license and is therefore not written for retail investors. All investments have many risks
and can lose principal in the short and long term. The information contained herein is not
guaranteed, does not purport to be comprehensive and is strictly for information purposes
only. Anyone reading this agrees, understands and accepts that they take upon themselves all
responsibility for all their investment decisions and to do their own due diligence, and not to
hold Pinchas Cohen responsible. Pinchas Cohen does not assume any liability for any direct,
indirect or consequential loss that may result from the reliance by any person upon any such
information or opinions. Any expressions of opinions are subject to change without notice.
This document does not constitute an offer or an invitation to trade or invest. No party should
treat any of the contents herein as advice.
Conservative traders
would wait for further
evidence the uptrend’s
integrity with a peak higher
than the October 2, $120.80
high, then wait for a dip.
Moderate traders may
wait for a close above the
Shooting-Star’s $120.43
resistance, before joining in
a long position.
Aggressive traders may
go long now, with a stop-
loss beneath the $119 level.
26/10/2017
14
26/10/2017
15

Allinone26 10 17

  • 1.
    byEvening_tao/Freepik Read Between theLines and Connect the Dots! OneMarket Brief AllIn The Daily Market Brief that has everything News I Analysis I Detailed and Explained Trading Signals I Point-by-Point Trading Strategies I Market and Trading Education I Trading Tips Pinchas Cohen is a consultant to companies, offering research analysis, trading signals, live event coverage and market education. Cohen is Financial Markets Analysts/Contributing Author to Investing.com - where he writes The Week Ahead, Opening Bell and Chart of the Day – as well as for The Marker. He is the Founding Chairman of the Israeli Chamber of Technical Analysts. Ai1 Objectives 1. Capture the Market Understand the various, often conflicting, market forces. 2. Market Sequence See how these forces form a Cause-Reaction-Trajectory sequence. 3. Market Accessibility Grasp complex topics in simple terms, broadening trade-choices 4. Straightforward Analysis What, why, how to trade 5. Natural Education Increase knowledge while trading, seamlessly. cohen@ForcastIron.com I linkedin.com/in/pinchas-cohen I +972-54-2559095
  • 2.
    26/10/2017 2 Global Stocks Fallwith Dollar on Mixed Earnings and Political Infighting 1. 2. 3. 4. Market Sequences: Explaining the Moves - Cause -> Effect -> Trajectory Trajectory 1: Real Estate sector is best positioned sectors to rally Trajectory 1: Loonie to resume fall Trajectory 1: MXN to resume downtrend Trajectory 1: Pound to resume uptrend and yield to resume downtrend Reaction 1: US stocks fell the most in 7 weeks, dollar dropped, gold advanced Reaction 1: Loonie falls Reaction 1: Peso rebounded from a 7-month low Reaction 1: Pound and Britain’s 10- year yield gained five basis points to highest in nine months. Event 1: Mixed corporate earnings reports, political infighting threatened tax reform Event 2: Canada’s central bank warned it would remain “cautious” about rate increases Event 3: Mexican central bank and ministry prop up the Mexican peso Event 4: Accelerated UK growth spurred rate- hike bets
  • 3.
    26/10/2017 3 1. 2. 3. 4. Upcoming Events Earnings: Trajectory : Shouldconsensus be wrong, the Euro should fall Trajectory : Providing earnings doesn’t disappoint, the stock is heading up Trajectory : Disappointing earnings would retest $940 level - No Break Down Trajectory : If earnings disappoint, retest $940 level – No Break Down Consensus: to announce a reduction in the size of its monthly bond buying Consensus: EPS $1.44 vs $1.44 YoY Consensus: EPS $8.32, Revenue $27.17 billion Consensus: EPS $-0.02 vs $0.52 YoY Upcoming event 1: ECB policy meeting upcoming event 2: UPS earnings report – after market Event 3: Google’s Alphabet earnings report - after market Event 4: Amazon earnings report – after market
  • 4.
    26/10/2017 4 Fundamental Analysis Stocks haveadvanced with a series of fresh highs on positive reports and a reawakened faith in President Donald Trump’s tax reform, after his budget was approved by the senate. The impetus that drove stocks to new heights has been put to question, after public criticism of Trump by Republican Senators Bob Corker and Jeff Flake will make tax reform a lot harder to pass and weak corporate results caused selloffs in Chipotle Mexican Grill Inc and Advanced Micro Devices. Of all the sub-indexes of the S&P the one best positioned to rally is the Real Estate sector. While Housing starts tumble in September, single-family homes are on the rise. That’s a sign of an economic recovery, as more families can afford to move into a house, which are generally purchased, out of an apartment, which are generally rented. Houses also require more labor to construct, contributing more to the economic growth. The Real Estate sector also acts as a potential hedge against inflation, due to the tendency of real estate values and rents to increase when inflation is increasing. As the Fed is becoming increasingly more confident in rising inflation, investors are likely to invest in Real Estate if only for its hedging quality. Technical Analysis Real Estate Select Sector SPDR Daily Chart Market Sequences breakdown: Cause -> Effect -> Trajectory 1. Trajectory 1: Real Estate sector is best positioned sectors to rally Reaction 1: US stocks fell the most in 7 weeks, dollar dropped, gold advanced Event 1: Mixed corporate earnings reports, political infighting threatened tax reform
  • 5.
    26/10/2017 5 The ETF hasbeen trading within a rising channel since Trump won the election and Animal Spirit has been reawakened. While the S&P 500 Index fell 0.47 percent, led by a 0.99 percent decline in the Industrials growth sector, Real Estate – although not a defensive stock but a cyclical stock (goes up when the economy is growing and down when the economy is shrinking, like Industrials) – fell only 0.25 percent, the second smallest decline only to the Health Care sector, which is noteworthy considering it’s a defensive sector. Rising-Channel What is it? A rising-channel is confines in which an asset was trading in an uptrend. How is it formed? The lower line marking the channel-bottom is plotted along the lows and the upper line marking the channel-top is plotted along the highs. What the lines mean? The lower line tracks where buyers’ demand overcame supply, and the upper line tracks where sellers’ supply overcame demand. Bottom Line: In a rising channel both buyers and sellers agree that prices should rise, as both are willing to buy and sell at rising prices, when buyers’ eagerness overcomes that of sellers at those pressure points. Not only did the sector experience the second smallest decline (and absolute smallest decline among the growth sectors), but it formed a bullish hammer. After the bears managed to push the price below the channel-bottom, the bulls regained control and pushed the price back up. The candle’s bullish implication is compounded as it also confirmed the integrity of the uptrend line, suggesting prices will resume their uptrend. Trading Strategies Target Price 1. $33.12, October 13 high 2. $33.46, September 11 high Conservative traders would wait on a long position for a stronger confirmation with a higher close. Moderate traders would wait on a long for a return- move to have an entry closer to the support and reduce the potential loss, if the price breaks down. Aggressive traders may go long now, placing the stop- loss under the 32.13 hammer low.
  • 6.
    26/10/2017 6 Risk-Reward - Howto Get on the Good Side of Statistics A common trader mistake is to cut wins (on fear of exiting on a loss) and run with their losses – deluding themselves into believing that the price will turn around, thereby digging an ever-deeper hole. Traders must do the opposite: cut losses (to avoid losses...duh) and run with their wins to milk the trend, cover losses and cost of trading and allow themselves the chance to incur a profit. A classic risk-reward ratio is 1:3. In this way, a loss won’t take your account to the point of no return, and a win will make up for several small losses. That means when traders select a stop-loss, they should factor in the target profit, consider its viability, then stick to it. Otherwise, they fall back into a negative risk-reward ratio, by increasing risk and limiting reward probabilities. These catch up with you. Fundamental Analysis The BOC puts rate hikes on hold amid weak inflation and the threat of collapse of the North American Free Trade negotiations. The Loonie is sold off. 2. Trajectory 1: Loonie to resume fall Reaction 1: Loonie falls Event 2: Canada’s central bank warned it would remain “cautious” about rate increases
  • 7.
    26/10/2017 7 Technical Analysis USDCAD DailyChart The USDCAD broke the downtrend line since May on October 20 and yesterday registered not just a higher price than the former, August, peak, but even a close above the former peak’s high, completing the required minimum series of two peaks and troughs in an upward direction to officially call it an uptrend. Trading Strategies Target Prices 1. 1.3000 – psychological resistance 2. 1.3200 – July congestion resistance 3. 1.3400 0 June congestion resistance and implied target by price action Between August and October in the opposite direction. Conservative traders might wait on a long position for a dip toward the new uptrend line – probably at 1.26, with the support of the October congestion, to limit risk. Moderate traders would be happy with a dip to 1.27, before going in. Aggressive traders may go in now, provided they can afford a stop-loss to the discussed levels or risk a loss.
  • 8.
    26/10/2017 8 Fundamental Analysis After theMexican peso has been falling from the uncertainty of the Acrimonious NAFTA negotiations, Mexico’s central bank will increase the peso coverage contracts it auctions to cushion the risk of holding pesos. The exchange committee, made up of Banxico and the ministry, said in a statement they were auctioning $4bn in swaps between tomorrow and December 6 – an acceleration of a $20bn swap program announced in February, under which $1bn has already been auctioned. Technical Analysis USDMXN Daily Chart 3. Trajectory 1: MXN to resume downtrend Reaction 1: Peso rebounded from a 7-month low Event 3: Mexican central bank and ministry prop up the Mexican peso
  • 9.
    26/10/2017 9 Even after theannouncement of intervention and the ensuing rally of the Mexican peso, the USDMXN stopped its declined-on top of the uptrend line since September 25, suggesting a continued rally. The only technical impediment is the former, April resistance of 19.2 – 19.29 level. Trading Strategies Target Price: 1. Yesterday’s high 2. 19.2962, April high price Fundamental Analysis The UK’s economy had higher than expected growth in the three months to September - increasing the chances of a rise in interest rates in November. Gross domestic product (GDP) for the quarter rose by 0.4%, compared with 0.3% in each of 2017’s first two quarters, according to latest Office for National Statistics figures. Economists said the figures were a green light for a rate rise next week. If it happens, it will be the first rise since 5 July 2007. The financial markets are now indicating an 84% probability that rates will rise from their current record low of 0.25% when the Bank of England’s Monetary Policy Committee (MPC) meets on 2 November. Conservative traders may want to avoid a trade that is subject to the gaping uncertainty of NAFTA negotiations, as well as up against the resistance since April Moderate traders may want to wait for the price to demonstrate its uptrend remains intact even after Mexico’s intervention, with a peak higher than yesterday’s 19.2781 high, before entering a long position Aggressive traders may may enter a long now, with a stop-loss beneath yesterday’s high. 4. Trajectory 1: Pound to resume uptrend and yield to resume downtrend Reaction 1: Pound and Britain’s 10- year yield gained five basis points to highest in nine months. Event 4: Accelerated UK growth spurred rate- hike bets
  • 10.
    26/10/2017 10 Technical Analysis GBPUSD DailyChart The pound has been trading within an uptrend for over a year. A dip is a good buying opportunity, as the trend is expected to resume. The next two tests would be the October 13, 1.3338 high, followed by the September 20, 1.3658 high. Trading Strategies Conservative traders may wait on a long for a confirmation of the trend’s integrity, with either a fall to the uptrend line and to rebound or with registering a higher price than the October 13, 1.3292. Moderate traders may may wait for a decline to the 1.2100 congestion support – and perhaps a demonstration that it retains support, depending on risk aversion - before entering a long. Aggressive traders who are willing to stay days-to-weeks in a position may enter a long now, with a stop-loss beneath (1) 1.3100 or (2) 1.300, depending on affordability, but traders who go for the big wins, such as the price retesting the 1.3650, September high a 3-percent move, they need to withstand volatility.
  • 11.
    26/10/2017 11 Rising-Channel What is it? A rising-channel is confines in which an asset was trading in an uptrend. How is it formed? The lower line marking the channel-bottom is plotted along the lows and the upper line marking the channel-top is plotted along the highs. What the lines mean? The lower line tracks where buyers’ demand overcame supply, and the upper line tracks where sellers’ supply overcame demand. Bottom Line: In a rising channel both buyers and sellers agree that prices should rise, as both are willing to buy and sell at rising prices, when buyers’ eagerness overcomes that of sellers at those pressure points. Earnings The Fundamentals FactSet median EPS expectation: $1.45, while Estimize expects $1.49, versus $1.44 YoY, with a revenue of $15.62 billion according to FactSet and $15.75 for Estimize - versus $14.93 billion YoY. Three Main Questions: 1. Is management lowballing guidance to avoid disappointing investors? 2. What impact does acquisition of Whole Foods hold? 3. Will UPS handle the holiday peak? UPS Chief Financial Operator Richard Peretz said last quarter, as has he gave guidance for the rest of the year, that “Earnings per share should be relatively flat when compared with last year.” As well, a stronger dollar and higher fuel prices offset profits. Finally, a shorter quarter, of one day, should hurt profits too. It’s almost like a kid giving excuses why he’s about to miss the shot. While the Whole Foods acquisition is expected to contribute to the bottom line next year, it’s unclear what the impact will be for the remainder of the year. Piper Jaffray expects a $1.4 billion contribution for the month of September. UPS, as well as FedEx, underestimated holiday volumes in 2013, for which they overcompensated in 2014. Both, being understaffed as well as overstaffed, hurt profits. Will UPS get it right this year?
  • 12.
    26/10/2017 12 The Technicals UPS DailyChart After a contusing Flag-pattern, the supply-demand dynamic formed a continuing symmetrical- triangle. An upside breakout would signal a resumption of the prior uptrend. Recently, there has been an unusual high volume of large blocks of call options, as far as into 2020. This looks like footprints of large institutions, suggesting smart-money demand is rising.
  • 13.
    26/10/2017 13 There is onemore thing to consider. UPS Weekly Chart The price stopped at the December 2016 high. This could prove a catalyst for a significant jump or a reversal, depending on whether buyers overcome everyone who remembers the 15-percent fall that followed that price within the next 7 months and thinks the move may repeat itself. Trading Strategies Terms & Disclaimer The sale of this document is to its buyer’s company alone. No part of this document is to be reproduced, emailed or shared outside of the client’s company, without written permission. This market brief was written by Pinchas Cohen, who does not hold an investment advice license and is therefore not written for retail investors. All investments have many risks and can lose principal in the short and long term. The information contained herein is not guaranteed, does not purport to be comprehensive and is strictly for information purposes only. Anyone reading this agrees, understands and accepts that they take upon themselves all responsibility for all their investment decisions and to do their own due diligence, and not to hold Pinchas Cohen responsible. Pinchas Cohen does not assume any liability for any direct, indirect or consequential loss that may result from the reliance by any person upon any such information or opinions. Any expressions of opinions are subject to change without notice. This document does not constitute an offer or an invitation to trade or invest. No party should treat any of the contents herein as advice. Conservative traders would wait for further evidence the uptrend’s integrity with a peak higher than the October 2, $120.80 high, then wait for a dip. Moderate traders may wait for a close above the Shooting-Star’s $120.43 resistance, before joining in a long position. Aggressive traders may go long now, with a stop- loss beneath the $119 level.
  • 14.
  • 15.