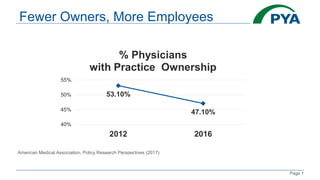
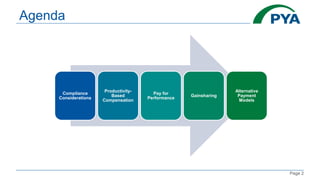
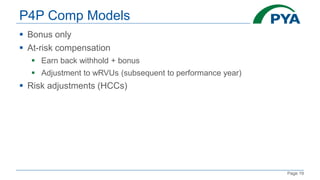
August 26-29, 2018
Presented by:
Martie Ross
Principal
Aligning Incentives: Value-Based
Physician Compensation Models
ASSOCIATION OF HEALTHCARE INTERNAL AUDITOR’S
37TH ANNUAL CONFERENCE
Page 1
Fewer Owners, More Employees
American Medical Association, Policy Research Perspectives (2017)
53.10%
47.10%
40%
45%
50%
55%
2012 2016
% Physicians
with Practice Ownership
Page 2
Agenda
Compliance
Considerations
Productivity-
Based
Compensation
Pay for
Performance
Gainsharing
Alternative
Payment
Models
1. Compliance Considerations
Page 4
Stark Law
Anti-Kickback Statute
Tax Exemption
Fair Market Value
Commercial
Reasonableness
Not Taking Referrals
into Account
Page 5
FMV vs. CR
Fair Market
Value
• Bona fide bargaining between well-informed parties not
otherwise positioned to generate business for other
party
Commercial
Reasonableness
• Reasonable and necessary for arrangement’s legitimate
business purposes
Page 6
Demonstrating FMV and CR
Step 1: Facts
• Ascertain key facts surrounding arrangement
Step 2: Other Factors
• Identify circumstances potentially relevant to FMV/CR
Step 3: Benchmarking
• Identify multiple objective data for benchmarking
• MGMA, AMGA, Sullivan Cotter, TW, others
Step 4: Approach
• Identify proper approach for determining FMV
Step 5: Conclusion
• Reconcile approaches and prepare written report
2. Productivity-Based Compensation
Page 8
Two Ends of the Spectrum
 Fixed salary
 Retire in place
 Small # of “prestige” organizations
 Eat what you kill
 Revenue minus expenses
 Percentage of revenue
 Productivity
 Work Relative Value Units (wRVUs) x conversion factor
Page 9
Comp > Revenue
 MGMA: on average, hospitals lose $190,000/year/employed
physician
 Salary, bonus, overhead, insurance
 Qui tam cases
 Tuomey - $72.4 million
 North Broward Hospital District - $69.5 million
 Citizens Medical Center - $21.8 million
 Memorial Health - $9.8 million
 “Secret” contribution margin reports
 Share cost data with physicians?
 Physicians as defendants
Page 10
Administrative Duties
 Demonstrable organizational need/benefit
 At initiation and subsequent review
 Defined scope of physician responsibilities
 Hourly rate of pay
 Typically less than clinical time
 Documentation of time
 “Stacking”
 Impact on total compensation
3. Pay For Performance
Page 12
MGMA: P4P Trends
0%
5%
10%
15%
20%
25%
30%
35%
40%
45%
50%
2012 2015
100% Salary 15% 8%
100% Productivity2 47% 16%
Salary + Incentive 19% 31%
Production + Incentive 16% 42%
Page 13
Best Practices?
 No comprehensive survey on incentive structures or metrics; rely on
anecdotal information
 Period of experimentation
 Sparse research on incentives’ impact on physician behavior
 MSSP results
 General principles of behavioral economics
Page 14
Willingness To Change
…physicians reported that they would be willing to
accept sizeable proportions of compensation at risk, if required to.
The median reported proportion is
15 percent, meaning one-half of surveyed physicians would put
more than 15 percent of compensation at risk and the other half
would accept less than 15 percent.
Deloitte 2016 Physician Survey – Value-Based Care
“
”
Page 15
P4P Metrics
• HEDIS
• NQF
• PQRS/QPP
Quality
• CG-CAHPS
• Net promoter score
Patient
Experience
• Extended practice hours
• Care team supervision (PCHM)
Access to
Care
• Committee/initiative participation
• Referral loop
Good
Citizenship
Page 16
Merit-Based Incentive Payment System
Quality Cost
Improvement
Activities
Advancing Care
Information
− Report quality
measures
− Scored based on
relative
performance
(historic
benchmarks)
− Practice
transformation
− Patient-
centeredness
− Promote expanded
adoption of EHRs
− Improve utilization
and sharing of
electronic health
information
− Drive efficient care
− Providers forced to
accept risk
60%
0%
15%
25%
60%15%
25%
2017 Performance Year 2018 Performance Year
Impacts 2019 Payments Impacts 2020 Payments
Page 17
MIPS Payment Adjustments
2019 2022+2020 2021
+4%
-4%
+5%
-5%
+7%
-7%
+9%
-9%
Performance
Threshold
• Upside scaling factor up to 3x stated amount
• Top performers share $500 million bonus pool (not to exceed 10% of Part B charges)
Page 18
Individual patients
Employment/acquisitions
Provider networks
Medical staff credentialing
Professional liability insurance
Broader Impact
Page 19
P4P Comp Models
 Bonus only
 At-risk compensation
 Earn back withhold + bonus
 Adjustment to wRVUs (subsequent to performance year)
 Risk adjustments (HCCs)
Page 20
FMV Considerations
Real work vs. busy work
• Physician (vs. staff) effort
• Relevance to practice, value to organization
• Benchmarks
Bonus percentage
• Limited market data
• Use MIPS as a guide
“Stacking” – impact on total compensation
• Same issue as administrative duties
Page 21
Q:
Must physician compensation
take into consideration
quality, outcomes, patient
experience, and/or efficiency?
Commercially Reasonable?
3. Gainsharing
Page 23
Co-Management and Gainsharing
 Incentivize physician behavior that reduces hospital operating
costs or improves performance
 Reduce readmission/HAI rates
 Improve patient satisfaction scores
 Lower supply costs
 Enhance efficiency
 Reduce LOS
Page 24
Civil Money Penalties
 SSA Section 1128A(b): Hospital cannot incentivize physician
“to reduce or limit services”
 OIG: any reduction or limitation, regardless of medical necessity
 Numerous gainsharing advisory opinions
 October 2014 proposed rule: not an enforcement priority, provided
sufficient safeguards
 MACRA revisions: “to reduce or limit medically necessary
services”
 No implementing regulations from OIG
Page 25
Necessary Safeguards
 Cost-saving measures based on evidence and clinical
outcomes
 External fair market valuation for incentives
 Third-party review of performance and payments
 Patient safety standards
 Stinting on care
 Cherry-picking and lemon-dropping
 Accelerating discharges
 Impact on referrals
 Contribution margin issues
4. Alternative Payment Models
Page 27
APM Framework
Page 28
Progress to Date
One-quarter of commercial plan payments
now flow through Category 3/4 APMs.*
*Health Care Payment Learning & Action Network 2016 Commercial
Payer Survey. Respondents represent over 128-million covered lives, or
nearly 44% of the combined commercial, Medicare Advantage, and Medicaid
markets.
Page 29
Cultural Shift
Incentives Measures Regulators Providers Patients Risk
FFS
Model
 Maximize
Patients
 Maximize
Services
 DRGs and
APCs
 CPTs
 Fraud and
Abuse Laws
 Reimbursement
Rules
 Silos
 Competitors
 Unmanaged
chronic
conditions
 Uninvolved
with care
 Resides
with payer
 Increasing
costs
Incentives Measures Regulators Providers Patients Risk
APMs
and
Value-
Based
 Manage
patient
population
 Coordinate
continuum
of care
 Quality
 Efficiency
 Network
participation
 Continuum
of care
 Collaborate
 Educated
 Engaged
 Moves to
providers
Page 30
APMs and Fraud & Abuse Laws
 Medicare program waivers
 Broad for MSSP; more limited for episodic payments
 If comply with specific requirements, DOJ/OIG will not pursue
enforcement action
 “Automatic” protection for MSSP shared savings distributions
 Broader issue?
 CMS study: current rules hinder APM participation
Page 31
Shared Savings Distributions
 Providers’ hesitancy to rely on Medicare waivers
 Waivers are relatively untested; may be revised at any time
 For non-profits, commercial reasonableness concerns remain
 Commercial arrangements not protected by distribution waivers
Page 32
Principles for APM Valuation
Page 33
SAVE THE DATES!
September 15-18, 2019
AHIA 38th
Annual
Conference
Omni Nashville Hotel
PYA, P.C.
800.270.9629 | www.pyapc.com
Martie Ross
Consulting Principal
(800) 270-9629
mross@pyapc.com

Aligning Incentives: Value-Based Physician Compensation Models

  • 1.
    August 26-29, 2018 Presentedby: Martie Ross Principal Aligning Incentives: Value-Based Physician Compensation Models ASSOCIATION OF HEALTHCARE INTERNAL AUDITOR’S 37TH ANNUAL CONFERENCE
  • 2.
    Page 1 Fewer Owners,More Employees American Medical Association, Policy Research Perspectives (2017) 53.10% 47.10% 40% 45% 50% 55% 2012 2016 % Physicians with Practice Ownership
  • 3.
  • 4.
  • 5.
    Page 4 Stark Law Anti-KickbackStatute Tax Exemption Fair Market Value Commercial Reasonableness Not Taking Referrals into Account
  • 6.
    Page 5 FMV vs.CR Fair Market Value • Bona fide bargaining between well-informed parties not otherwise positioned to generate business for other party Commercial Reasonableness • Reasonable and necessary for arrangement’s legitimate business purposes
  • 7.
    Page 6 Demonstrating FMVand CR Step 1: Facts • Ascertain key facts surrounding arrangement Step 2: Other Factors • Identify circumstances potentially relevant to FMV/CR Step 3: Benchmarking • Identify multiple objective data for benchmarking • MGMA, AMGA, Sullivan Cotter, TW, others Step 4: Approach • Identify proper approach for determining FMV Step 5: Conclusion • Reconcile approaches and prepare written report
  • 8.
  • 9.
    Page 8 Two Endsof the Spectrum  Fixed salary  Retire in place  Small # of “prestige” organizations  Eat what you kill  Revenue minus expenses  Percentage of revenue  Productivity  Work Relative Value Units (wRVUs) x conversion factor
  • 10.
    Page 9 Comp >Revenue  MGMA: on average, hospitals lose $190,000/year/employed physician  Salary, bonus, overhead, insurance  Qui tam cases  Tuomey - $72.4 million  North Broward Hospital District - $69.5 million  Citizens Medical Center - $21.8 million  Memorial Health - $9.8 million  “Secret” contribution margin reports  Share cost data with physicians?  Physicians as defendants
  • 11.
    Page 10 Administrative Duties Demonstrable organizational need/benefit  At initiation and subsequent review  Defined scope of physician responsibilities  Hourly rate of pay  Typically less than clinical time  Documentation of time  “Stacking”  Impact on total compensation
  • 12.
    3. Pay ForPerformance
  • 13.
    Page 12 MGMA: P4PTrends 0% 5% 10% 15% 20% 25% 30% 35% 40% 45% 50% 2012 2015 100% Salary 15% 8% 100% Productivity2 47% 16% Salary + Incentive 19% 31% Production + Incentive 16% 42%
  • 14.
    Page 13 Best Practices? No comprehensive survey on incentive structures or metrics; rely on anecdotal information  Period of experimentation  Sparse research on incentives’ impact on physician behavior  MSSP results  General principles of behavioral economics
  • 15.
    Page 14 Willingness ToChange …physicians reported that they would be willing to accept sizeable proportions of compensation at risk, if required to. The median reported proportion is 15 percent, meaning one-half of surveyed physicians would put more than 15 percent of compensation at risk and the other half would accept less than 15 percent. Deloitte 2016 Physician Survey – Value-Based Care “ ”
  • 16.
    Page 15 P4P Metrics •HEDIS • NQF • PQRS/QPP Quality • CG-CAHPS • Net promoter score Patient Experience • Extended practice hours • Care team supervision (PCHM) Access to Care • Committee/initiative participation • Referral loop Good Citizenship
  • 17.
    Page 16 Merit-Based IncentivePayment System Quality Cost Improvement Activities Advancing Care Information − Report quality measures − Scored based on relative performance (historic benchmarks) − Practice transformation − Patient- centeredness − Promote expanded adoption of EHRs − Improve utilization and sharing of electronic health information − Drive efficient care − Providers forced to accept risk 60% 0% 15% 25% 60%15% 25% 2017 Performance Year 2018 Performance Year Impacts 2019 Payments Impacts 2020 Payments
  • 18.
    Page 17 MIPS PaymentAdjustments 2019 2022+2020 2021 +4% -4% +5% -5% +7% -7% +9% -9% Performance Threshold • Upside scaling factor up to 3x stated amount • Top performers share $500 million bonus pool (not to exceed 10% of Part B charges)
  • 19.
    Page 18 Individual patients Employment/acquisitions Providernetworks Medical staff credentialing Professional liability insurance Broader Impact
  • 20.
    Page 19 P4P CompModels  Bonus only  At-risk compensation  Earn back withhold + bonus  Adjustment to wRVUs (subsequent to performance year)  Risk adjustments (HCCs)
  • 21.
    Page 20 FMV Considerations Realwork vs. busy work • Physician (vs. staff) effort • Relevance to practice, value to organization • Benchmarks Bonus percentage • Limited market data • Use MIPS as a guide “Stacking” – impact on total compensation • Same issue as administrative duties
  • 22.
    Page 21 Q: Must physiciancompensation take into consideration quality, outcomes, patient experience, and/or efficiency? Commercially Reasonable?
  • 23.
  • 24.
    Page 23 Co-Management andGainsharing  Incentivize physician behavior that reduces hospital operating costs or improves performance  Reduce readmission/HAI rates  Improve patient satisfaction scores  Lower supply costs  Enhance efficiency  Reduce LOS
  • 25.
    Page 24 Civil MoneyPenalties  SSA Section 1128A(b): Hospital cannot incentivize physician “to reduce or limit services”  OIG: any reduction or limitation, regardless of medical necessity  Numerous gainsharing advisory opinions  October 2014 proposed rule: not an enforcement priority, provided sufficient safeguards  MACRA revisions: “to reduce or limit medically necessary services”  No implementing regulations from OIG
  • 26.
    Page 25 Necessary Safeguards Cost-saving measures based on evidence and clinical outcomes  External fair market valuation for incentives  Third-party review of performance and payments  Patient safety standards  Stinting on care  Cherry-picking and lemon-dropping  Accelerating discharges  Impact on referrals  Contribution margin issues
  • 27.
  • 28.
  • 29.
    Page 28 Progress toDate One-quarter of commercial plan payments now flow through Category 3/4 APMs.* *Health Care Payment Learning & Action Network 2016 Commercial Payer Survey. Respondents represent over 128-million covered lives, or nearly 44% of the combined commercial, Medicare Advantage, and Medicaid markets.
  • 30.
    Page 29 Cultural Shift IncentivesMeasures Regulators Providers Patients Risk FFS Model  Maximize Patients  Maximize Services  DRGs and APCs  CPTs  Fraud and Abuse Laws  Reimbursement Rules  Silos  Competitors  Unmanaged chronic conditions  Uninvolved with care  Resides with payer  Increasing costs Incentives Measures Regulators Providers Patients Risk APMs and Value- Based  Manage patient population  Coordinate continuum of care  Quality  Efficiency  Network participation  Continuum of care  Collaborate  Educated  Engaged  Moves to providers
  • 31.
    Page 30 APMs andFraud & Abuse Laws  Medicare program waivers  Broad for MSSP; more limited for episodic payments  If comply with specific requirements, DOJ/OIG will not pursue enforcement action  “Automatic” protection for MSSP shared savings distributions  Broader issue?  CMS study: current rules hinder APM participation
  • 32.
    Page 31 Shared SavingsDistributions  Providers’ hesitancy to rely on Medicare waivers  Waivers are relatively untested; may be revised at any time  For non-profits, commercial reasonableness concerns remain  Commercial arrangements not protected by distribution waivers
  • 33.
  • 34.
    Page 33 SAVE THEDATES! September 15-18, 2019 AHIA 38th Annual Conference Omni Nashville Hotel
  • 35.
    PYA, P.C. 800.270.9629 |www.pyapc.com Martie Ross Consulting Principal (800) 270-9629 mross@pyapc.com